
記住我
Standards of midazolam (MDZ), prochlorperazine maleate (PCZM), imipramine hydrochloride (IMP HCl), citalopram hydrobromide (CTP), and chlordiazepoxide (CDEP) were procured from Indian Pharmacopeia, Ministry of Health and Family Welfare, Ghaziabad, Uttar Pradesh, India.
Reagents used in mobile phase selection and preparationButanol (high-performance liquid chromatography [HPLC] grade), methyl ethyl ketone (HPLC grade), strong ammonia solution, ethyl acetate (HPLC grade), dimethyl formamide (HPLC grade), acetic acid (HPLC grade), ethanol (HPLC grade), propanol, toluene (HPLC grade), acetonitrile (HPLC grade), acetone (HPLC grade), methanol (HPLC grade), chloroform (HPLC grade), cyclohexane (HPLC grade), and diethylamine (HPLC grade) were supplied by Merck (Darmstadt, Germany). Pre-coated Merck silica gel 60F254 thin-layer chromatography (TLC) plates (Merck, Mumbai, India) were used for solvent system selection (10 × 10 cm) and method validation (20 × 10 cm). Other glassware, micropipette , and twin-trough development chamber (CAMAG, Muttenz, Switzerland; 20 × 10 cm) were used for the experimental work.
Preparation of standard stock solutionAn aliquot of 100 µg/mL solution was prepared using MDZ, PCZM, IMP HCl, CTP, and CDEP standard dissolved in methanol. Stock solution was filtered and sonicated for 3 min and stored at 4 °C.
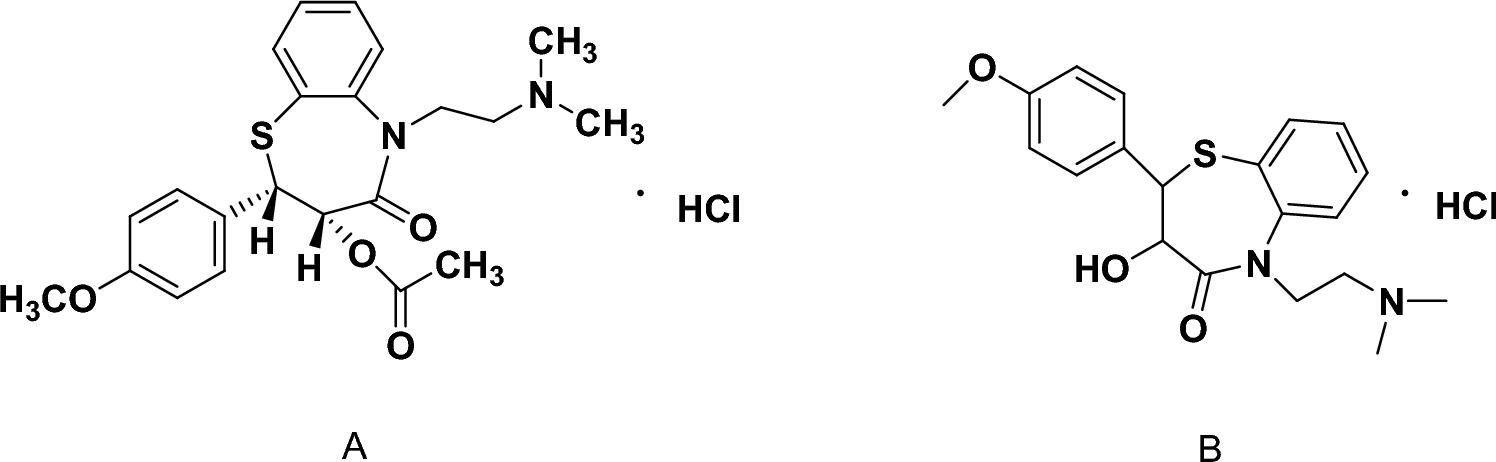
Selection of mobile phase and chromatographic procedureSeries of experiments were performed to find the best mobile phase for the concerned drugs. Different combinations of solvents in different proportions based on the chemistry of the drugs under study were tried. Miscibility chart for different solvents and literature review were referred for this purpose. After several attempts, optimum combination of solvents was selected as the mobile phase and the drugs giving good resolution in the chosen mobile phase were used for further study. Out of the two poorly resolved drugs: PCZM and IMP HCl, one which is in question most of the times and encountered frequently for forensic analysis was selected. With this, the final four drugs, namely, CTP, MDZ, PCZM, and CDEP (Fig. 1) were considered for accomplishing the objectives of this study.
Fig. 1
Source Clarke’s Analysis of Drugs and Poisons, third edition, Pharmaceutical Press, 2005
The chemical structure of A citalopram hydrobromide, B midazolam, C prochlorperazine maleate, D chlorodiazepoxide.
Preparation of spiked sampleSample of urine was collected from a healthy volunteer with no history of drug consumption for the last three months. The urine was screened by TLC for the presence of any drugs prior to selection for this study. Known quantity of drug was added to blank urine sample and the concentration was made to 1000 ppm. This step was repeated for each of the four drugs. Drugs being basic in nature were extracted from spiked urine sample using diethyl ether‒chloroform (80:20, V/V) [15]. A small volume of liquid extraction was used for this purpose in which extraction was done in centrifuge tubes of 15 mL in such a way that the ratio of solvent to sample remained 3:1. After the addition of solvent, the contents were first vortexed at 500 rpm and then were subjected to centrifugation in centrifuge machine for 30 min. After centrifugation, the supernatant or the organic layer was pipetted out of the tubes and transferred to 1.5 mL vials for each drug.
Sample applicationThe standard solutions of the four drugs were applied on the silica gel 60F254 TLC plate in the form of bands having band width of 6 mm each with 25 µL Hamilton microsyringe (Bonaduz, Switzerland) using a CAMAG ATS 4 instrument. Linear ascending development was carried out in twin-trough development chamber. An aliquot of 10 mL of the mobile phase composed of cyclohexane‒toluene‒diethylamine (7:1.5:1.5, V/V) with one drop strong ammonia solution was used. The optimized development chamber saturation time was 30 min at room temperature and the length of chromatographic run was 7 cm (Fig. 2).
Fig. 2
Chromatogram visualized under 254 nm in CAMAG TLC Visualizer 2 (quantity applied: 3–7 µg/band)
DocumentationOnce the development was completed, the developed plate was dried, visualized, and scanned using CAMAG HPTLC set-up. Instrumental details for the entire set-up are given in Table 1.
Table 1 Instrument details and chromatographic conditions for high-performance thin-layer chromatography–mass spectrometry (HPTLC–MS) analysisMethod validationThe HPTLC method was validated for specificity, linearity, accuracy, precision, limit of detection (LOD), limit of quantitation (LOQ), and recovery, in accordance with International Council for Harmonization (ICH) Q2 (R1) [16] guidelines.
SpecificitySpecificity for the analytical method was as curtained by comparing the standard and spiked samples. For this purpose, a blank biological matrix and standard and spiked biological matrix were run under suitable chromatographic conditions and results were obtained accordingly.
LinearityAn aliquot of 1000 µg/mL solution was prepared by transferring 375 µL of each drug from their respective stock solution into a single vial to make volume of 1.5 mL. This was used as the combined working standard solution. It was then used to obtain the linearity curve over the range of 3‒7 µg/band for each substance. Different volumes (3‒7 µL) of this mix were applied to TLC plate with six replicate measurement of 5 µL. Ordinary linear regression analysis was performed for comparing peak areas with their respective concentrations and results were evaluated.
SensitivitySensitivity of the developed method was ascertained by evaluating LOD and LOQ as per the ICH guidelines. The calibration curve was plotted between the amount of analyte versus average response (peak area), and the regression equation with regression coefficient was obtained. Standard deviation of the responses was determined and the detection limit and quantification limit were calculated using the formula:
$$} = . \times \sigma /S$$
$$} = 0 \times \sigma /S$$
where σ = standard deviation of residual regression and S = slope of calibration curve.
PrecisionIt determines the degree of closeness of the measured values of a same sample when applied repeatedly to multiple aliquots. As per the validation guidelines, precision can have three different meanings.
RepeatabilityCombined working standard solution (5 µL) was spotted on TLC plate six times, the plate was developed, dried, and analyzed using the same measurement procedure, the same measuring system, the same operators, and the same operating conditions at the same location. The peak area of each band and concentration for each drug were measured and relative standard deviation (RSD) for the amount of drug found was calculated.
Intra-day precisionFor this, RSD was determined by analyzing combined working standard solution of all the four drugs at application volume of 5 µL for two times on the same day.
Inter-day precisionFor this, RSD was determined by analyzing combined working solution of four drugs at application volume of 5 µL for two times on two different days.
Intermediate precisionIn this type of precision, changes are considered over a longer period of time, typically several months. This type is also known as within-lab reproducibility. In this, the results are obtained in the same lab after a gap of several months. Though all the conditions are again tried to keep constant, this type would show larger deviation in results as compared to repeatability.
ReproducibilityThis step is useful to conduct when the analytical method is standardized. In this, results are obtained by performing the similar experiment in different laboratories and, thus, also known as between-lab reproducibility.
Accuracy and recoveryAccuracy is defined as the degree of agreement between the experimental value, obtained by replicate measurements, and the accepted reference value. It includes both trueness and precision of the results. For this validation step, spiked samples at three different concentrations, 80%, 100%, and 120%, of the target concentration were used and three individually prepared replicates at each concentration were analyzed. For each sample, theoretical value, assay value, and percent recovery were reported and mean and percent recovery for the four analytes under consideration were calculated.
Mass spectrumThe identification of analyte was performed using TLC‒MS Interface 2, equipped with electrospray ionization (ESI) operated in the positive ionization mode. Chromatography separation of analytes was done using the conventional methods. The TLC‒MS Interface was then positioned on the band and it was operated at the semi-automatic mode. The eluted substance from the band entered into the MS source through ESI source and the m/z values of the analytes were obtained.
留言 (0)