
記住我


The Institutional Review Board and the General Clinical Research Center Review Board of the University of Texas Medical Branch (UTMB) at Galveston reviewed and approved the protocol and experimental procedures prior to the start of this study (Protocol number 09–215). Inclusion criteria included, men or non-pregnant women in good health, between 21 to 35 years of age and 60 to 75 years of age. Written informed consent was obtained from all subjects and all subjects scored ≥ 26 Mini-Mental State Exam. Subjects were excluded if they had a history of cardiovascular disease determined by history of hypertension, peripheral vascular diseases, heart attack or stroke and previous echocardiographic evidence of diastolic dysfunction (E/e’ > 10) or systolic dysfunction (EF% < 50%). Subjects were also excluded when presenting with cardiac conduction defects, bleeding disorders, anemia, diabetes, neurologic, renal, endocrine or lung diseases (e.g. asthma or chronic obstructive pulmonary disease), known allergic reactions to indocyanine green dye, shellfish or iodine, history of more than 20 pack-years tobacco smoking, alcohol or drug abuse, positive tests for hepatitis or HIV, presence of acute illness or medically unstable chronic illness, or if they were on hormone replacement therapy.
Study preparation and experimental proceduresThis was a prospective, paired, study performed in nineteen healthy volunteers at the General Clinical Research center (GCRC), UTMB. Volunteers were instructed not to eat or drink after midnight, the day before the study. On the day of the study, the volunteers reported to the GCRC. Vital signs (heart rate (HR), non-invasive blood pressure measurement and of peripheral oxygen saturation by plethysmography) and weight were obtained. The subjects were positioned supine in a hospital bed. A three lead ECG, pulse oximeter (Nellcor N600, Covidien PLC, Dublin, Ireland) and blood pressure cuff were placed and connected to a clinical monitor (Viridia 24CT, Hewlett Packard Inc., Palo Alto, CA, USA). Two venous catheters (18 G, B. Braun AG, Melsungen, Germany) were placed in each arm (either the median cubital vein or a forearm vein) for drug and fluid administration, respectively. An arterial catheter (20 G, Abbocath, Hospira Inc., Lake Forrest, IL, USA) was placed in the radial artery under local anesthesia (1% Lidocaine, 2 mL, Hospira Inc., Lake Forrest, IL, USA) and connected to a pressure monitoring kit (Transpac, Abbott Laboratories Inc., Abbott Park, IL, USA) with a 0.9% NaCl (Baxter Healthcare Corp., Deerfield, IL, USA) pressure bag.
Each subject underwent identical fluid protocols. The specific time points and interventions were (Fig. 1):
T minus 30 (T-30), after monitors and catheters were placed. Initial plasma volume was determined by indocyanine green.
T minus 10 (T-10), Measurements were obtained prior to fluid infusion.
T zero (T0), start of the 10 mL/kg 0.9% saline fluid bolus (Baxter Healthcare Corp., Deerfield, IL, USA)
T twenty (T20), end of fluid bolus.
T sixty (T60), 60 min after start of fluid bolus.
T one hundred twenty (T120), end of study.
Fig. 1
Illustration of experimental protocol
Details of the specific measurements and timing are described in detail below.
Hemodynamic and echocardiography measurementsMeasurements for HR and mean arterial blood pressure (MAP) were recorded at T-30, T0, T5, T10, T15, T20, T30, T60, T90 and T120. Echocardiographic (ventricular volume and function) parameters were measured by transthoracic echocardiography using a 3.5 MHz transducer and ultrasound machine (Vivid 7 PRO BT04, General Electric Medical Systems Inc., Milwaukee, WI, USA). Left ventricle (LV) area and length were interrogated in parasternal long axis position. The Modified Simpson’s rule was applied for calculation of end-diastolic (EDV), end-systolic volume (ESV). Stroke volume (SV) was determined from the calculation of EDV – ESV and the ejection fraction (EF%) was determined by SV/EDV. Cardiac output (CO) was calculated from SV • HR. Systemic vascular resistance (SVR) was calculated from CO/MAP. Echocardiographic parameters were measured at T-30 min, T0, T20, T60 and T120. The transthoracic echocardiographies were performed by the senior author, who is a highly experienced anesthesiologist and intensive care physician.
Volumetric and fluid measurements in mL/kgThe distribution of the 10 mL/kg 0.9% saline fluid bolus was calculated in three compartments (plasma, urine and interstitial volume (extravascular volume)) using mass balance after T0. Cumulative urinary output (UO) was measured via an ultrasound bladder scanner (BVI 3000, Verathon Inc., Bothell, WA, USA). Measurements were obtained at T0, T20, T60, T90 and T120. Initial plasma volume (PV) was determined with the spectrophotometric detection of indocyanine green (ICG, Akron Inc., Lake Forrest, IL, USA) using optical densitometry bound to plasma proteins (Henschen et al. 1993). Specifically, 5 mg ICG was injected intravenously at T-15. Blood samples were taken every minute for six minutes. The amount of ICG bound to plasma proteins (PVICG) was measured at 840 nm using spectrophotometry (DU 800, Beckman Coulter Inc., Brea, CA, USA). The change in PV (ΔPV) is directly proportional to the initial plasma volume + changes in hematocrit (ΔPV ~ PVi + ΔHematocrit after/initial) (Henschen et al. 1993). Arterial blood for hemoglobin and hematocrit were taken prior to, during and after the fluid bolus to calculate vascular volume expansion. Specifically, samples were obtained at start of fluid bolus and every two minutes during the fluid bolus, every five minutes until T60 and then every 30 min until T120. Plasma Volume (PV) along with hemoglobin/hematocrit at specific time points was used to calculate PV expansion that occurred after the fluid bolus. Change in extravascular volume (EVV) over time (ΔEVV) was calculated from UO, plasma volume and total fluid administered: ΔEVV = infused volume—(ΔPV + UO + fluid infused) (Stephens et al. 2011; Kinsky et al. 2008).
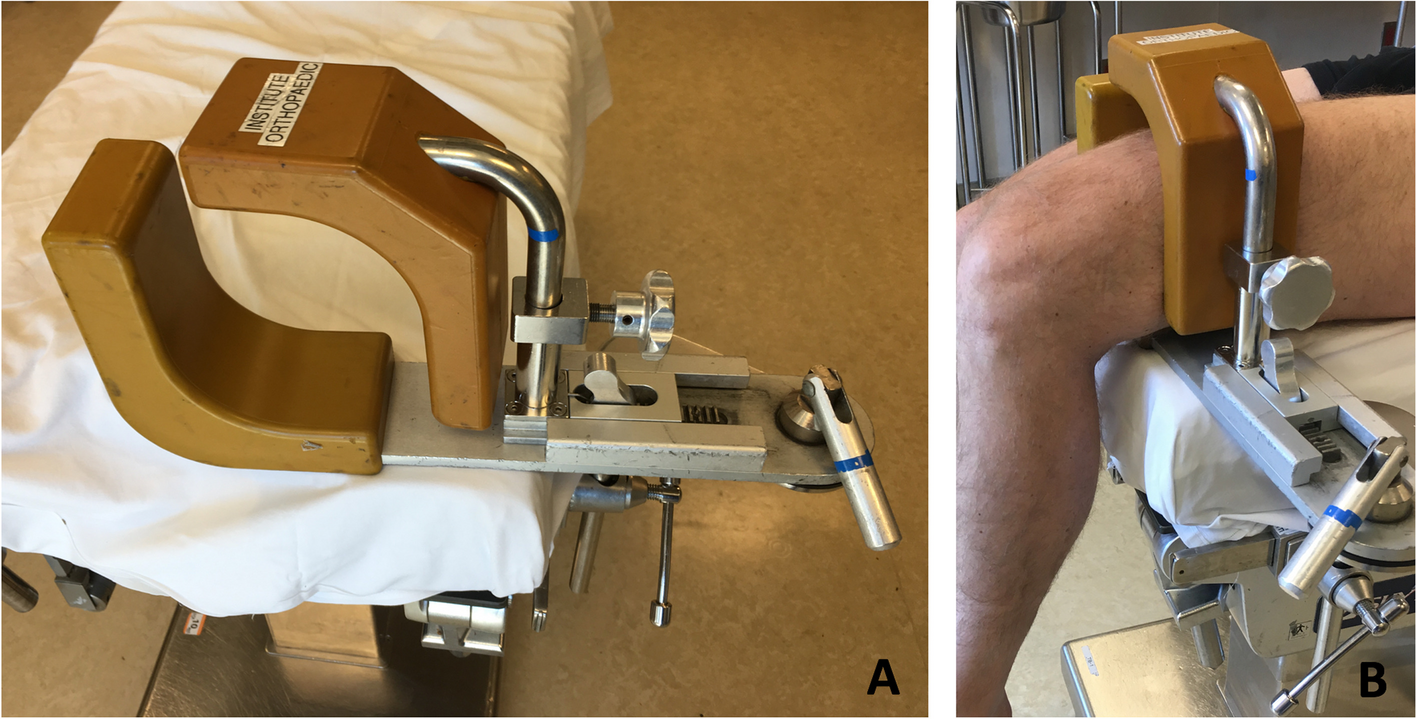
Microcirculatory measurementsThe capillary filtration coefficient (CFC) was determined in vivo using venous congestion plethysmography (VCP). In brief, step-wise increases in venous pressure were performed by applying a pressurized cuff on the thigh and a mercury-silastic strain gauge transducer on the calf (Hokanson EC6 strain gauge plethysmograph, D.E. Hokanson Inc., Bellevue, WA, USA) (Fig. 2a) (Gamble et al. 1993; Gamble et al. 1992; Christ et al. 1993; Christ et al. 1995). The change in limb volume/girth, measured by the strain gauge transducer, represents the net fluid filtration or Jv (in which each % = 1 mL/100 mL tissue) if the exceeded filtration pressure of Pv (via the pressurized cuff in mmHg) is held for several minutes. Thus, CFC was determined from the % girth over time (net fluid filtration (∆Jv)) divided by the changes in venous pressure (∆Pv) as: CFC = ∆Jv/∆Pv. Three separate inflation pressures (~ 30, 45 and 60 mmHg), each sustained for three minutes, were performed before fluid bolus, during and immediately at end of fluid bolus, one hour after fluid bolus and study end (T-30, T-10, T0, T20, T60 and T120). The collection of these measurements provided insight into derangements in the Starling Equation, as described below.
Fig. 2
Capillary filtration coefficient measurement: Schematic of patient setting with mercury silastic stain gauge (a) and sample of measured results and calculation (b)
The amount of pressure applied to the cuff, limb girth % and time (min) were digitally sampled and stored using Powerlab (ADInstruments Inc., Colorado Springs, CO, USA). The CFC was determined from an offline analysis using the shallow slope from the change of % limb girth and time (Fig. 2b). VCP measurements at each time point took approximately nine to twelve minutes to complete.
Blood samples, taken at the same time points as CFC measurements, for total protein and albumin were analyzed using a protein analyzer (Vitros Fusion 5.1, Ortho Clinical Diagnostics Inc., Raritan, NJ, USA). The plasma colloid osmotic pressure (COPpl) was estimated using a derived formula from these constituents as previously described in detail (Kinsky et al. 1998a; Navar and Navar 1977). A full list of measured variables can be found in Table 1.
Table 1 List of measured variables in this studyStatistical analysisPower calculation: Our statistical hypothesis was that the capillary filtration coefficient (CFC) would be reduced and less responsive in older subjects. Therefore, sample size determination was based on the primary outcome, basal CFC. Data obtained in previous young healthy volunteers showed that CFC was 2.6 ± 1.0 (mean ± SD). We surmised that older adults would result in a 50% lower CFC, based on lower transcapillary fluid reabsorption rates reported in older adults. A sample size of 10 per group would have 80% power to detect an effect size of 1.000 using a two-group t-test with a 0.050 two-sided significance level. Thirteen subjects in each group were recruited to accommodate for attrition.
Students t-test and two-way analysis of variance were used for data analysis. Bonferroni post hoc comparison was used when applicable. Statistical analyses were performed using Prism 4 for Mac (GraphPad, Software Inc, La Jolla, USA). Data are expressed as mean ± S.E.M. Statistical significance was accepted when p ≤ 0.05.
留言 (0)