
記住我

A total of 234 patients included in the study had PK parameters of at least one of AUCss, Cmax,ss, or CD15 (Table 1). A total of 127 patients had AUCss and Cmax,ss values, of which 19 patients were classified into the ARA group and 108 patients into the non-ARA group. A total of 229 patients had CD15 values, of which 23 patients were classified into the ARA group and 206 patients into the non-ARA group. The dose level not classified as ARA group in any patient was only 20 mg. Demographics and baseline characteristics of liver and renal function of the patients between the ARA group and non-ARA group are shown in Table S1 in the supplementary material. There were no baseline differences between the two groups that could significantly affect the interpretation of the effect of ARAs on the pharmacokinetics of lazertinib. The ARA administration information for the ARA group is summarized in Table S2 in the supplementary material.
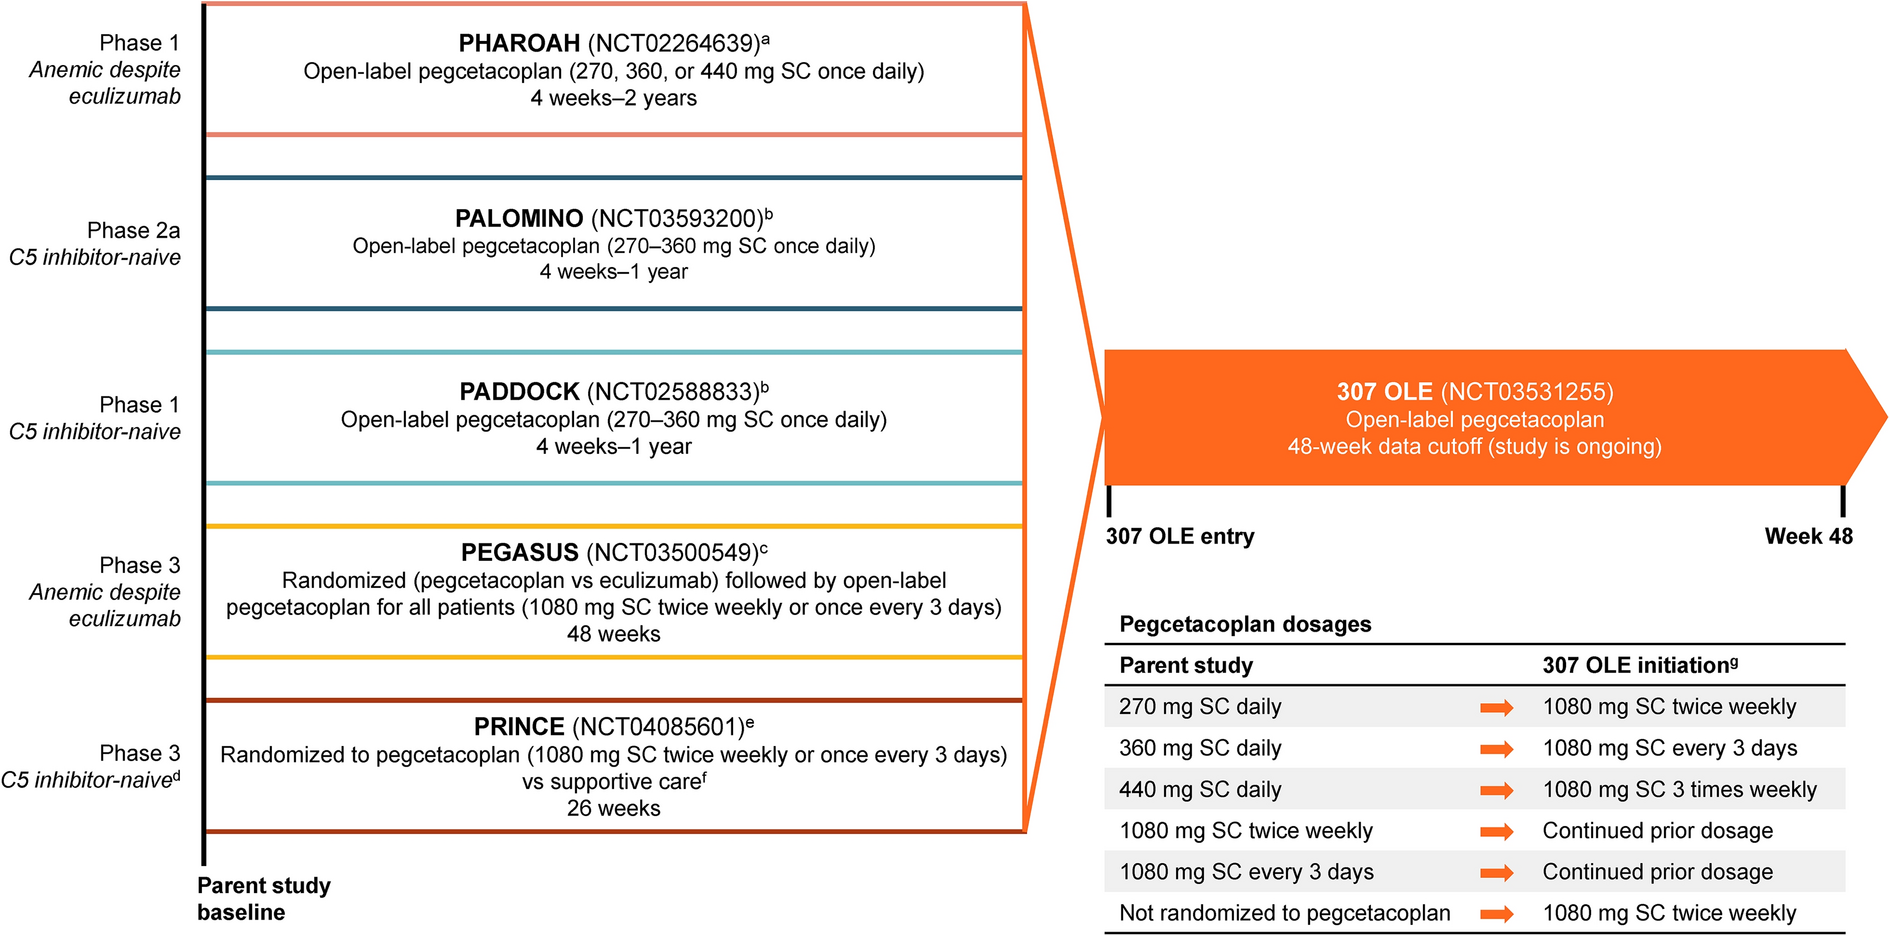
Table 1 Patient dispositionDose ProportionalityThe Cmax,ss increased in a dose-proportional manner over the dose range of 20 to 320 mg (90% CI of slope in the power model, Cmax,ss 0.9790–1.1633) (Table 2). However, the AUCss and CD15 increased in a slightly more than dose-proportional manner over the dose range of 20 to 320 mg (90% CI of slope in the power model, AUCss 1.0042–1.1827, CD15 1.0731–1.2671). As no patient at 20 mg was classified into the ARA group (Table 1), the dose proportionality was reassessed by excluding 20 mg. In the dose range of 40 to 320 mg, the AUCss and Cmax,ss increased in a dose-proportional manner, but the CD15 increased in the slightly more than dose-proportional manner (90% CI of slope in the power model, AUCss 0.9706–1.1617, Cmax,ss 0.9533–1.1507, CD15 1.0470–1.2557) (Table 2 and Fig. 1). The sequential dose exclusion for the dose proportionality assessment was discontinued because at least one patient at 40 mg and higher doses was classified into the ARA group.
Table 2 Dose proportionality of lazertinib using a power modelFig. 1
Dose proportionality of lazertinib in the dose range of 40 to 320 mg. The circles represent the observed values, the black straight line represents the linear regression line, and the red and blue dashed lines represent the 90% confidence limits and 90% prediction limits, respectively: a ln(AUCss) versus ln(dose); b ln(Cmax,ss) versus ln(dose); c ln(CD15) versus ln(dose)
In the dose range of 40 to 320 mg, the AUCss and Cmax,ss increased in a dose-proportional manner, and the slope values of the AUCss, Cmax,ss, and CD15 were closest to 1. Therefore, the use of the dose-normalized PK parameters in the dose range of 40 to 320 mg was judged to be appropriate to explore the effect of the ARAs on the pharmacokinetics of lazertinib.
Effect of Acid-Reducing Agents in Dose Range of 40 to 320 mgFor the AUCss and Cmax,ss analysis, a total of 124 patients who had administered 40 to 320 mg of lazertinib with the dose proportionality were included, of which 19 patients were classified into the ARA group and 105 patients into the non-ARA group (Tables 1 and 2). For the CD15 analysis, a total of 226 patients who had administered 40 to 320 mg of lazertinib closest to the dose proportionality were included, of which 23 patients were classified into the ARA group and 203 patients into the non-ARA group.
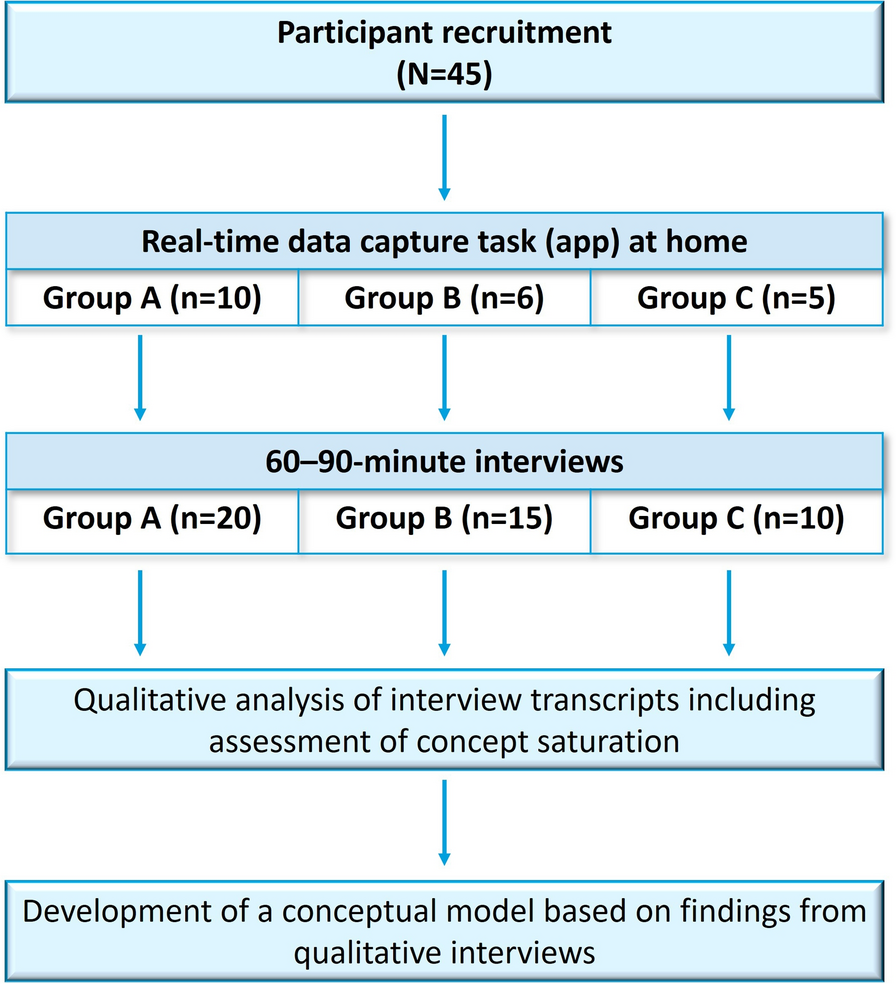
In the dose range of 40 to 320 mg of lazertinib, the arithmetic means (arithmetic coefficient of variation %, CV%) for the DNAUCss were 25.51 (59.9%) and 27.61 (42.9%) h·ng/mL/mg in the ARA group and non-ARA group, respectively (Table 3). The arithmetic means (arithmetic CV%) for the DNCmax,ss were 1.97 (50.1%) and 2.14 (44.3%) ng/mL/mg in the ARA group and non-ARA group, respectively. The arithmetic means (arithmetic CV%) for the DNCD15 were 0.66 (62.1%) and 0.72 (63.4%) ng/mL/mg in the ARA group and non-ARA group, respectively. There were no noticeable differences in the distribution of lazertinib exposure between the two groups at both 40 to 320 mg dose range (Fig. 2).
Table 3 Summary of pharmacokinetic parameters of lazertinib according to the ARA group and non-ARA groupFig. 2
Comparison of the dose-normalized pharmacokinetic parameters of lazertinib between the ARA and non-ARA groups in the dose range of 40 to 320 mg. The dashed and solid lines across each box represent the median and arithmetic mean of the dose-normalized pharmacokinetic parameters, respectively. The upper and lower whiskers represent the maximum and minimum values within 1.5-fold interquartile range: a dose-normalized AUCss; b dose-normalized Cmax,ss; c dose-normalized CD15
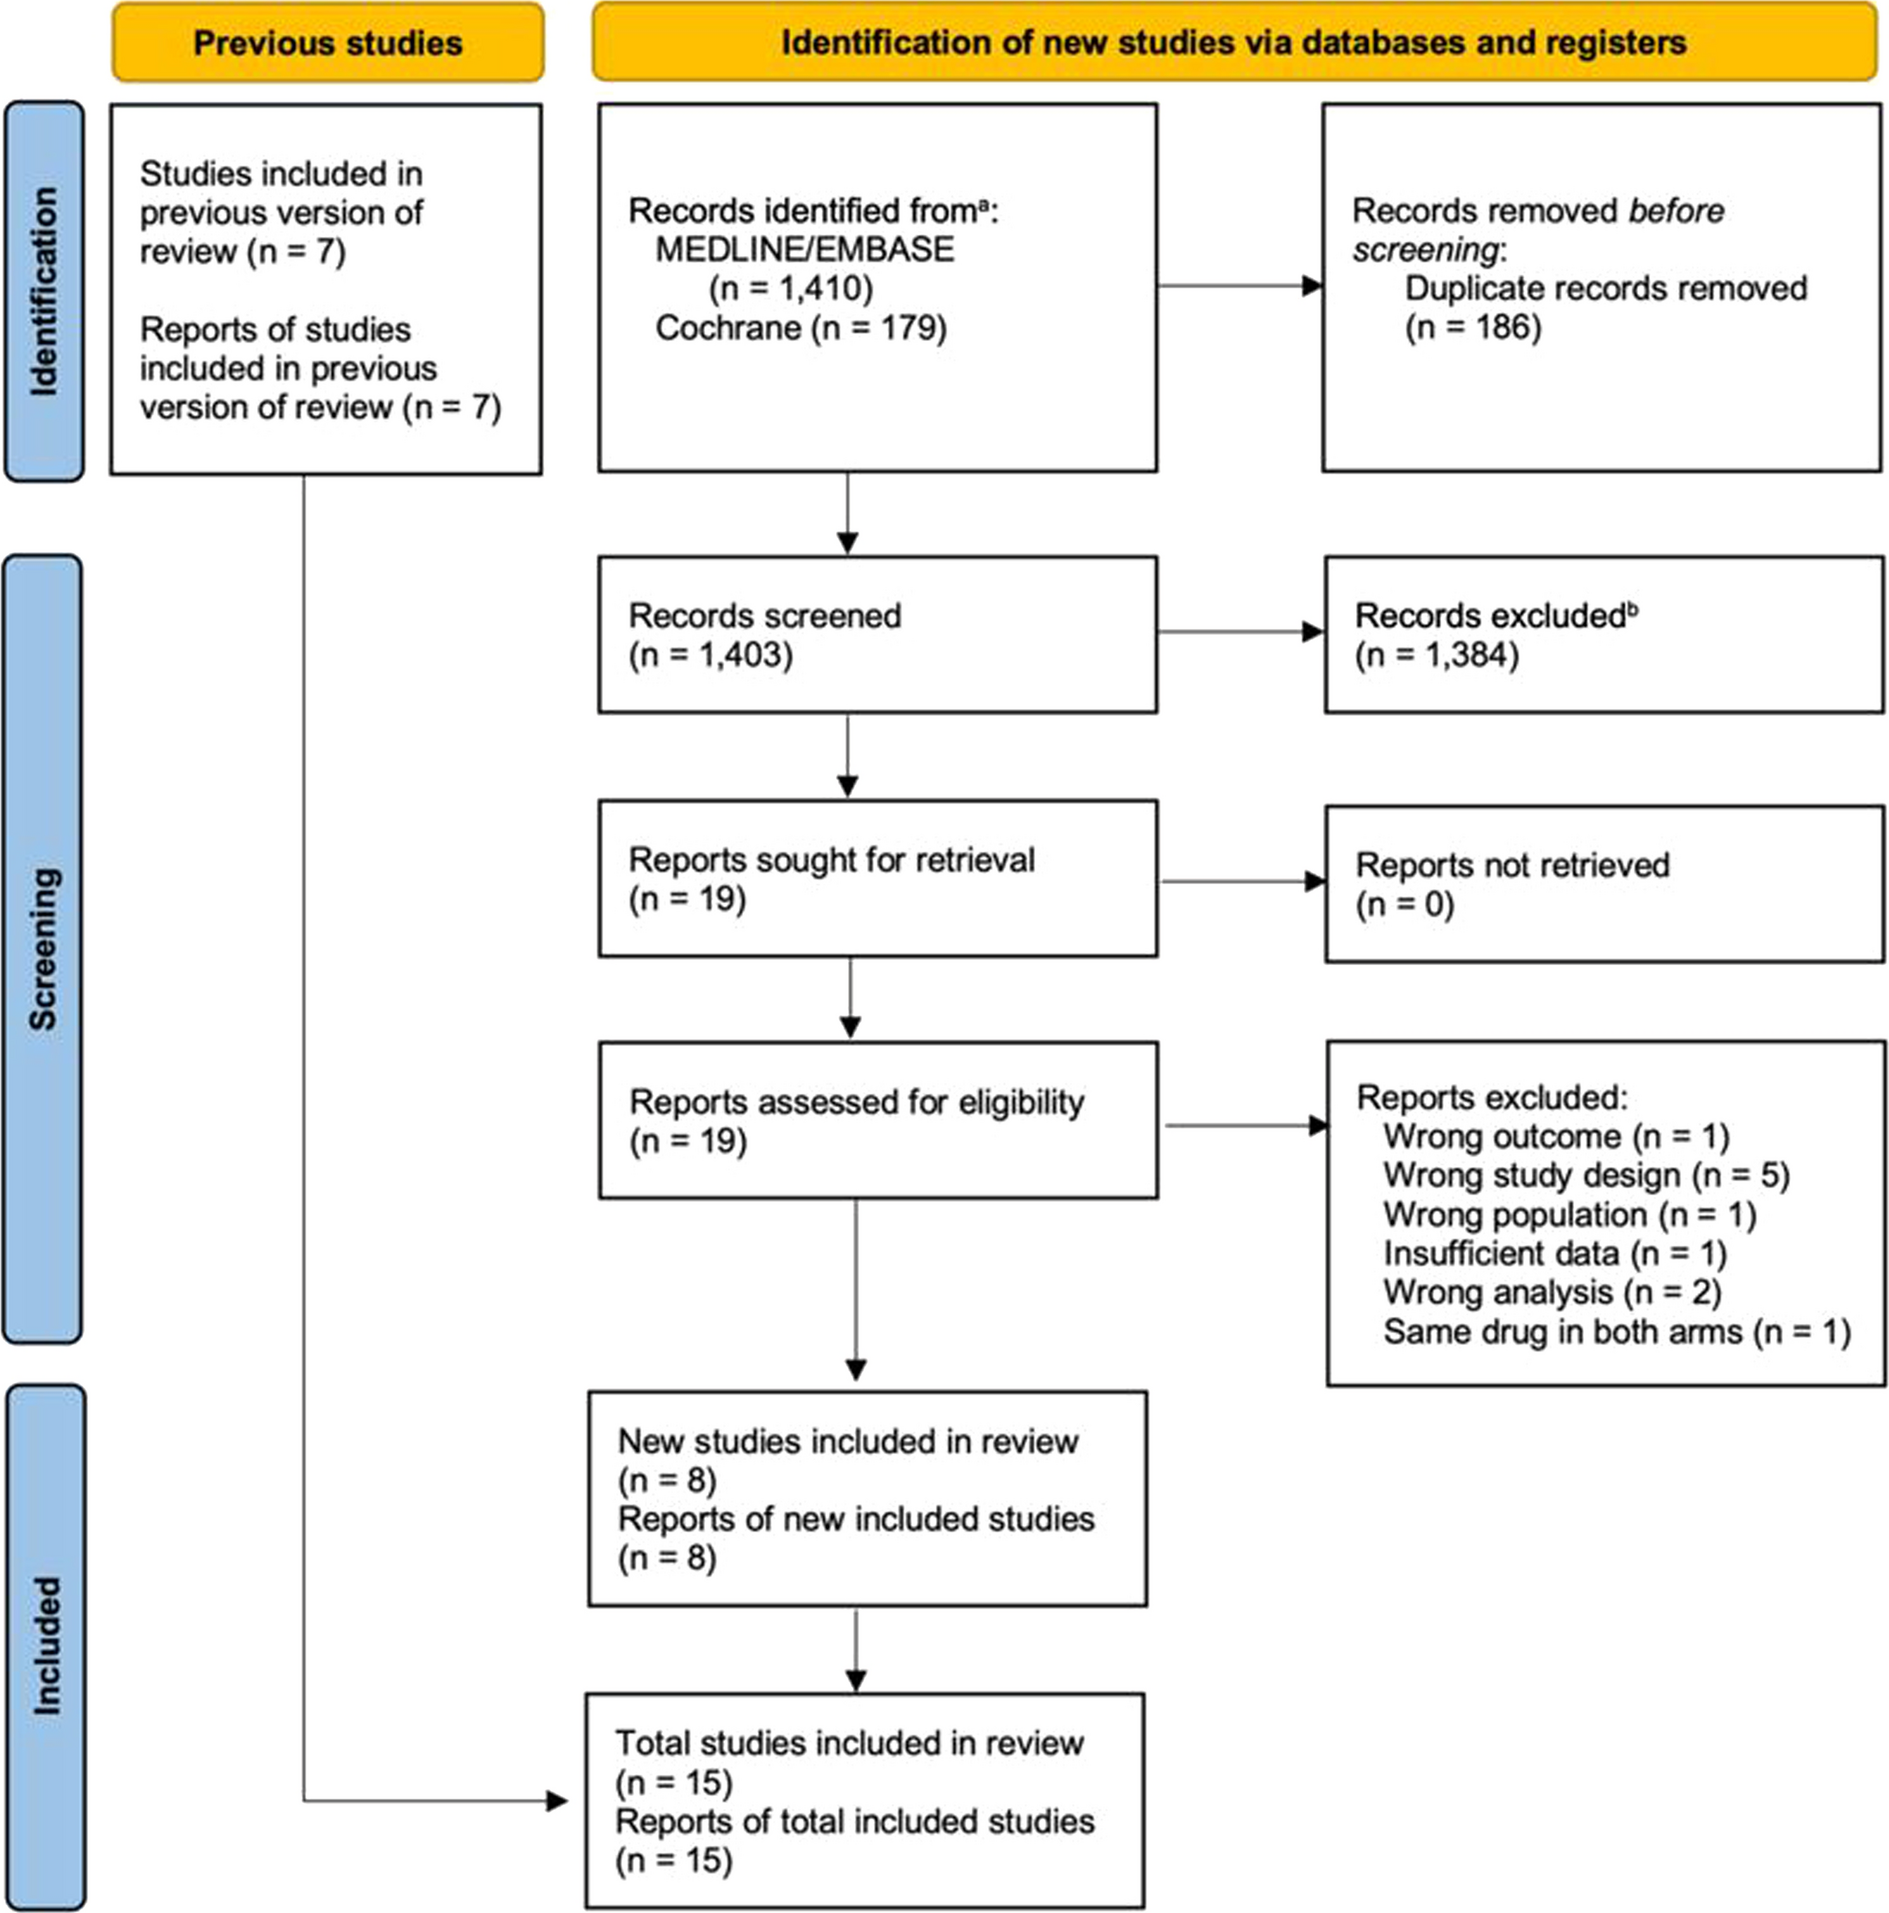
The geometric mean ratios (90% CIs) of ARA group to non-ARA group for the DNAUCss, DNCmax,ss, and DNCD15 were 0.8743 (0.7285–1.0493), 0.9035 (0.7482–1.0910), and 0.9126 (0.7364–1.1311), respectively (Table 4 and Fig. 4). On the basis of the results of the analysis of variance (Table 5), the DNAUCss, DNCmax,ss, and DNCD15 were not significantly different between the two groups (all p values > 0.05).
Table 4 Statistical assessment of effect of acid-reducing agents on pharmacokinetics of lazertinibTable 5 Analysis of variance for statistical assessment of effect of acid-reducing agents on pharmacokinetics of lazertinibEffect of Acid-Reducing Agents at 240 mgA total of 115 patients received 240 mg of lazertinib among all 234 patients who had at least one of the PK parameters in the study (Table 1). Of these, for the AUCss and Cmax,ss analysis at 240 mg, a total of 33 patients were included, of which 9 patients were classified into the ARA group and 24 patients into the non-ARA group. For the CD15 analysis at 240 mg, a total of 125 patients were included, of which 10 patients were classified into the ARA group and 115 patients into the non-ARA group.
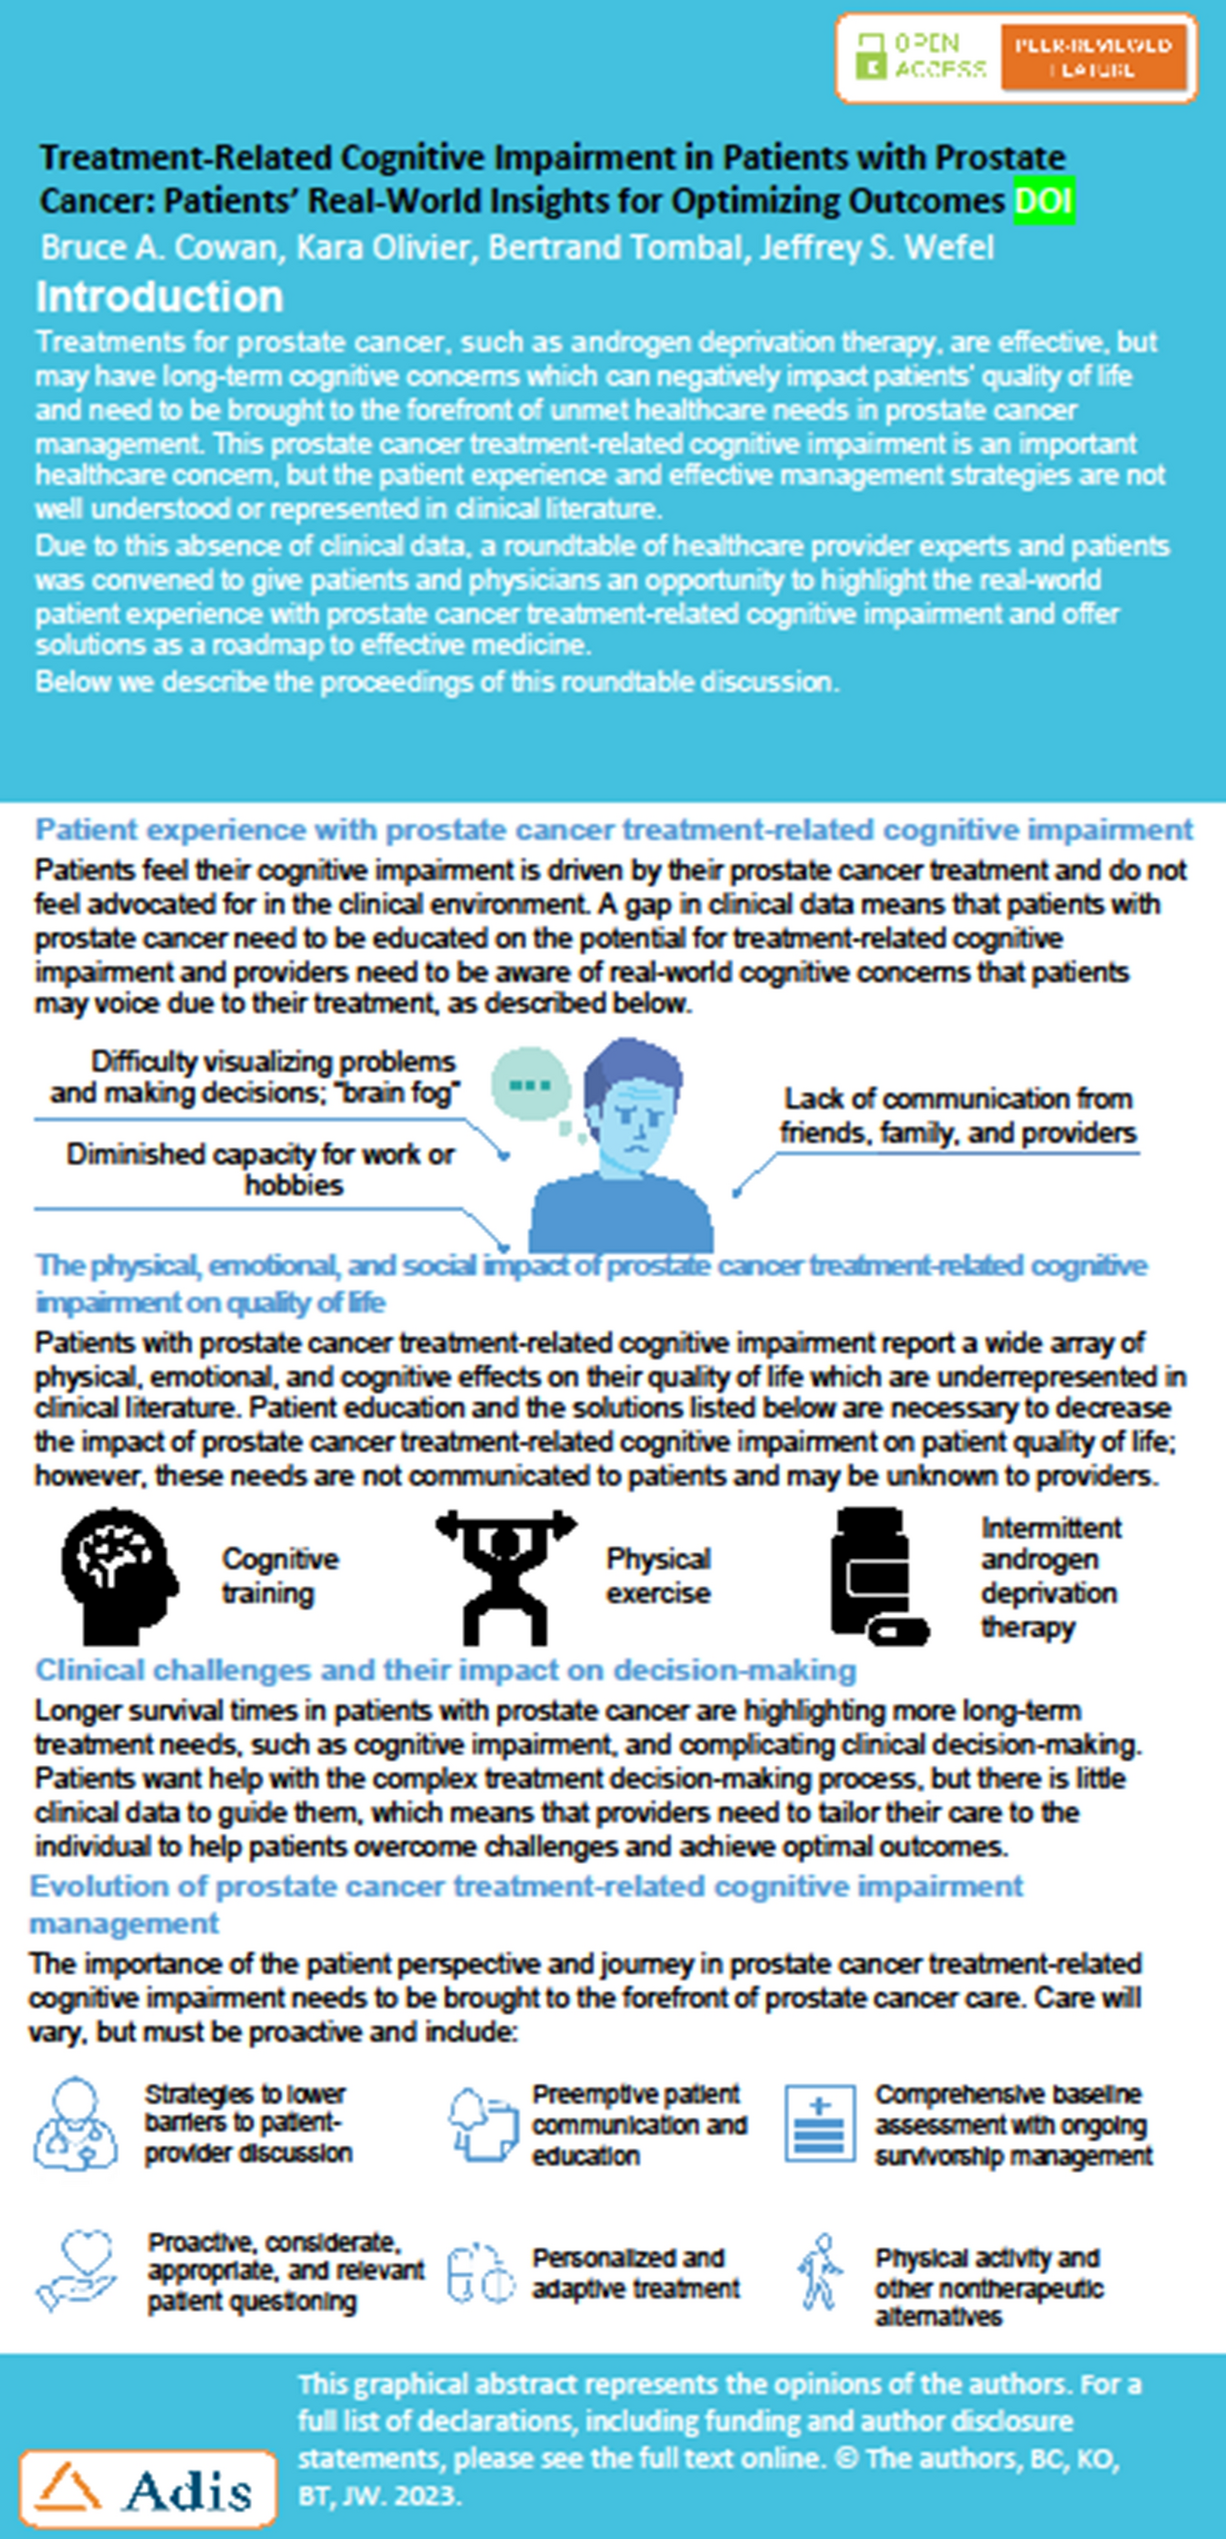
In the lazertinib 240 mg group, the arithmetic means (arithmetic CV%) for the AUCss were 6673.26 (66.8%) and 6754.43 (48.9%) h·ng/mL in the ARA group and non-ARA group, respectively (Table 3). The arithmetic means (arithmetic CV%) for the Cmax,ss at 240 mg were 492.73 (54.7%) and 522.39 (40.4%) ng/mL in the ARA group and non-ARA group, respectively. The arithmetic means (arithmetic CV%) for the CD15 at 240 mg were 159.01 (62.4%) and 175.70 (59.4%) ng/mL in the ARA group and non-ARA group, respectively. There were no noticeable differences in the distribution of lazertinib exposure between the two groups at 240 mg (Fig. 3).
Fig. 3
Comparison of the pharmacokinetic parameters of lazertinib between the ARA and non-ARA groups at 240 mg. The dashed and solid lines across each box represent the median and arithmetic mean of the pharmacokinetic parameters, respectively. The upper and lower whiskers represent the maximum and minimum values within 1.5-fold interquartile range: a AUCss; b Cmax,ss; c CD15
The geometric mean ratios (90% CIs) of ARA group to non-ARA group for the AUCss, Cmax,ss and CD15 were 0.9136 (0.6637–1.2576), 0.9012 (0.6703–1.2116), and 0.8850 (0.6463–1.2118), respectively (Table 4 and Fig. 4). According to the analysis of variance (Table 5), the AUCss, Cmax,ss, and CD15 at 240 mg did not show any significant difference between the two groups (all p values > 0.05).
Fig. 4
Geometric mean ratios of ARA group to non-ARA group with 90% confidence intervals of pharmacokinetic parameters of lazertinib: empty circle, square, and triangle represent the geometric mean ratio of the dose-normalized AUCss, Cmax,ss, and CD15 of ARA group to non-ARA group, respectively, in the dose range of 40 to 320 mg. Filled circle, square, and triangle represent the geometric mean ratio of the dose-normalized AUCss, Cmax,ss, and CD15 of ARA group to non-ARA group, respectively, at 240 mg. The line extending from the point represents the 90% confidence interval for each geometric mean ratio
留言 (0)