
記住我


First, after 24 h-incubation, the cytotoxic effect of CFZ on Raw264.7 cell lines by CCK-8 assay after treatment was estimated with different doses. The results showed that IC50 of CFZ in the Raw264.7 cells was 4.1 μM (Fig. 2b). The non-toxic concentrations (4 μM) were used for the following experiment. Then, after different concentrations (0.05, 0.1, 0.25, 0.5, 1, 10 and 100 μg/mL) of LPS were applied, the viability of cells remained the same after treatment with 100 μg/mL of LPS compared to the control group (Fig. 2c). Therefore, 100 ng/mL was selected as the optimal concentration of LPS for activating the macrophages. Additionally, the results of CCK-8 assay also revealed that LPS promoted the viability of Raw264.7 cells, while CFZ could significantly reduce the proliferation of Raw264.7 cells (Fig. 2d).
A dynamic protein expression landscape of CFZ and LPSTo study the damage of LPS and CFZ on the Raw264.7 cells, shotgun proteomics was utilized to discover the alteration of protein expression patterns. 4746 and 4766 proteins were identified with quantitative information in this study (Fig. 2e). Then, the correlation between LPS and CFZ proteomic data in each timepoint (0 h, 2 h, 8 h, and 24 h) was analyzed by Mfuzz. In total, it is found that six distinct clusters of temporal patterns representing proteins are regulated differently, indicating different expression kinetics. Among the 4746 proteins of LPS, clusters 1 represents up-regulated proteins, clusters 2 and 3 represent down-regulated proteins, whereas clusters 4, 5, and 6 represent proteins displaying a bimodal expression pattern (Fig. 3a, b; Supplementary Table S1). Among the 4766 proteins of CFZ, clusters 1 and 3 represent proteins are down-regulated, clusters 4 and 5 represent proteins are up-regulated, whereas clusters 2 and 6 represent proteins displaying a bimodal expression pattern (Fig. 3c, d; Supplementary Table S2). By overlaying Mouse Genome Informatics (MGI, http://www.informatics.jax.org/) containing primarily inflammatory response proteins (IRPs), we found, intriguingly, that IRPs mainly showed a low expression level in clusters 1 and 3 of CFZ and a high expression level in clusters 1 of LPS (Fig. 3e). These proteins play critical roles in regulating inflammation, such as SYK, GSDMD, CELF1, NFκB1, MYD88, AIM 2, PTPN2, STAT5A, IL16, NCF1, PIK3AP1, DDX3X, RIPK1, FCGR1, COX2, etc. (Supplementary Table S3). The enrichment of the KEGG pathway included the leishmaniasis, NF-kappa B (NF-κB) signaling pathway, hepatitis B, osteoclast differentiation, tuberculosis, B cell receptor signaling pathway, toll-like receptor signaling pathway, measles, epstein–barr virus infection, etc. (Fig. 3f).
Fig. 3
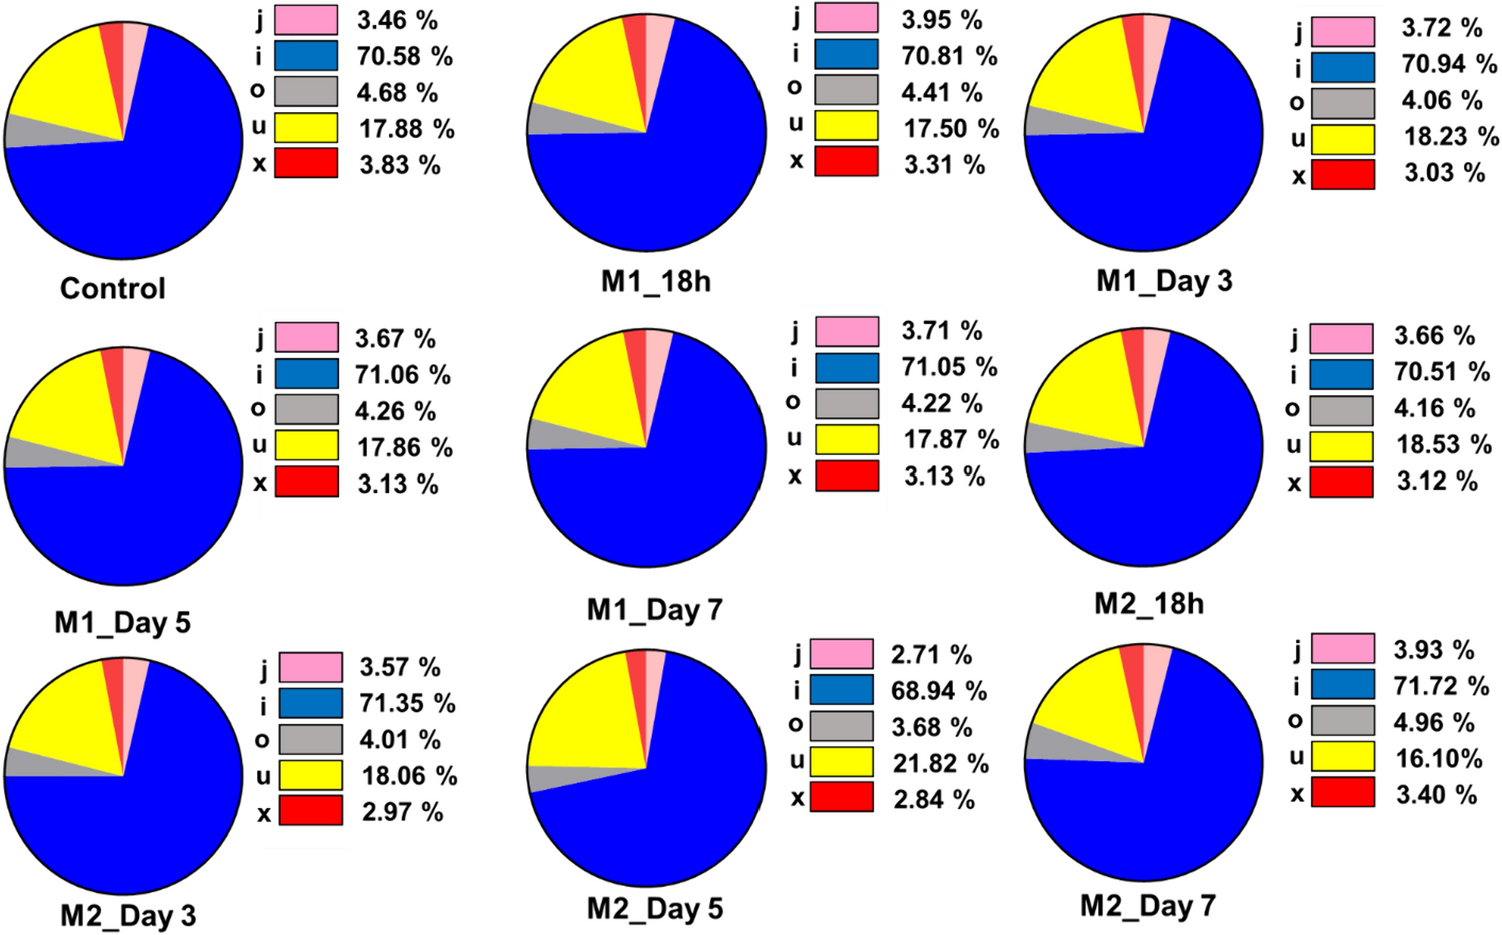
Temporal profiles of protein expression in each timepoint (0 h, 2 h, 8 h, and 24 h) in Raw264.7 macrophage cells. a Mfuzz clustering identified six distinct temporal patterns of proteins expression of LPS. b The left pie chart shows the number of proteins of LPS in six dynamic expression clusters in (b), the right pie chart shows the number of inflammatory proteins of LPS in six dynamic expression clusters in (b). c Mfuzz clustering identified six distinct temporal patterns of proteins expression of CFZ. d The left pie chart shows the number of proteins of CFZ in six dynamic expression clusters in (d), the right pie chart shows the number of inflammatory proteins of CFZ in six dynamic expression clusters in (d). e Venn diagram shows the opposite expression patterns of 30 inflammatory proteins identified by LPS (green) and CFZ (purple) comparisons. f KEGG pathway analysis of opposite protein clusters
Hierarchical cluster analysis of the protein identification and functionsPrincipal component analysis (PCA) results showed that each sample within treatment groups shared a similar expression pattern, whereas it displayed a distinguished pattern between each time point (i.e., three samples per treatment, LPS and CFZ enriched for four time points, 0, 2, 8, and 24 h, p < 0.05; Fig. 4a). To gain better insight into the difference of protein expression profiles of LPS and CFZ (0 h, 2 h, 8 h, and 24 h), we performed the degree of differential proteins in each sample by hierarchical clustering and heatmap. To reveal the molecular mechanism of proteins in each cluster and understand their biological significance, KEGG pathway analysis were performed on differentially expressed proteins in the LPS and CFZ dataset (ANOVA, FDR < 0.01, p < 0.05). The LPS dataset in cluster 1 mainly involves ribosome, spliceosome, RNA transport, biosynthesis of antibiotics, and phagosome. Cluster 2 proteins participate in systemic lupus erythematosus, spliceosome, alcoholism, viral carcinogenesis, and proteasome. Cluster 3 is enriched in herpes simplex infection, viral carcinogenesis, ubiquitin-mediated proteolysis, alcoholism, spliceosome. Intriguingly, the KEGG analysis of CFZ suggest that cluster 1 is mainly enriched in pathways including biosynthesis of antibiotics, spliceosome, RNA transport, carbon metabolism, and metabolic pathways. Cluster 2 is involved in systemic lupus erythematosus, alcoholism, carbon metabolism, biosynthesis of antibiotics, and viral carcinogenesis. Cluster 3 is mainly associated with spliceosome, biosynthesis of antibiotics, metabolic pathways, carbon metabolism, and citrate cycle (TCA cycle). Overall, the CFZ clustering analysis revealed that KEGG pathway has similar biological features to those obtained from the LPS dataset. (Fig. 4b; Supplementary Table S4 and Table S5).
Fig. 4
Principal component analysis of temporal proteomic data and their biological functions. a PCA analysis of LPS and CFZ protein. b Hierarchical cluster and heatmap show significant values of KEGG pathway describing each of clusters
Essential pathways of CFZ in proteomeThe distribution of proteins is identified at each time point (0, 2, 8, and 24 h), then they are represented in Venn diagrams (FDR < 0.01, p < 0.05, fold change > 2 or fold change < 0.5; Fig. 5a). Notably, by comparing the expression levels of total proteins, the differentially expressed proteins (DEPs) at each time point (0, 2, 8, and 24 h) were screened (FDR < 0.01, p < 0.05, fold change > 2 or fold change < 0.5; Fig. 5b). Volcano plots is a scatter graph used to highlight the up-regulated, down-regulated proteins and spatial occurrence in large datasets. As shown in Fig. 5c, the great alterations in the Raw264.7 proteome were induced by LPS and CFZ at the 24 h time point, where 1203 (Supplementary Table S6) and 1332 (Supplementary Table S7) proteins showed significantly changed expression compared to controls, respectively.
Fig. 5
Comparative analyses of the DEPs of LPS and CFZ at each timepoint. a Venn diagram of proteins differentially expressed in LPS and CFZ data. b Total number of DEPs in LPS and CFZ data. c Volcano plots show the DEPs of up-regulated, down-regulated, and spatial occurrence
To extract molecular mechanisms of proteome from the 1332 DEPs of CFZ, gene ontology (GO) and KEGG enrichment analysis (Fig. 6) were used. The top enriched categories of the biological process (BP) were related to generation of precursor metabolites and energy, aerobic respiration, cellular respiration, energy derivation by oxidation of organic compounds, ATP metabolic process, oxidative phosphorylation, carboxylic acid catabolic process, organic acid catabolic process, nucleotide metabolic process, and purine-containing compound metabolic process. The cellular component (CC) terms of the DEPs were mitochondrial matrix, mitochondrial protein-containing complex, mitochondrial inner membrane, organelle inner membrane, oxidoreductase complex, myelin sheath, organellar ribosome, mitochondrial ribosome, inner mitochondrial membrane protein complex, and respiratory chain complex. The molecular function (MF) terms of the DEPs were NAD binding, structural constituent of ribosome, electron transfer activity, isomerase activity, ribonucleoprotein complex binding, iron-sulfur cluster binding, metal cluster binding, ATP hydrolysis activity, primary active transmembrane transporter activity, and ligase activity. The enrichment of the KEGG pathway included carbon metabolism, oxidative phosphorylation, fatty acid metabolism, HIF-1 signaling pathway, and lysosome.
Fig. 6
KEGG and Gene Ontology biological process analysis of the differentially expressed proteins of CFZ. a Top 50 KEGG pathways with the lowest adjusted p values. b Top ten significantly enriched terms in biological processes (BPs), cellular components (CCs), and molecular functions (MFs)
CFZ inhibits TLR4/NF-kB/HIF-1α pathway and IL-1β and TNF-α releaseNF-κB pathway has been defined as a key participant in LPS infections [18, 19]. Meanwhile, hypoxia-inducible factor-1α (HIF-1α) is considered one of endogenous ROS's core cellular targets, which further regulates the hypoxia signaling in the inflammatory response [20]. To further correlate CFZ with inflammation on the levels of transduction pathways, key proteins involved in the pathways implicated in TLR4/NF-κB/HIF-1α signaling pathway were listed (Fig. 7a). Among these protein expressions, there were better correlation in TLR4/NF-κB/HIF-1α transduction pathway (Fig. 7b).
Fig.7
TLR4/NF-κB/HIF-1α transduction pathway revealed in CFZ data. a Schematic diagram of CFZ proteomics participating in the anti-inflammatory in LPS-induced lung injury. b Correlation on key proteins involved in the signaling pathway
Next, TNF-α and IL-1β expression was measured in the culture supernatants of Raw264.7 cells. It can be seen from the results that compared to the control group, the levels of TNF-α and IL-1β were significantly increased with LPS exposure alone. However, when treated with CFZ, the levels of TNF-α and IL-1β in LPS + CFZ group were markedly reduced compared with the LPS group (Fig. 8a).
Fig. 8
CFZ decreased the pro-inflammatory cytokines and ameliorated ALI following LPS. a The TNF-α and IL-1β level was detected by ELISA kits. All values were expressed as mean ± SEM of at least three separate experiments. b Histopathological changes of lung tissue (200 x) and lung injury score (n = 5 mice/group). c Pulmonary edema was examined by W/D ratio (n = 5 mice/group). d Survival rate of mice (n = 10 mice/group). e Body weight loss (n = 10 mice/group). Data are mean ± SEM. Variation among treatments was determined by one-way ANOVA. *p < 0.05; **p < 0.01; ***p < 0.001; ****p < 0.0001
In vivo studyEffect of CFZ on LPS-induced lung parenchymaAs CFZ treatment significantly improved the pro-inflammatory cytokines, we examined whether this treatment reduced lung injury in mice. Intact structure and clear pulmonary alveoli in both control group and CFZ group of mice were observed. Following LPS-induced injury, the histological examination showed an increase in the areas of inflammatory infiltration, collapse of air alveoli, and pulmonary congestion. However, CFZ markedly attenuated the LPS-induced pathological changes (p < 0.05) (Fig. 8b).
Effect of CFZ on the W/D ratioLung edema was a predictive marker of the exudative phase of ALI/ARDS [21, 22]. We evaluated it by W/D lung weight ratio. After 8 h of LPS administration, a marked increase was observed in the average wet/dry ratio of lung tissue compared with the control group; however, the LPS + CFZ group, in particular, exhibited a significantly lower level of W/D ratio than the LPS group (p < 0.05) (Fig. 8c).
Effect of CFZ on survival rate and body weight loss of mice challenged with a lethal dose of LPSThe therapeutic effect of CFZ was evaluated on mice challenged with the lethal dose of the LPS (Fig. 8d, e). The survival rate of the mice in LPS group was markedly lower than that in the control group, while the survival rate in the LPS + CFZ group was distinctly higher than that in the LPS group during 72 h observation (p < 0.05). These results showed that CFZ could improve the survival rate of LPS-challenged mice (Fig. 8d). The effects of CFZ were further validated on LPS-induced ALI in mice. Our results suggested that on day 3, mice in the normal group increased a considerable weight, compared to day 0. Mice began to lose weight on day 1 and all weight loss on day 3 following LPS injury. Treatment of CFZ effectively improved the loss and presented a slight weight increase on day 3, compared to LPS group (p < 0.05).
Effect of CFZ on LPS-induced COX-2 and AIM 2 expressionThe activation of COX-2 and AIM 2 were detected by western blot analysis to investigate the mechanism underlying the anti-inflammatory effect of CFZ. As expected, LPS application dramatically increased COX-2 and AIM 2 expression compared with the control group. However, compared with the LPS group, CFZ markedly decreased the protein expression (Fig. 9a).
Fig. 9
Effect of CFZ on TLR4/NF-κB/HIF-1α pathway in LPS-stimulated ALI. a Western blot corresponding to COX-2 and AIM 2 in lung lysates from mice treated with LPS then CFZ 8 h. b Western blot corresponding to TLR4, NF-κBp65, and p-NF-κBp65 in lung lysates from mice treated with LPS then CFZ 8 h. c Western blot corresponding to HIF-1α in lung lysates from mice treated with LPS then CFZ 8 h. GAPDH was used for loading control. Data are mean ± SEM., n = 5 mice/group. Variation among treatments was determined by one-way ANOVA. *p < 0.05; **p < 0.01; ***p < 0.001
Effect of CFZ on LPS-induced TLR4/NF-κB/HIF-1α expressionThe protein expression levels of CFZ on TLR4/NF-κB/HIF-1α pathway were assessed for further investigating the anti-inflammatory mechanisms of CFZ. As a result (Fig. 9b), the protein levels of three essential proteins, including TLR4, NF-κBp65 and HIF-1α were significantly enhanced in LPS group. Conversely, CFZ decreased the expression of these three essential proteins in LPS + CFZ group (p < 0.05).
留言 (0)