Supervised patient care in teaching facilities is a critical component of graduate medical education (GME) where physician residents gain skills to become independent practitioners. However, GME is centered in hospitals despite a US health system that provides most of its care in outpatient settings.1 Some argue a GME outpatient gap exists because residents are financed through hospitals,2 and Medicare reimburses hospitals an additional $10b-$12b to cover their beneficiaries’ share of the hospital’s GME costs.3,4 In contrast, academic leaders generally accept outpatient care as important to the GME curriculum,5 offering residents more patients and a greater variety of cases,6 giving patients a higher quality of care,7,8 while permitting program directors to expand their capacity at a time when projected physician shortages for the U.S. are estimated to reach 139,000 by 2033.9
One significant barrier to GME expansion into outpatient care is costs for resident salaries and fringe benefits, plus staff time for education supervision activities.10–14 GME cost analyses often reveal staff productivity will decline when attending staff supervises residents in both ambulatory15–17 and hospital settings in medicine,18 family medicine,19 gastroenterology,20 radiology,21 and surgery.22,23
Offsetting these costs is the value of workload residents contribute to clinical workload. How much residents contribute is unsettled. An early study of outpatient care by Stern et al10 found resident productivity was too low to cover their direct costs, whereas a review of the literature found residents had little impact on billed charges, a slight decrease in the number of patients seen, and an increase in the amount of time the attending spent in clinic.24
Most of the optimism that resident productivity may recover GME direct costs comes from inpatient GME25,26 where the presence of residents were seen to change hospital costs only slightly,27 or reduced operating costs all together.28–31 These studies are often based on accounting data, from single facilities, limited time periods, and single specialty.4
In this paper, we measure residents’ contribution to patient care in hospital-based outpatient clinics and whether such workload is sufficient to cover their salary, fringe benefits, and clinical supervision costs. Rather than tracing cost accounts, we compare residents and staff inputs into the production of patient care in outpatient clinics at 125 VA medical centers offering GME for 9 specialty groups spanning 14 academic years. We estimate residents’ (1) participation in patient care, (2) productivity to produce workload net of supervision, (3) efficiency for their workload to cover their direct costs, and (4) progress to advance their skills towards independent practice.
METHODS
Setting
The study setting is the medical centers of the Department of Veterans Affairs. Accepting trainees since 1946, VA has become the largest “program of education and training of health personnel” in the United States.32 Administered by the Office of Academic Affiliations, VA offers affiliation agreements to sponsoring education institutions including 148 of 155 US LCME and 38 of 39 AOA-accredited medical schools. 33 These agreements cover the cost of salaries and fringe benefits for 11,600 residency positions filled by 47,500 rotating residents engaged annually in supervised clinical care at 125 VA medical centers at an estimated cost of $1.8 billion.3,33 VA’s statutory purpose is to enhance veterans’ access to VA care where residents are seen as both an immediate source of labor and a future pool to recruit new health professionals.34 Between 2005 and 2018, VA hosted 538,922 (33.3%) residents and fellows of the total 1,617,593 annual enrollment in US ACGME accredited programs.33,35 VA residents and fellows work together with 322,000 full-time professional and support staff as they care for 9 million veterans.36
Data
Outpatient encounter data were extracted from VA’s Corporate Data Warehouse from July 1, 2004 to June 30, 2018. More recent years were excluded to avoid confounds with the COVID-19 pandemic. Patient records identified primary and secondary providers by service date and clinic location. Common Procedure Terminology37 listed each procedure with their respective relative value unit (RVU) by year from the National Physician Fee Schedule Relative Value File. Provider specialty was classified by National Uniform Claim Committee (NUCC) Health Care Provider Taxonomy Code Set.38 Resident status for physician providers was indicated by searching text-based provider type, classification, and area of specialization fields for words such as “resident,” “fellow,” “student,” “trainee,” and “PGY”, or the person-class field classified the provider by a National Uniform Claim Committee (NUCC) education code.
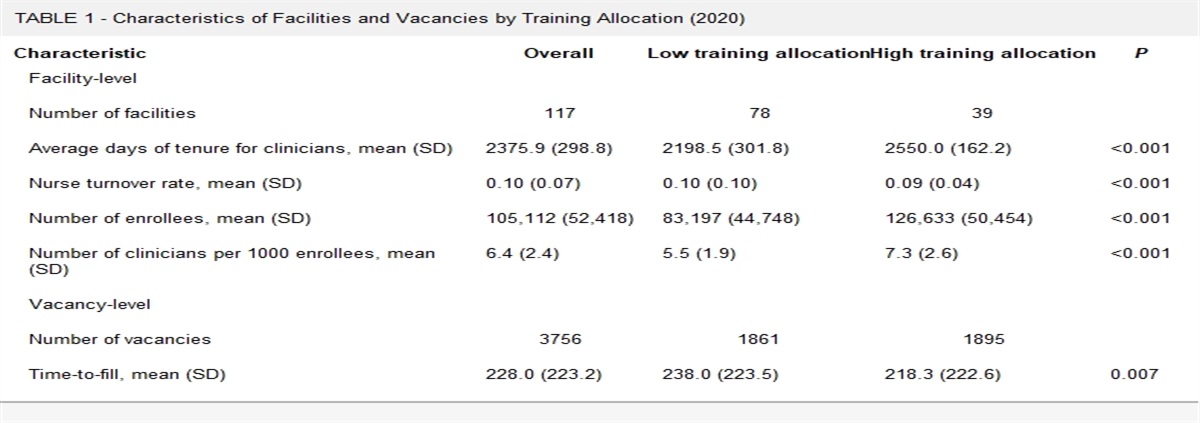
Production units are clinics classified into 1 of 9 specialty groups (defined in Table 1): Primary Care, Surgery, Psychiatry, Neurology, Rehabilitation Medicine, Diagnostic Medicine, Emergency Medicine, Subspecialties of Medicine, and Specialty Care. Clinic-weeks are production units where residents, their supervisors, and other care providers classified by specialty are assigned to provide care for scheduled and walk-in patients during a given week. A patient encounter occurs when a patient has 1 or more visits to a clinic-week. A patient with multiple visits in the same clinic-week is counted as 1 encounter. The number of residents and providers engaged in patient care for a given clinic-week was quantified by provider-days computed as the sum of all days (or half days if a morning or afternoon shift) that providers spent in clinic that week. Estimates were based on encounter service date and time stamp recorded in the patient record.
TABLE 1 -
Number of VA Clinic Facilities,
1 Clinic-Weeks,
2 Encounters, and RVU Workload, By Operating Status and Clinic Specialty
8
Operating Status
P.C.
Surg.
Psych.
Neur.
Rehab.
Diag.
E.M.
S.C.
MSubS.
Clinic Facilities
130
128
130
126
130
130
123
130
130
with Residents3
120
107
113
93
109
124
107
117
106
92.3%
83.6%
86.9%
73.8%
83.8%
95.4%
87.0%
90.0%
81.5%
who are Productive4
103
101
95
83
86
118
91
106
94
85.8%
94.4%
84.1%
89.2%
78.9%
95.2%
85.0%
90.6%
88.7%
who are Efficient5
86
87
83
61
69
107
31
95
86
71.7%
81.3%
73.5%
65.6%
63.3%
86.3%
29.0%
81.2%
81.1%
Clinic-Weeks (in 10,000s)
9.39
8.96
9.37
8.26
9.34
9.40
8.49
9.37
9.22
with Residents3
6.11
5.76
5.28
4.23
3.78
7.01
5.11
6.52
5.55
65.1%
64.3%
56.3%
51.2%
40.5%
74.6%
60.2%
69.6%
60.2%
who are Productive4
4.90
4.70
4.48
3.89
3.03
5.96
3.87
5.65
4.63
80.2%
81.6%
84.9%
92.1%
80.0%
85.0%
75.7%
86.6%
83.4%
who are Efficient5
3.88
3.69
3.51
2.58
2.43
5.14
1.40
4.98
3.70
63.5%
64.0%
66.5%
60.9%
64.2%
73.3%
27.4%
76.3%
66.7%
Encounters (in 1,000,000s)
119.88
27.06
41.92
6.17
29.55
14.36
22.34
83.16
32.09
with Residents3
5.06
6.07
3.38
1.05
1.10
19.02
2.73
17.83
4.62
4.2%
22.4%
8.1%
17.0%
3.7%
13.2%
12.2%
21.4%
14.4%
RVUs (in 1,000,000s)
272.20
184.58
121.87
16.91
56.28
394.95
59.68
263.62
179.73
Residents engaged6
13.62
62.32
10.99
3.30
4.00
56.51
7.15
64.76
26.19
5.0%
33.8%
9.0%
19.5%
7.1%
14.3%
12.0%
24.6%
14.6%
Residents contributed7
25.10
20.42
13.50
2.60
2.75
95.47
2.79
48.46
21.56
9.2%
11.1%
11.1%
15.4%
4.9%
24.2%
4.7%
18.4%
12.0%
1Clinic facilities are counted if they provide at least 1 patient encounter during the 14-year study period.
2Clinic-weeks include all unique patients treated and all procedures produced at a given outpatient clinic in a given facility during a given calendar week. There are a possible 94,640 clinic-weeks: 130 facilities × 14 years/facility × 52 weeks/year.
3With Residents means a resident was assigned to a patient’s care as indicated by having been named as 1 of the care providers in the electronic health record.
4Productive means the resident contributed a positive amount to clinical workload net of supervision as measured in RVUs.
5Efficient means the resident's productive contribution net of supervision was sufficient to cover the resident's salary and fringe benefits.
6Residents engaged includes RVUs of procedures listed in patient encounters where a resident was named as one of the care providers in the electronic health record.
7Residents contributed is RVUs a resident is estimated to have contributed to workload net of supervision based on econometric methods explained in the text.
8Clinics are classified into 1 of 9 specialty groups defined as follows: While listing over 700 classifications, clinics were only included if physicians were engaged. Although not named here, listed clinics were often subdivided into Individual and Group sessions, Telehealth and In -Person, Hospital-based, Home-care, and Hospital-based-Home-Care, and by Patient Groups (Women, Homeless Veterans, Selected Disorders). Primary Care (PC) includes among others: General Medicine, General Internal Medicine, Family Practice, Post-Deployment Integrated Care, Health and Well Being Services, Hospital Based Home Care, Observation Medicine, Chronic Infectious Disease Primary Care, Women’s Primary Care Clinic, Primary Care Medicine, and Geriatric Primary Care, and Immunization. Surgery (Surg.) includes among others: General Surgery, Cardiac Surgery, Hand Surgery, Neurosurgery, Orthopedics, Plastic Surgery, Thoracic Surgery, Cardiothoracic Surgery, Bariatric Surgery, Surgical oncology, Vascular Surgery, Ambulatory Surgery, Observation Surgery, Obstetrics, Otolaryngology Surgery, Anesthesia pre-op consult, Pre-Surgery Evaluation – MD, Post-Surg Routine Aftercare, Spinal Surgery, and Ambulatory Surgery Services. Behavioral Health (Psych.) includes among others: Mental Health, Mental Hygiene, Drug and Alcohol Dependence, Neurobehavioral, Smoking Cessation, Observation Psychiatry, Mental Illness Outreach Psychiatry – MD, Post Traumatic Stress Disorder, Methadone Maintenance, Opioid Substitution, Opioid Safety Education, Sexual Trauma, Mental Health Primary Care, Psychosocial Rehabilitation, Gambling Addictions, and Mental Health Compensated Work and Supported Employment. Neurology (Neur.) includes Neurology and Observation Neurology. Rehabilitation Medicine (Rehab.) includes among others: Rehabilitation Medicine, Polytrauma, Polytrauma Transitional Rehabilitation Program, Physical Medicine and Rehabilitation services, and if a physician were present Recreation, Physical, and Occupational Therapy, Audiology, Spinal Cord Injury, Amputation Follow-up, Kinesiotherapy, Blind Rehabilitation, Traumatic Brain Injury, Outpatient Visual Impairment, Cardio-pulmonary rehabilitation, Wheelchair and Advanced Mobility, Observational Medicine Rehabilitation, Cardiac Rehabilitation, and Residential Rehabilitation Treatment Programs. Diagnostic Medicine (Diag.) includes among others: x-ray, E.E.G., E.K.G., Laboratory, Nuclear Medicine, Ultrasound, Echocardiogram, Sing Photon Emiss Tomography, Health Screening, Evoked Potential, Topographical Brain Mapping, Hypertension screening, Mammogram, Cervical Cancer Screening, PAP Test, Myocardial Perfusion studies, Positron Emission Tomography, Computerized Tomography Scans, Magnetic Resonance Imaging, Angiogram Catheterization, Magnetoencephalography, Computer Aided Design / Modeling Unit, Comprehensive Fundoscopy Exam, Diabetic Retinal Screening, Pathology, and Interventional Radiology. Emergency Medicine (E.M.) includes among others: Emergency Unit, Urgent Care, Emergency Department, Observation Emergency Room, and Crisis Emergency. Specialty Care (S.C.) includes among others: Oncology, Gynecology, Obstetrics/Gynecology, Ophthalmology, Proctology, Urology, Visually Impaired, Prosthetics/Orthotics, Chemo Clinic, Nutrition/Dietetics, Dermatology, Parkinson’s Disease, Genomic Care, Pediatrics, Multiple Sclerosis, Hospital at Home, War Related Illness and Injury Study Center, Electrophysiology Laboratory, Otolaryngology Clinic (non-surgery), Hemodialysis, Peritoneal Dial Treatment. Subspecialties of Medicine (MSubS.) includes among others: Cardiology, Gastroenterology, Hematology, Hypertension, Diabetes, Infectious Diseases, Nephrology, Rheumatology, Pulmonology, Cardiovascular Nuclear Medicine, Endocrinology/Metabolic, Liver, Hepatology Clinic, Renal/Nephrology, Chemotherapy Procedures Unit Medicine, Cardiac Catheterization, Cardiac Stress Test, Geriatric Clinic, Alzheimer and Dementia Clinic, Sleep Medicine, and Palliative Care.
RVU indicates relative value unit.
Workload is quantified by patients, encounters, procedures, or RVUs. Resident encounters are all clinic visits for which a resident is listed in the medical chart as 1 of the care providers. Resident engaged workload is the total RVUs corresponding to all procedures listed in resident encounters. Resident contributed workload is the increase (decrease) in the clinic’s total workload that would not have occurred but for the presence of the residents. Contributed workload is computed econometrically from patterns in how workload changed as the number of assigned residents changed over time.
VA residents’ salary and fringe benefits were computed as weighted averages by provider specialty from OAA’s financial records for academic year 2019–2020. First, we computed 296 salary plus fringe benefit rates for 8 PGY levels from among the 128 VA medical centers, 276 disbursement agents, and 318 academic affiliates. Fringe benefits included federal and local taxes, health, disability, and life insurance plans, retirement benefits, workers compensation, unemployment compensation, 21-day paid leave, and parking, lab coats, and other personal expenses. Next, we determined an average rate across the 8 PGY levels by specialty, aggregated specialty into 1 of the 9 outpatient specialty groups, and weighted by the 11,578.3 positions assigned to each 3584 facility-affiliate-specialty triplets across the 368 facility-affiliate pairs.
VA physician salaries were based on official pay tables effective February 16, 2020 that reflect a base, market, and performance pay for VA staff physicians grouped by specialty.39 Fringe benefits were computed at 30% of salaries.
Medical centers were also classified by VA on a 5-point complexity scale based on the mix of complex clinical programs, research dollars, number of residents, patient risk score, intensive care unit, and operative complexity level.40
Analytics
Estimates of resident contributions to workload were based on linear production models computed for each specialty S, facility clinic f, and academic year T:
(1)WSfTt=αSfT+βSfT[RSfTt]+δSfT[PSfTt]+γSfT′[XSfTt]+vSfTt,
where WSfTt is RVU workload produced, RSfTt is total days worked by physician residents, PSfTt is total days worked by staff physicians, and XSfTt is a (k×1) vector representing the number of days worked by nurses, nurse practitioners, pharmacists, physician assistants, and psychologists, respectively, in specialty group S, at facility f, during academic year T for week t=1, 2, …, 52. αSfT are parameter constants. βSft, δSfT, and (k×1) vector γSfT are coefficients representing mean per diem productivity rates, respectively, for residents, physician staff, and k-other provider types by service, facility, and academic year. vSfTt is a zero-mean normally distributed random variate. Clustering productivity by specialty and academic year corresponds to VA’s signed annual affiliation agreements with its academic partners that permit residents to rotate through VA.
To account for changes in productivity as residents progress their clinical skills over the academic year, we set βSfT=βSfT0+βSfT1[t⁎] where t⁎=t−26.551 ranges from −0.5to+0.5.βSfT0 is residents’ mid-year productivity, and βSfT1 is mean annual change in resident productivity. Accounting for reduced productivity whenever staff physicians supervise residents, we set: δSfT=δSfT0−δSfT1[RSfTt][PSfTt] where δSfT0 is physician per diem productivity when no residents are present, and δSfT1[RSfTt][PSfTt] is the reduction in physician productivity from supervisory education activities that increases with more supervised residents and decreases with more supervising physicians. Thus:
(2)WSfTt=αSfT+(βSfT0−δSfT1)[RSfTt]+δSfT0[PSfTt]+γSfT′[XSfTt]+βSfT1[t⁎][RSfTt]+vSfTt,
where (βSfT0−δSfT1) is resident productivity net of supervision at mid-academic year.
Resident contributions are computed by:
(3a)ℂSfTt=E[WˆSfTt|RSfTt=rSfTt]−E[WˆSfTt|RSfTt=0],
where E[WˆSfTt|RSfTt=rSfTt] is predicted workload (Eq. 2) when resident days are set at the actual number of days worked, and E[WˆSfTt|RSfTt=0] is predicted workload when resident days are set at zero (no trainees). Residents are productive whenever ℂ≥0.
Resident productivity is workload a resident working an additional day would contribute net of supervision as a percent of the workload of an additional staff physician day would bring to specialty S, facility f, during academic year T:
(3b)ℛSfT=∑t=1t=52(E[WˆSfTt|RSfTt=rSfTt+1]−E[WˆSfTt|RSfTt=rSfTt])∑t=1t=52(E[WˆSfTt|PSfTt=pSfTt+1]−E[WˆSfTt|PSfTt=pSfTt]).
Efficiency is the net workload an additional dollar spent on residents would generate relative to the workload that spending an additional dollar on physician staff would generate. Efficiency is computed by multiplying resident productivity ℛSfT, by the staff-to-resident-salary ratio (CSpCSr), and indirect cost multiplier (mpmr):
(3c)εSfT=ℛSfT(CSpCSr)(mpmr)
where CSr and CSp are per diem salary and fringe benefits in dollars and mr and mp are indirect cost multipliers for residents and physician staff, respectively, in specialty group S. ε≥1 means residents’ contributions covered their costs and are “efficient”. If staff indirect costs are no smaller than resident’s (mr≤mp), then: εSfT=ℛSfT(CSpmpCSrmr)≥ℛSfT(CSpCSr)=εSfT⁎
Progressive independence is calculated as the change in productivity between the first and last week of a given academic year:
(3d)℘SfT=(E[WˆSfTt|RSfTt=rSfTt+1;t=52]−E[WˆSfTt|RSfTt=rSfTt;t=52]E[WˆSfTt|PSfTt=pSfTt+1;t=52]−E[WˆSfTt|PSfTt=pSfTt;t=52])−(E[WˆSfTt|RSfTt=rSfTt+1;t=1]−E[WˆSfTt|RSfTt=rSfTt;t=1]E[WˆSfTt|PSfTt=pSfTt+1;t=1]−E[WˆSfTt|PSfTt=pfSTt;t=1])
where rSfTt and pSfTt are resident and VA physician staff days by specialty, facility, year, and week. ℘SfT≥0 means residents progressed during the academic year.
RESULTS
Overview
Across all 9 outpatient specialty groups, residents were engaged with 0.25b RVUs (16.1%) and contributed 0.23b RVUs (15.0%) of the total 1.55b RVUs produced between 2005 and 2018. Specifi

留言 (0)