
記住我
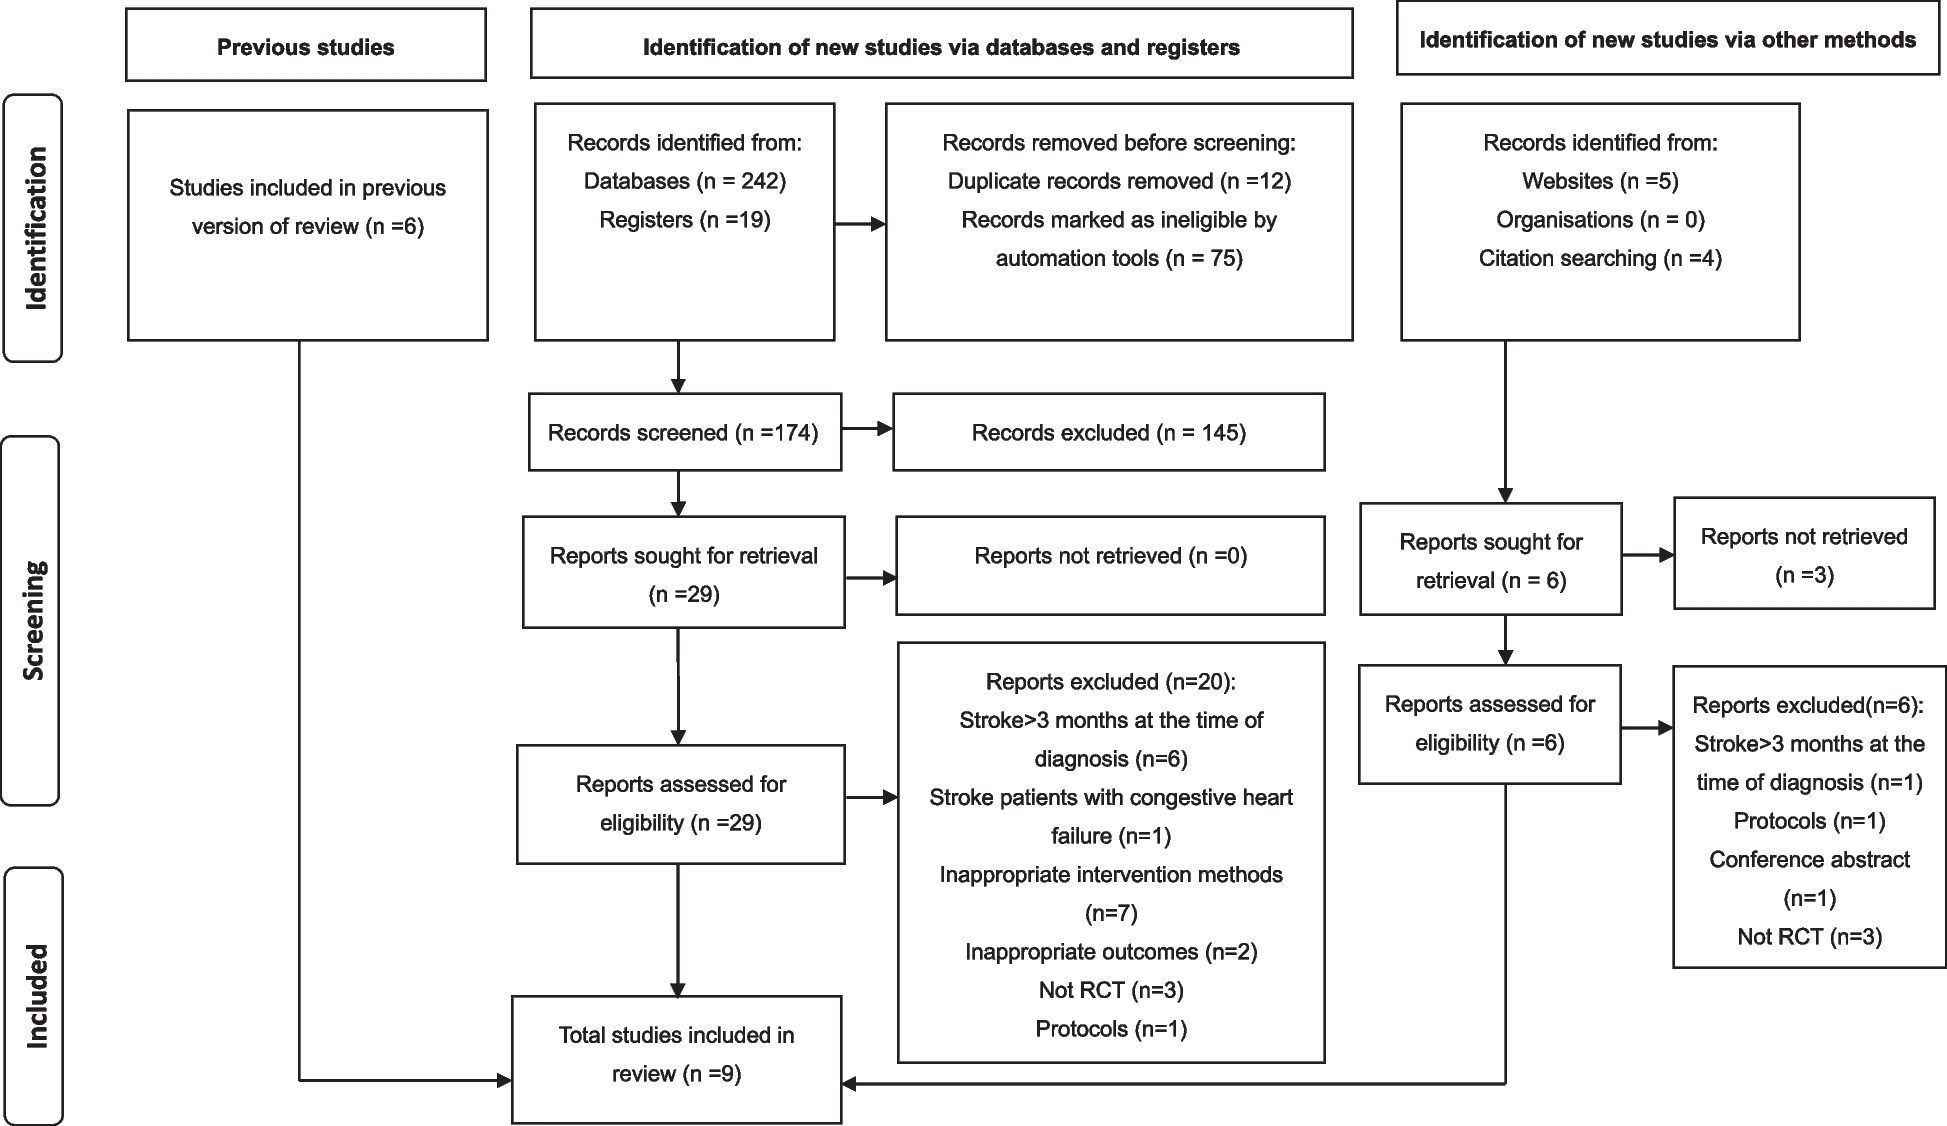
The initial search yielded 2.759 articles, of which 1.534 entered preliminary screening after removal of duplicates. The screening of abstracts produced 62 full-text articles to be read in entirety for eligibility in phase 2. Forty-six studies were excluded and 16 studies were included. One of these studies [28] was excluded from quantitative analysis on the basis of using interquartile range (IQR) as a distribution parameter, which did not comply with the remaining 15 studies that were used in the meta-analyses. A PRISMA flow diagram of the literature search and study selection is shown in Fig. 1.
Fig. 1
PRISMA flow diagram of literature search and study selection. Legend: RCT = randomized controlled trial; PT = power training; ST = strength training
A total of 16 studies were included in the review. The total study population for the main comparison of power training versus strength training consisted of 583 participants, of which 277 participants received power training (47.5%). The study population for the secondary analysis of power training versus a non-training control group was 272, of which 134 participants received power training (49.3%).
Outcome assessmentThe selected studies used a variety of tests to measure muscle power and performance on activity tests. In the included studies, the construct of muscle power was captured with the chest press for upper extremity muscle power, and the leg press for lower extremity muscle power. Our analyses used the power and acceleration outcomes reported in the original studies. Tests with an emphasis on movement speed were tests in which the instruction was to perform the test “as quickly as possible”. The activity tests categorised as having an emphasis on movement speed were countermovement jump, chair rise (seconds), short physical performance battery, walking speed, timed up and go, timed stair climb, and timed floor rise to stand. Generic tests were tests for which there was no instruction regarding the rate of force development. The activity tests categorised as generic were the 6-minute walk test, 400-m walk test, chair rise, sit to stand transfer (Watt and repetitions), and a summary measure for balance. None of the included studies used the level of physical activity in daily life as an outcome.
The characteristics of the included studies included are shown in Table 1.
Table 1 Characteristics of the studies included in the meta-analyses evaluating muscle power, activity-based tests, and physical activity level in daily life in older adultsTable 2 GRADE quality of evidence table for estimates using muscle power, activity-based tests, and physical activity level in daily life in older adultsRisk of biasAn overview of the risk of bias assessment for the included studies is provided in Fig. 2. In conclusion, 47% of the studies were considered to be low risk of bias [3, 29, 30, 34,35,36, 38] while the remaining studies were scored as being unclear to high [4, 5, 7, 19, 31,32,33, 37].
Fig. 2
Risk of bias for the studies included in the meta-analysis
Muscle powerThe statistical analyses for muscle power as outcome was performed separately for the upper extremity (UE) and lower extremity (LE) (Fig. 3). For UE muscle power, a meta-analysis of 6 RCTs showed a significant benefit of power training compared to strength training (SMD: 0.99, 95% CI: 0.34 to1.65, p = 0.003). A significant chi-square test for heterogeneity (p = 0.001) indicates a concern for statistical heterogeneity, which was corroborated by an I2 statistic of 75% indicating substantial to considerable heterogeneity [25]. For LE muscle power, a meta-analysis of 10 RCTs showed a significant benefit of power training compared to strength training (SMD: 1.00, 95% CI: 0.40 to 1.60; p = 0.001). A significant chi-square test for heterogeneity (p < 0.001) indicates a concern for statistical heterogeneity, which was corroborated by an I2 statistic of 86% indicating considerable heterogeneity [25]. The overall combined effect for UE and LE muscle power clearly favors power training (SMD: 0.99, 95% CI: 0.54 to 1.44, p < 0.001) over strength training.
Fig. 3
Forest plot comparing power training to strength training using muscle power. Legend: Forest plot showing standardized mean difference between power training and strength training in older adults according to chest press and leg press. PT = power training; ST = strength training; SD = standard deviation; IV = intravitreal; CI = confidence interval
The secondary meta-analysis showed that power training was also significantly improved UE muscle power (SMD: 0.81, 95% CI: 0.35 to 1.27, p < 0.001) and LE muscle power (SMD: 1.38, 95% CI: 0.90 to 1.86, p < 0.001) compared to to not training (Additional file 2). Statistical heterogenity for the secondary analyses is likely ‘unimportant’ to ‘moderate’ [25]. The overall combined effect for UE and LE muscle power also favors power training (SMD: 1.12, 95% CI: 0.75 to 1.48, p < 0.001) over not training.
Generic activity testsFive different tests were used in this category. A subgroup analysis was performed for each test (Fig. 4). In the subgroup analyses, chair raise (p = 0.02), sit to stand transfer (p = 0.04), balance (p < 0.001), walking speed 400 m (p = 0.66), and 6-minute walk test (p = 0.66) all favored power training. The overall effect of functional performance was calculated by pooling the effects of all subgroup analyses, which showed a significant benefit of power training over strength training (SMD: 0.43, 95% CI 0.23 to 0.62, p < 0.001). Statistical heterogeneity was of no concern for the subgroup or overall analyses [25].
Fig. 4
Forest plot comparing power training to strength training using generic tests. Legend: Forest plot showing standardized mean difference between power training and strength training in older adults according to 400 m walk test, 6 minute walk test, chair rise (reps), sit to stand transfer, and balance. The sit to stand transfer and the chair rise in Cadore et al. is, in fact, the same performance test but interpreted in two different manners. Sit to stand is considered to be a performance while chair rise is considered to be a physical function. PT = power training; ST = strength training; SD = standard deviation; IV = intravitreal; CI = confidence interval
The secondary analysis showed that power training group also significantly improved the performance on the generic tests (SMD: 0.73, 95% CI 0.48 to 0.99; p < 0.001) compared to not training (Additional file 3). Within the subgroup analyses, chair raise (p < 0.001), sit to stand transfer (p = 0.02), balance (p = 0.003), and walking speed 400 m (p = 0.14) all favored power training. Statistical heterogeneity was of no concern in the overall analyses, however, the chi-square test for heterogeneity in walking speed 400 m (p = 0.01) and an I2 statistic of 84% indicated there may be substantial to considerate heterogeneity [25].
Activity tests with an emphasis on movement speedSeven different tests were used in this category, and a subgroup analysis was performed for each test (Fig. 5). Within the subgroup analyses, stair climb (p = 0.04), chair rise (p = 0.19), walking speed (p = 0.22), Short Physical Performance Battery (SPPB) (p = 0.75), and timed up and go (p = 0.19) favored power training, while the countermovement jump (CMJ) (p = 0.86) and floor rise to stand (p = 0.43) favored strength training. Statistical heterogeneity may be a cause for concern in chair rise, walking speed, SPPB, stair climb, and floor to rise stand, for which a significant p-value and an I2 statistic above 70% indicated substantial to considerable heterogeneity [25]. The overall effect was calculated by pooling the effects of each subgroup analysis, which showed a significant benefit of power training compared to strength training (SMD: 0.36, 95% CI 0.06 to 0.68, p = 0.02). Statistical heterogeneity may be cause for concern as well, as a significant chi-square test for heterogeneity (p < 0.001) and an I2 statistic of 78% indicate substantial to considerable heterogeneity [25].
Fig. 5
Forest plot comparing power training to strength training using tests with emphasis on movement speed. Legend: Forest plot showing standardized mean difference between power training and strength training in older adults according to the countermovement jump, chair rise, walking speed, short physical capacity battery, timed up and go, stair climb, and floor rise to stand. PT = power training; ST = strength training; SD = standard deviation; IV = intravitreal; CI = confidence interval
The secondary analysis showed that power training also significantly improved performance on the speed tests (SMD: 0.74, 95% CI 0.50 to 0.98, p < 0.001) compared to not training (Additional file 4). A significant chi-square test for heterogeneity (p = 0.002) indicated a concern for statistical heterogeneity, which was corroborated by an I2 statistic of 46% indicating moderate heterogeneity [25]. Within the subgroup analyses, CMJ (p = 0.06), chair rise (p < 0.001), walking speed (p = 0.004), time up and go (p = 0.05), and stair climb (p = 0.03), SPPB (p = 0.32), and floor rise to stand (p = 0.07) all favored power training. The chi-square test for heterogeneity indicated a cause for concern in walking speed, for which the I2 statistic was 71% [25].
Quality of evidenceThe quality of evidence for each outcome is shown in the GRADE quality of evidence table (Table 2). The effect estimates for LE muscle power, generic and speed-based activity tests, were scored as having a ‘high’ amount of certainty, while UE muscle power was scored as having a ‘moderate amount’ of certainty. Within the certainty assessment, risk of bias was graded as ‘serious’ for each outcome, largely due to the lack of allocation concealment the selected studies. Indirectness was graded as ‘very serious’ for LE muscle power as a result of the inconsistent point estimates and high levels of statistical heterogeneity in the meta-analysis. For the activity tests with an emphasis on speed, criteria for indirectness (differences in outcome measures) and imprecision (risks of random errors) within the GRADE were scored as ‘not serious’.
Publication bias was also assessed separately for each outcome through the use of funnel plots (Additional file 5, Additional file 6 and Additional file 7). The funnel plot for muscle power is a-symmetrical, indicating that publication bias may be present. The funnel plots for the activity tests do not show asymmetry, indicating that publication bias is less of a concern. The PEDro score of each of the selected studies is illustrated in Additional file 8. Five studies were considered to have ‘good’ internal validity [3, 30, 33, 35, 38], 8 studies were classified as ‘poor’ to ‘fair’ [4, 5, 9, 29, 31, 32, 37, 39], and 1 study was classified as having ‘poor’ interal validity [7].
留言 (0)