
記住我


This retrospective study complied with the guidelines issued by the Institute Research Medical Ethics Committee at our institution and was conducted in accordance with the declaration of Helsinki. Written informed consent was waived.
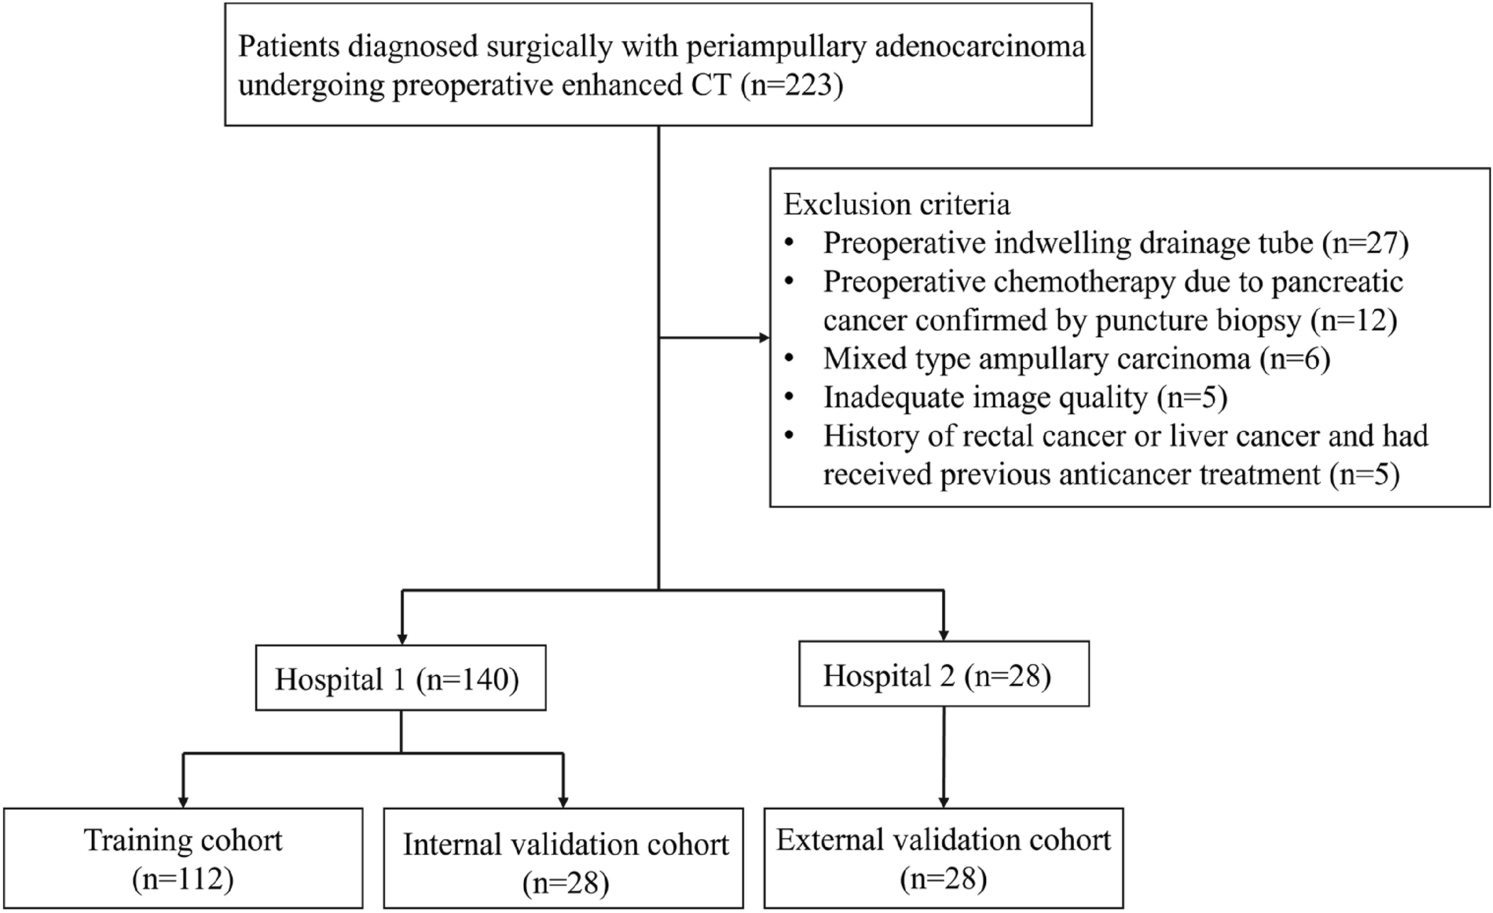
This single-center study included a series of 167 men who underwent both mpMRI and FBP in our institution between January 2016 and March 2021. Patients were enrolled retrospectively through the picture archiving and communication system and the archive of histopathological reports of our hospital. A flowchart of patients selection is shown in Fig. 1.
Fig. 1
Flowchart of the study. FPB, fusion prostate biopsy; mpMRI, multiparametric prostate MRI
The patient inclusion criteria were as follows:
(1)Having performed a 1.5T or 3.0T prostate mpMRI at our department;
(2)Presence of at least one prostatic lesion with a PI-RADS assessment category of 3 or more made by the reporting radiologist;
(3)Having undergone a FPB at our institution no more than 180 days after the mpMRI;
The exclusion criteria were as follows:
(1)Previous invasive treatment or pharmacological therapies for PCa;
(2)Incomplete mpMRI exam due to artifacts on MRI images or premature ending of the study.
For each patient, personal data such as date of birth, mpMRI exam date, and FPB date were recorded.
Enrolled patients were assigned an identification number (ID), which was later used to identify the study members allowing anonymity and protection of sensitive data.
All MRI identified lesions were divided into benign formations, non-clinically significant prostate cancers (nsPC, GS 6 3 + 3) and clinically significant prostate cancers (sPC, GS ≥ 7 3 + 4) according to FPB results.
Multiparametric MRImpMRI examinations were performed on a 1.5T or 3.0T scanner (Ingenia 1.5T or 3.0T, Philips Healthcare, Netherlands). mpMRI protocol included T2-weighted images in 3 planes, DWI with subsequent ADC maps and dynamic contrast-enhanced imaging. An external pelvic coil was used in all cases. We administered an antiperistaltic agent (hyoscine N-butylbromide 20 mg/mL, 1 ml) intravenously to all patients who had no contraindications in order to reduce motion artifacts.
The DWI technical parameters in the 1.5T scanner were FOV 199 × 295 × 82; TR range 2500–5000; TE 70 ms; flip angle 90°; slice thickness 3 mm with no inter-slice gap; voxel size 2.5 × 2.8 × 3 mm (acquisition) and 1.84 × 1.84 × 3 mm (reconstruction); B factors 0, 800, and 1600 s/mm2.
The DWI technical parameters in the 3.0T scanner were FOV 160 × 100 × 72; TR range 2500–8000; TE 70 ms; flip angle 90°; slice thickness 3 mm with no inter-slice gap; voxel size 2.5 × 2.8 × 3 mm (acquisition) and 0.71 × 0.71 × 3 mm (reconstruction); B factors 0, 800, and 1600 s/mm2.
PI-RADS assessmentThe reporting radiologist classified each suspicious lesion according to PI-RADS v2 [4] up to April 2019. Lesions from April 2019 to March 2021 were classified according to PI-RADS v2.1 [5, 17]. We included only the biopsied lesions that received a PI-RADS classification ≥ 3 in the analysis. Since the FPB was performed on the basis of the original report we did not carry out a PI-RADS revision by an additional radiologist.
ADC ratio calculation and images revisionTwo radiologists with 11 and 4 years of genitourinary imaging experience were indicated as independent readers (R1 and R2) and reviewed all MRI examinations using the departmental CARESTREAM Vue PACS (Carestream health Italia, Milano, Italy).
Figure 2 shows an example of the ADC ratio calculation. Readers had the original report available in order to identify the target lesions, but were blinded to the histopathological results. They performed the ADC ratio calculation according to Bajgiran et al. and Falaschi et al. [12, 15]. Firstly, readers identified the biopsied lesion on the basis of both the radiology and the urology report. Afterward they drew a 10 mm2 circular region of interest (ROI) on the ADC map on the supposedly biopsied area. Since lowest ADC values are known to correspond to higher GS, the ROI was positioned on the darkest area within the lesion [18]. Moreover, readers placed a second 10 mm2 circular ROI in a portion of contralateral normal-appearing prostate parenchyma, in particular in the same prostate zone where the suspected lesion was located: peripheral zone (PZ) if the target lesion was in the PZ and transitional zone (TZ) if the lesion was in TZ. The mean ADC value in the lesion and the mean value in benign prostatic parenchyma were recorded. Finally, a software automatically divided the first by the second mean ADC values, thus obtaining the ADC ratio.
Fig. 2
a, b ADC ratio calculation in a suspected PZ lesion in a 71 years old man. ADC ratio is 0.32 (565/1756). FPB later confirmed a PCa Gleason score 7 (4 + 3) in the area. c, d ADC ratio calculation in a suspected TZ lesion in a 70 year old man. ADC ratio was 0.22 (338/1477). FPB afterward confirmed a PCa Gleason score 8 (4 + 4) in the mpMRI signaled lesion. ADC apparent diffusion coefficient, PZ peripheral zone, FPB fusion prostate biopsy, PCa prostate cancer, TZ transitional zone, mpMRI multiparametric prostate MRI
At the end of data collection, the cases in which the FPB was negative but a sPC was found in the standard biopsy were reviewed by both readers in consensus, assessing the most likely cause.
Targeted fusion biopsy techniqueSoftware-based MRI-targeted/TRUS fusion biopsies of the prostate followed by 12-core systematic biopsies were taken under loco-regional anesthesia in all patients by an expert urologist. Core biopsy samples were taken via 18G trucut disposable needle using a transrectal or transperineal approach based on surgeon’s preferences. Prior to the procedure fusion biopsy was planned using T2-weighted MRI images integrated into the Biojet dedicated software. Planning images were therefore superimposed to real time TRUS images in order to facilitate real time core specimen acquisition. Three core biopsy samples of each targeted lesion were obtained in all cases using end-fire ultrasound probe (BK), whereas standard mapping biopsy samples were taken using standard segmentation of the gland to acquire medial and lateral cores from each sextant prostate region. An outpatient procedure was performed in all cases.
Statistical analysisThe minimum sample size was evaluated in relation to our primary aim: the ADC-ratio AUC estimate. We hypothesized: AUC = 0.80; L (the desired width of one-half of CI) = 0.1; k (non-malignant/malignant ratio) = 3.5; alpha error = 0.05. The total sample size, using an estimator of the variance function based on an underlying binormal distribution, was 131 (29 malignant and 102 non-malignant) [19].
We described continuous variables using means and standard deviation or median and interquartile range, as appropriate, while categorical ones were described using absolute and relative frequencies. First, we evaluated the inter-reader agreement among the two readers using the Bland Altman plot [20]. Then, in order to evaluate the concordance among the two radiologists, we divided the ADC ratios into three percentile categories (0–33, 34–66, 67+) and we calculated the weighted Cohen’s K with its 95% confidence interval (95% CI).
The difference between ADC values in exams performed on 1.5T and 3.0T scanner was evaluated in R1 measurements using Student T test.
Moreover, we used the FPB histologic results as gold reference for each biopsied lesion. The diagnostic accuracy of ADC ratio was evaluated in both readers using the area under the receiver operating characteristics curve (AUC).
All the subsequent analyses but the maximum sensitivity threshold for sPCs were performed on both readers. The AUC of the readers was calculated in:
All PCas
significant PCas
PCas in the transitional zone (TZ)
PCas in the peripheral zone (PZ)
PI-RADS 3 lesions and PI-RADS ≥ 4 lesions
We tabulated the ADC ratio sensitivity, specificity, positive predictive value, and negative predictive value for all PCas and for sPC according to different possible cut-offs. We chose the optimal cut point according to maximum sensitivity for sPC.
Statistical analyses were performed with Stata 15 (StataCorp 2017).
留言 (0)