
記住我


MemAID was a prospective double-blinded, placebo-controlled Phase 2 trial that assessed effects of INI compared to placebo treatment over 24 weeks with 24 weeks of follow-up in participants with and without diabetes randomized into four treatment arms. Primary hypotheses were that INI-treated T2DM participants would have better outcomes in memory and other specific cognitive domains, faster normal (NW) and dual-task walking (DTW) speeds, and better daily functionality, as compared to placebo-treated participants with diabetes. We also hypothesized that INI-treated controls would perform better on these outcomes, compared to placebo-treated controls [28].
A Magnetic Resonance Imaging (MRI) Substudy evaluated INI effects on cerebral blood flow (CBF) and vasoreactivity to hypercapnia and hypocapnia. We evaluated long-term INI safety including adverse events, metabolic profile, weight and hypoglycemic episodes. A Safety Substudy was conducted in subcutaneous insulin-dependent T2DM participants (T2DM-IDDM).
Standard protocol approvals, registrations, and patient consentsThe trial was conducted at the Syncope and falls in the Elderly Laboratory (SAFE, V.N. Principal Investigator) at the Clinical Research Center at Beth Israel Deaconess Medical Center (BIDMC, Boston, MA, USA) and the Center for Clinical Investigation at Brigham and Women's Hospital (BWH, P.N. Site Principal Investigator, Boston, MA, USA). Cognitive training was done at Harvard Medical School (R.M.G., Site Principal Investigator). The trial was advertised at Joslin Diabetes Center. The trial was approved by the US Food and Drug Administration (FDA; IND#107,690) and registered on www.clinicaltrials.gov (NCT02415556 on 3/23/2015). The study was conducted in accordance with the Guideline for Good Clinical Practice and followed Consolidated Standards for Reporting in Clinical Trials (CONSORT).
This study was carried out in accordance with the recommendations of ethical standards of the BIDMC, BWH and Harvard Medical School. The BIDMC Committee on Clinical Investigation, BWH and Harvard Catalyst CEDE reviewed and approved the study. All participants signed the informed consent in accordance with the Declaration of Helsinki. A Data and Safety Monitoring Board monitored progress and adverse events (AEs). Study screening began October 6, 2015 at BIDMC and June 22, 2017 at BWH. The first patient was randomized at BIDMC on November 5, 2015. In October 2017, the trial protocol and sample size were modified following National Institute of Diabetes and Kidney Diseases (NIDDK) guidance. The Safety substudy in T2DM-IDDM and enrollment of T2DM-IDDM participants were stopped due to high rate of dropouts. Retention strategies were implemented to reduce drop-out rate (participation incentives, transportation, flexible scheduling and skipping visits; Supplementary Appendix). On March 25, 2020, due to COVID-19 pandemic, on-site visits and MRI scans were stopped. The last patient was seen via virtual visit on May 21, 2020, and the study was concluded on May 31, 2020.
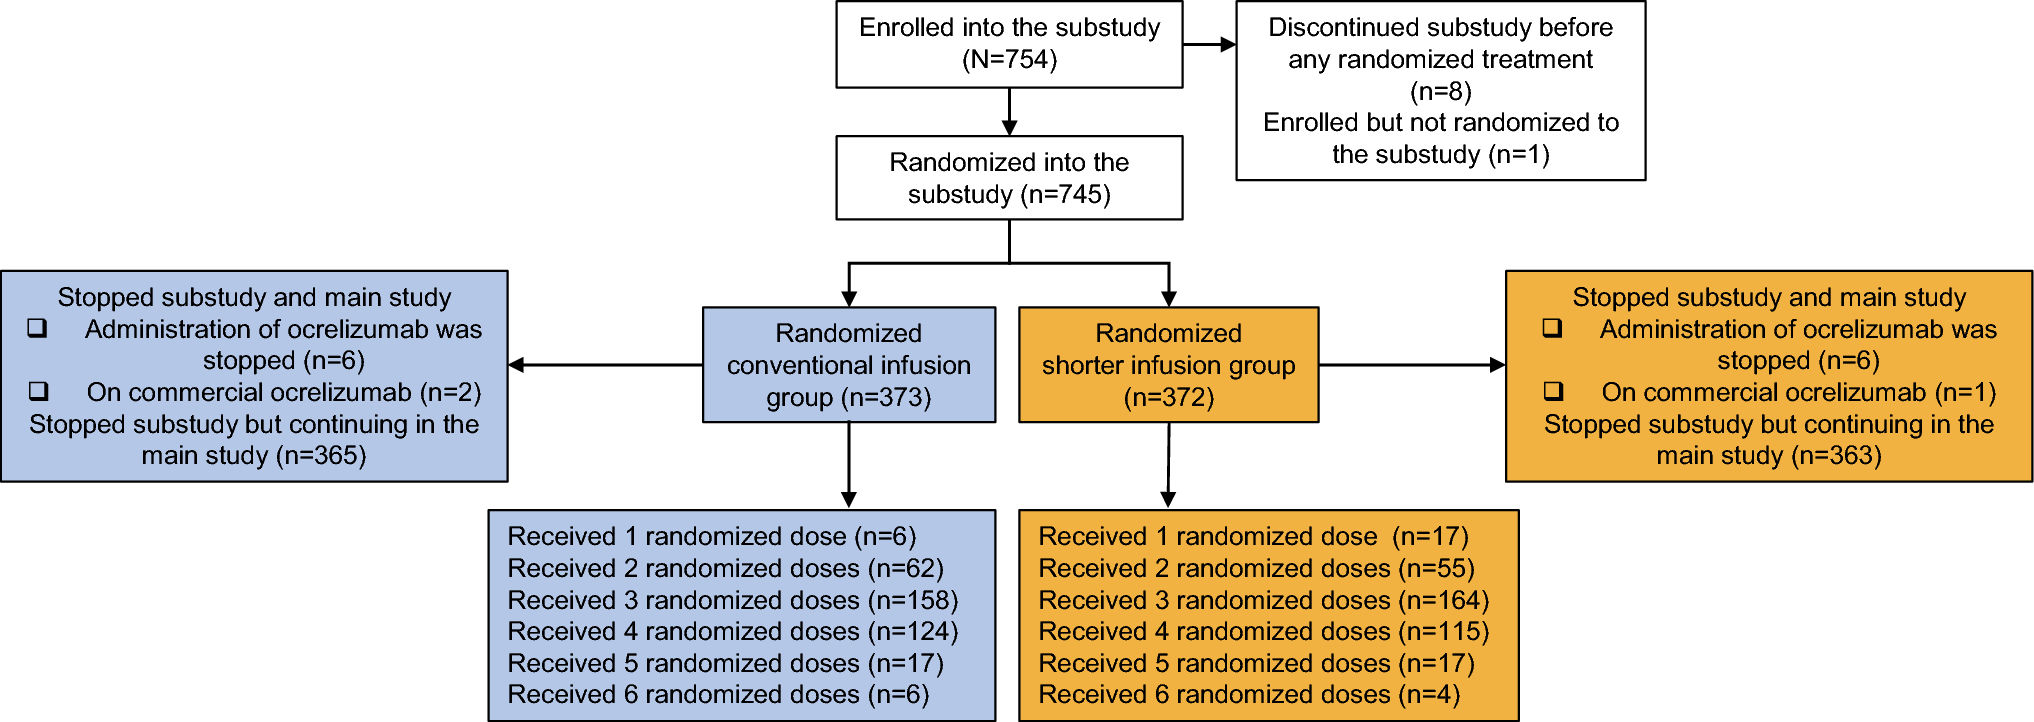
Participants and study protocolThe total of 668 subjects were contacted, 289 signed informed consent, 244 were eligible, enrolled and randomized; 223 completed baseline, 221 initiated treatment, 174 (84 DM; 90 controls) completed the 24 week (168 days) treatment and 156 (69 DM; 87 controls) completed the 24 week follow-up. The trial remained under-enrolled for T2DM groups (84 of 120 planned enrollment; 70%), but reached the target for controls (90 of 90 planned enrollment; 100%) (Fig. 1A, Consort diagram). Retention strategies and stopping enrollment of T2DM-IDDM group reduced overall drop-out rate from 28 to 17%. Due to COVID-19, 13 (11 T2DM) participants missed 23 on-site assessments and seven end-of treatment MRI scans, and ten participants were censored due to study ending. Participants were recruited from the community, BIDMC, BWH, and Joslin Diabetes Center.
Fig. 1
Consort diagram for MemAID trial and study flow chart. A Consort diagram for Memory Advancement with Intranasal insulin trial. B Study Flow chart. DM: type 2 diabetes mellitus; INI-intranasal insulin. V: Visit number, V2* consisted of two assessments: baseline and intervention 1 that were done on the same day. V8: end-of-treatment. MRI was done at V2 baseline (V2B) and after V8 at the end-of-treatment. V9: Phone call. V12: end of the follow-up. A subset of patients also completed food logs for three days before V2 baseline, V4, V6, V8. MMSE mini mental state examination, WHODAS 2.0 world health organization disability assessment schedule, GDS geriatric depression scale, AE adverse event
Inclusion criteria and study proceduresEligible participants were 50–85 years old and able to walk for six minutes. T2DM participants were treated with diet, non-insulin oral or injectable agents. Controls had fasting plasma glucose.
(< 126 mg/dL) and hemoglobin A1c (HbA1c, < 6.5%). Excluded were persons with T1DM, T2DM-IDDM (enrollment stopped in 2017), intolerance to insulin, history of severe hypoglycemia, more than one hypoglycemic episode during the entire study [29], dementia or mini mental state exam (MMSE) scores ≤ 20, serious systemic diseases, recent hospitalizations or drug abuse. INI or placebo was added to participants’ routine medication regimen.
Study procedures consisted of a phone screen, on-site screening (visit 1), baseline (visit 2), and four assessments at 8 week intervals, three medication refill visits during 24 week treatment (visits 2–8), and four assessments during 24 week post-treatment (visits 9–12) (Fig. 1B). Baseline and the first intervention assessment were done on the same day (visit 2). Visit nine was at 1 week after visit eight, and it was replaced by a phone call in 2017. Assessment visits included fasting metabolic panels, anthropometrics, cognitive, functional and mood tests, NW and DTW [28], duration about 3 h. Baseline Charlson co-morbidity index used ICD-10 codes [30]. Participants kept a diary of daily medication usage and weekly self-monitored blood glucose (SMBG). Safety outcomes, AEs and medication adherence were assessed at each visit. The study physicians evaluated participants at baseline and any AE occurrence.
Participants were randomized into four groups. The study statistician (L.N.) designed code that used randomly selected blocks with sizes four, eight and twelve to ensure uniform distribution of baseline characteristics between DM-INI vs. DM-placebo and Control-INI vs. Control-Placebo.
The PI, co-investigators, staff, participants and participants’ providers were blinded to assignments.
Interventions and deviceInsulin/placebo was delivered using the ViaNase™ electronic atomizers (Kurve Technology, Inc. Lynnwood, WA, USA). Participants administered 40 IU (0.4 mL) of human insulin (rDNA origin; Novolin® R, Novo Nordisk Inc., Bagsværd, Denmark) or placebo (0.4 mL bacteriostatic sodium chloride 0.9% solution) intranasally once daily before breakfast. Devices were calibrated to dispense a single 0.1 mL dose over 20 s. Participants sprayed a single 0.1 mL dose four times (twice into each nostril) over a 2 min period to administer the daily 0.4 mL dose of INI (40 IU) INI or placebo. Novolin® R was used off-label [31]. BIDMC and BWH research pharmacy performed sterility procedures, reconstituted study drug and dispensed according to the randomization code.
Cognition and gait outcomesPrimary outcomes were cognitive measures, NW and DTW speeds. The Cambridge Cognition computerized system (CANTAB) was used to assess attention, memory and executive function using a battery of validated tests with parallel versions to reduce practice effects [32]. Cognitive outcomes were converted to scaled z scores and summed to create composite measures [33].
The executive function composite score included the following: paired associates learning (PAL, total errors adjusted) and spatial working memory (SWM, total errors and strategy to complete tasks). Lower score indicates better performance. Verbal memory composite score included verbal immediate free recall and immediate and delayed verbal recognition memory (VRM). Higher score indicates better performance.
Gait was measured during a 6 min walk at usual speed and 6 min dual-task walking (counting backwards subtracting seven) using the Mobility Lab System (APDM, Inc., Portland, OR). Gait speed was calculated from the total distance walked over six minutes in 45 m hallway, excluding turns.
Mood was assessed with the geriatric depression scale, a validated self-report measure of mood (scale 0–30). Disability was assessed with the World Health Organization Disability Assessment Schedule (WHODAS) 2.0, a validated self-reported measure of cognition, mobility, self-care, getting along and life activities domains. The summary score was converted into a percentage score (0 no disability—100 full disability). The Wechsler Adult Reading and Comprehension test was used as a proxy for intelligence and was adjusted for age, sex and education (scale 50–128). Laboratory chemistries included blood, metabolic, lipid and renal panels collected at baseline. Fasting serum glucose, finger stick glucose, HbA1c, fructosamine, serum insulin and C-reactive peptide were collected at assessment visits (Quest Diagnostics™, Secaucus, NJ, USA).
Magnetic resonance imagingMRIs were acquired using a GE Discovery MR750 3 Tesla scanner (GE Medical Systems, Milwaukee, WI) with a receive-only 32-channel head-array coil, and a body transmit coil.
T1-weighted anatomical images were acquired with a 3D brain volume (BRAVO) sequence. Perfusion images were acquired at normocapnia (supine rest for 6 min), hypercapnia (rebreathing of 5% CO2 and 95% air for 2 min) and hypocapnia (hyperventilation for 2 min) with vital signs and CO2 monitoring using a pseudo-continuous arterial spin labeling (PCASL) sequence and 3D stack of spirals rapid acquisition with relaxation enhancement (RARE) sequence. Resting cerebral blood flow (CBF) maps [34, 35] were divided by their global mean to normalize differences among subjects. CBF responses to CO2 challenge were calculated as the difference in CBF maps between hypercapnia and normocapnia (vasodilatation), and between hypocapnia and normocapnia (vasoconstriction), respectively. Vasodilation reactivity and vasoconstriction reactivity maps were normalized by dividing the vasodilatation and vasoconstriction maps by the corresponding CO2 changes. Vasomotor range was calculated as the difference between vasodilatation and vasoconstriction maps, divided by CO2 changes [26, 36]. CBF and vasoreactivity maps were analyzed on a voxel-by-voxel basis using statistical non-parametric mapping (SnPM) software, voxel-level threshold p < 0.005. The non-parametric approach used was more robust with the nominal false positive rate of 5% [37] compared to the parametric approach.
Data managementMemAID database (Study TRAX© Macon, GA, USA) is FDA- and Health Insurance Portability and Accountability Act-compliant web-based data management software. It was used to enter and manage data, determine eligibility, track enrollment, study progress and AEs. Data quality audits were conducted regularly, to review data and correct errors. A geographically redundant storage, 256-bit encryption and a dedicated firewall protected the data.
Statistical analysesPrimary outcomes were cognition and gait (executive function, verbal learning composite scores, NW and DTW). We hypothesized that INI-treated participants with diabetes would have faster walking speed than placebo-treated T2DM participants. We also tested this hypothesis for DTW, executive function, and verbal memory. The same four hypotheses were tested in controls. Variables were collected at baseline, on-treatment visits 2–8 (0, 1, 55, 113, 165 average days from baseline) and post-treatment visits 9–12 (173, 227, 282, 333 average days from baseline). Linear mixed-effects models were used to estimate the effects of INI in the DM and Control groups. Intention-to-treat analyses (ITT-Model) included data from 223 randomized subjects who completed the baseline visit. Per-protocol analyses (PP-Model) included data from 175 participants who were compliant with treatment and used medication daily for more than 109 days (65% of 168 days treatment period); 48 non-compliant participants (22%) were excluded.
Primary outcomes were compared between DM-INI and DM-Placebo groups and between Control-INI and Control placebo groups at baseline, on-treatment and post-treatment. A spatial power variance–covariance structure was used to model within-subject correlated measurements where the number of days from the baseline visit was used as the power of the autoregressive correlation coefficient. Each efficacy and safety outcome variable was modeled separately.
The independent variables in the model included a four-level indicator variable for the following four treatment groups: a three-level time indicator variable (TIMEG) representing baseline, on-treatment and post-treatment period and an interaction term between TIMEG and treatment group.
An average number of treatment days at each assessment visit was used as a continuous repeated variable and subjects were included as random effects. Restricted maximum likelihood estimation method and linear contrasts were used to obtain the estimated mean difference and 95% confidence interval between INI and Placebo for each outcome variable. Safety analyses used the same linear mixed-effects models. Nominal p values without adjustment for multiple comparisons were specified to show the effects of each primary outcome variable modeled separately within DM and Control groups. Multiple comparison adjustment of the type-I error of 0.05 was not implemented because the null hypothesis of our study was not based on a composite hypothesis of the “or” conditions [15, 38, 39]. We did not test the “composite” null hypothesis that INI had an effect on NW or DT walking speed or executive function or verbal memory or differences between the DM and Control groups. However, we specifically and a priori set four separate null hypotheses testing each of these outcomes of interest separately. For each of the four outcomes, we used a type-I error of 0.05. No stratification of data was used to obtain the comparisons between INI and placebo for each group (DM, Controls) or time point (baseline, on-treatment, post-treatment) because that would cause a loss in statistical power. Rather, we used a single linear mixed effects model with all observations for each outcome. We used linear contrasts (linear combinations of the model betas of main effects and interaction with time period), which yielded the estimated mean difference of the outcome (e.g. gait speed) between INI vs. placebo for each group within each time period (two-tailed p-values).
Potential confounding effects of baseline differences were accounted for by randomization and by including baseline in the model. We carried out additional analyses by examining the INI effect in the combined cohort of DM and Control participants. We also examined models that would yield the overall INI effect from both DM and Control cohort by first testing for the significance of the interaction between cohort (DM, Control) and treatment group (INI, Placebo). Due to non-significance, we estimated the overall INI effect by removing the interaction and adjusting the model using HbA1c, a good proxy for DM versus Control classification. For each outcome, we computed ITT and PP models (as described above), adjusted for HbA1c as a continuous variable (Supplementary Appendix). We carried out additional subgroup analyses in the Control group by examining the INI effect in controls with pre-diabetes vs. normoglycemic controls using linear mixed-effects models as described above.
Adverse events analyses used Fisher’s exact test and chi-square test. Data were converted from Study TRAX© (Macon, GA, USA). The code and data analyses were generated using Statistical Analyses Software (SAS), Version 9.4 TS level; SAS System for Windows (X64_8PRO platform, Copyright© 2002–2012 SAS Institute Inc. (Cary, NC, USA) and JMP® Pro, Version 15 (SAS Institute Inc. Cary, NC, USA). Data-sharing of de-identified datasets will be done through collaborations and publications.
Sample sizeWe computed the required sample size based on the expected estimated mean difference at the end of treatment between the DM-Placebo and DM-INI group for cognitive (SWM errors, SWM strategy, VRM total recall) and gait variables. We set type-I error rate at 0.05, power of 0.80 or above, effect size of 15% improvement due to INI, and obtained n = 120 for the DM group (60 DM-INI; 60 DM-Placebo) and n = 90 for the Control group (45 Control-INI; 45 Control-Placebo) yielding 210 patients with data at the end of the treatment period.
留言 (0)