Participants and study design
A total of 9 patients with idiopathic cervical dystonia were recruited at Incheon St. Mary’s Hospital (Incheon, South Korea) between April 2015 and June 2016. Patients diagnosed as idiopathic cervical dystonia by experienced neurologists were eligible for this study. Exclusion criteria were family history of dystonia, structural cerebral lesions other than small vessel disease, significant cognitive dysfunction, and other neurological or psychiatric comorbidities.
SPECT scans were conducted at baseline (approximately 2 months before GPi DBS) and 3 months after the bilateral GPi DBS, and symptom severity of the dystonia was measured 3 times; baseline, 1 week, and 3 months after GPi DBS, using Toronto Western Spasmodic Torticollis Rating Scale (TWSTRS). This study was approved by the Institutional Review Board of the Incheon St. Mary's Hospital and informed consent was obtained from all participants.
Deep brain stimulation
Mild conscious sedation and local anesthetic were used to perform the surgical procedure. The initial coordinates of the GPi were assigned based on the anterior and posterior commissures: 2 mm anterior and 4 mm inferior to the midcommissural point and 22 mm lateral to the third ventricle. Based on the above indirect targeting measures, direct targeting was implemented based on the magnetic resonance imaging performed on the day of surgery to compensate for individual variation. The entry point and final trajectory were established using the planning software to avoid the ventricles, sulci, and vessels along the electrode trajectory. The burr hole was placed about 1 cm anterior to the coronal suture and 3.5–4 cm from the midline. Microelectrode was recorded beginning 5 mm above the target using 3 concentric bipolar tungsten microelectrodes which were driven simultaneously by a Elekta Microdrive at incremental depths of 0.5 mm until 2 mm above the target and then 0.2 mm depth. The ventral and posterior borders of the GPi were located and confirmed by intraoperative electrophysiology by Lead point system. For the GPi, the trajectory was planned to be lateral to the ventricle, to traverse the posterior GPi, and to terminate just above the optic tract. The GPi neuronal activity was confirmed using microelectrode recordings and macrostimulation was used to to optimize the final target. The final electrode placement was based on intraoperative effect, which was further refined by macrostimulation. The clinical responses and side effects were confirmed using intraoperative limb and jaw movements, as well as speech and vision testing. Medtronic quadripolar or Abbott or Boston scientific directional electrodes were implanted bilaterally. At a subsequent surgery, the DBS electrodes were connected to an implantable pulse generator. The accuracy of electrode placement in the GPi and postoperative complications such as intracerebral hemorrhage were assessed using postoperative nonenhanced brain computed tomography imaging.
After 2–3 days of the surgery, the DBS power was turned on according to the patient's condition, mostly starting with a low voltage of 1.5 V, a frequency of 130 Hz, and a width of 60 pulse. After that, by observing the patient's condition, the amplitude was increased and the frequency and pulse width were also finely adjusted. Most of the amplitude was maintained at about 3.5 V, and the frequency and pulse width were maintained around ± 5 from the initial setting value. DBS was also working during the tracer uptake.
Brain SPECT imaging
Brain SPECT data were obtained using a dual-headed gamma camera (Discovery NM630; GE Healthcare, Milwaukee, WI, USA) with a low-energy fan-beam collimator. Patients were injected with 555–740 MBq of technetium-99 m hexamethylpropylene amine oxime (99mTc-HMPAO) and rested for approximately 40 min prior to scanning. Images were acquired by rotating the camera a total of 720° at 6-degree intervals at a rate of 12 s per frame, while patients were in a supine resting position. Continuous transaxial images were reconstructed as follows: matrix = 128 × 128, field of view = 250 mm, pixel size = 1.95 × 1.95 mm, slice thickness = 2.08 mm, 20% symmetric energy window at 140 keV. To reduce noise, the standard ordered subset expectation maximization algorithm (6 iterations and 10 subsets) and a Butterworth filter (cut-off frequency = 0.5, power = 10) were applied.
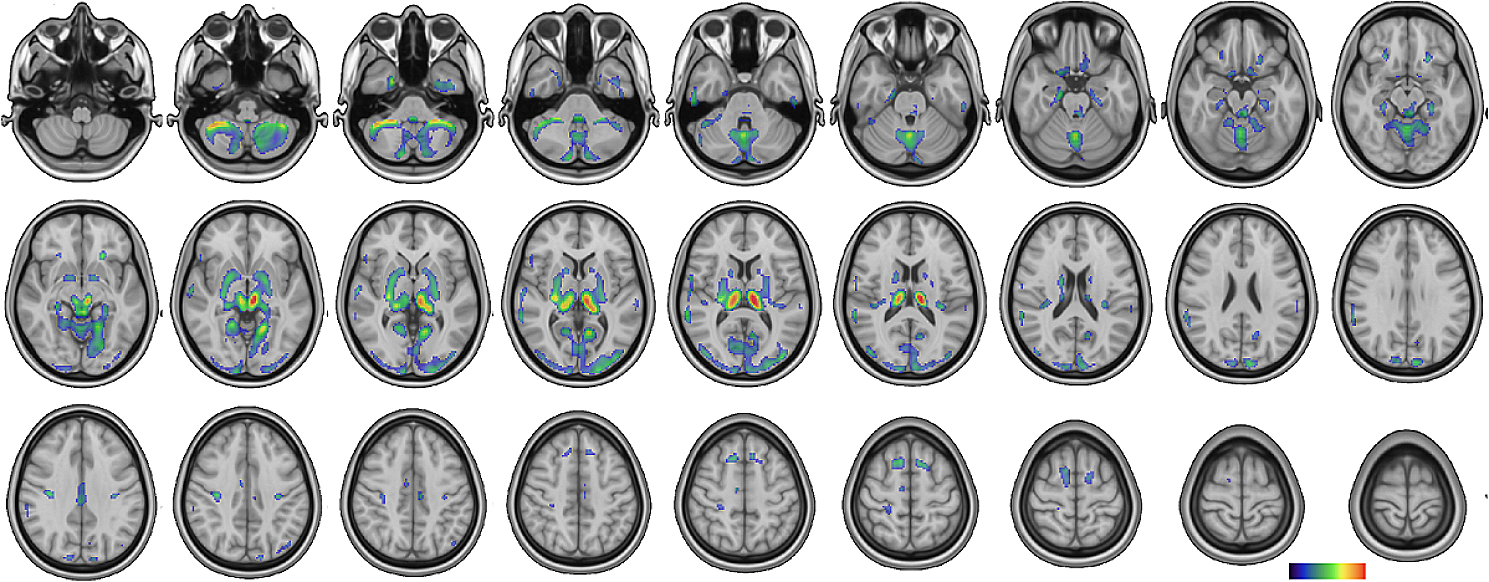
SPECT images were preprocessed and analyzed using Statistical Parametric Mapping 12. The images were spatially normalized to the standard SPECT template, resliced to 2.0 mm isotropic resolution, and smoothed with a 12 mm full width at half maximum Gaussian kernel. Global normalization was conducted using proportional scaling. A whole-brain voxel-wise paired t-test was performed to evaluate changes of rCBF between the baseline and follow-up. The voxel-level significance threshold was set at p < 0.001 with the cluster-level threshold of 20 voxels.
Statistical analysis
Changes of TWSTRS total scores were analyzed with Wilcoxon signed‐rank tests. For each cluster with significant changes in rCBF, Spearman's rank correlations were assessed between 3-month changes of rCBF and those of TWSTRS total scores. A p value of < 0.05 was considered significant. Statistical tests were carried out using STATA version 16 (StataCorp., College Station, TX, USA).


留言 (0)