Animals
Adult male Sprague–Dawley rats (Taconic Farms, German Town, NY), 8 weeks old weighing 260–300 g from Tufts University and adult male and female C57BL/6NJ Trh–Cre mice from Instituto de Biotecnología-UNAM colony, 8 weeks old weighing 26–30 g were used in this study. Animals were acclimatized to standard environmental conditions (rats: lights on between 0600 and 1800 h, temperature 22 °C ± 1 °C, rat chow -2918 Envigo- and water ad libitum; mice: lights on between 0700 and 1900 h, temperature 22 °C ± 1 °C, water, and food -Harlan 2018SX- ad libitum). Protocols followed the NIH guide for the care and use of laboratory animals (8th ed.), and the Official Mexican Norm for production, care and use of laboratory animals NOM-062-ZOO-1999. All experimental protocols were reviewed and approved by the Institutional Animal Care and Use Committee at Tufts Medical Center and Tufts University School of Medicine and the institutional bioethics committee at Instituto de Biotecnología-UNAM and Instituto Nacional de Psiquiatría Ramón de la Fuente Muñiz. The number of animals, and number of sections per animal used in each experiment are shown in Table 1.
Table 1 Experimental design, protocols, mice and rat strains usedRetrograde tract-tracing experiments in rats
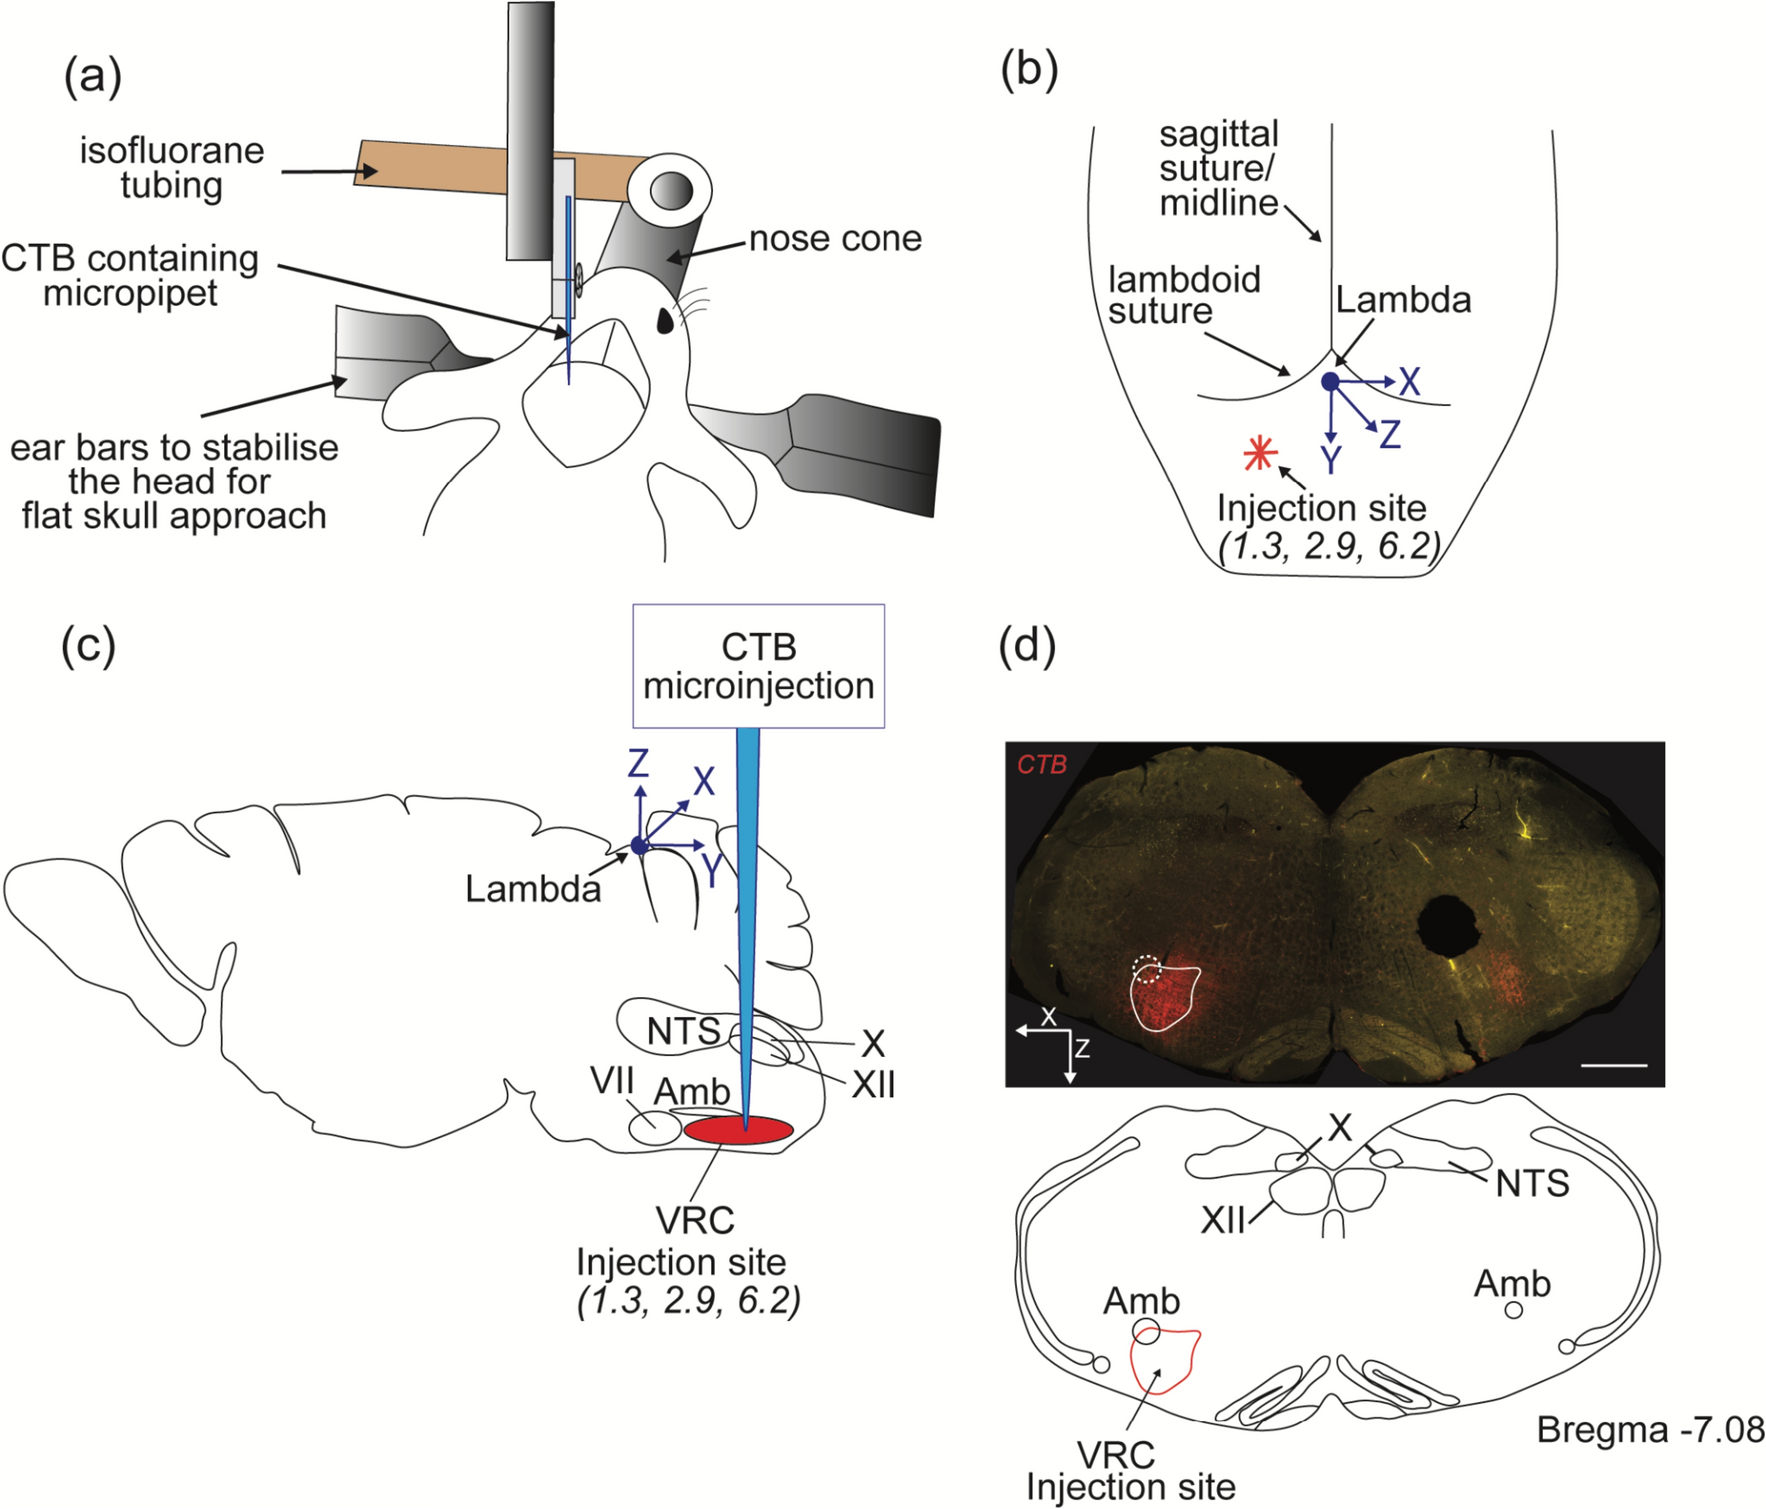
The retrograde tracer, cholera toxin ß subunit (CTB; List Biological Laboratories, Campbell, CA), was injected iontophoretically into the TMN, targeting E1–E2 subdivisions at stereotaxic coordinates from the bregma: AP = − 3.84 mm, DV = − 9.6 mm, L = − 1.5 mm or E4–E5 subdivisions at AP = − 3.84 mm, DV = − 9.33 mm, L = 0.33 mm (Paxinos and Watson 2009; Table 1). Animals were anesthetized i.p. with ketamine 50 mg/kg, xylazine 10 mg/kg body weight, and their heads mounted in a stereotaxic apparatus with bregma and lambda in the horizontal plane. A glass micropipette with 20 µm outer tip diameter filled with 0.5% CTB in distilled water was lowered into the brain through a burr hole. CTB was iontophoresed by a 6-µA positive current, pulsed on–off at 7-s intervals over 15 min, using a constant-current source (Stoelting, Wood Dale, IL). Post-operative analgesia was provided by administering buprenorphine, 0.05 mg/ kg subcutaneously. After a 10 day transport time, animals were deeply anesthetized with ketamine–xylazine and perfused transcardially with 20 ml phosphate-buffered saline (PBS; pH 7.4)-heparin, followed by 150 ml of 4% paraformaldehyde–0.1 M phosphate buffer (PB) at pH 7.4. The brains were removed, immersed in 30% sucrose for 1–2 days, and frozen on dry ice. Serial 25 µm-thick coronal sections were cut on a cryostat (Leica CM3050S, Nussloch GmbH, Germany) into one-in-six series of sections and collected into antifreeze solution (30% ethylene glycol; 25% glycerol; 0.05 M PB) to be stored at –20 °C until processed for immunohistochemistry. The positions of the injection sites were assessed by immunofluorescent staining. One series of sections were treated with 0.5% H2O2 and 0.5% Triton X-100 in PBS for 20 min, rinsed 3 times in 0.01 M PBS and incubated for 20 min in antibody diluent (2% normal horse serum, 0.2% Photoflo, 0.2% sodium azide in PBS) (Table 1). CTB injection sites were identified by overnight incubation of the sections in goat anti-CTB serum (#703, List Biological Laboratories) at 1:2,000 dilution, and subsequently in cyanine 3 (Cy3)-conjugated donkey anti-goat immunoglobulin G (IgG) for 2 h (Jackson Immunoresearch, 1:200 dilution). The specificity of the CTB antiserum was verified by the lack of any labeling in brain sections from animals that were not injected with CTB (Wittmann et al. 2009). Sections from brains with accurate injections into the TMN (Table 1) were further incubated overnight in a rabbit antibody against pro-TRH178-199 (a gift of Dr. E. Redei, Northwestern University, Chicago, IL), diluted at 1:50,000. This antiserum has been characterized by Nillni et al. (2001), who showed that it recognizes a 2.6 kDa peptide characteristic of prepro-TRH 178–199 in hypothalamic neurons in culture. Additionally, specificity for immunohistochemistry was assessed by preadsorbing the antiserum with the synthetic pro-TRH 178–199 peptide and showing no positive immunostaining in any of the preadsorption controls (Suzuki et al. 2001).
After washes in PBS, the sections were immersed in Alexa 488-conjugated donkey anti-rabbit IgG (Jackson Immunoresearch, 1:200 dilution) for 2 h. Sections were rinsed in PBS and once in Tris 0.05 M, pH 7.6, mounted onto glass slides and coverslipped with Vectashield antifade mounting medium with 4ʹ,6-diamidino-2-phenylindole, dihydrochloride (DAPI; Vector Laboratories) for imaging.
Immunofluorescence imaging and data analysis (CTB experiments)
Immunofluorescence sections were observed using a Zeiss Axioplan 2 fluorescence microscope. The images were captured using a Spot digital camera (Diagnostic Instrument, Sterling Heights, MI), double exposed while switching filter sets for each fluorochrome, and superimposed in Adobe Photoshop CS4 using a Macintosh G4 computer to create a composite image of the same field. Filter sets included an Alexa 488 excitation filter of 450–490 nm, beam splitter of 495 nm, and emission filter of 500–550 nm; and Cy3 excitation filter of 538–562 nm, beam splitter of 570 nm, and emission filter of 570–640 nm.
Immunofluorescence sections with accurate injections into the TMN were further observed with a Zeiss 510 META laser confocal microscope (Carl Zeiss, Germany), using an Argon laser at 488 nm to visualize Alexa 488, and a Helium–Neon laser at 543 nm to visualize Cy3. The confocal microscope was attached to an Axiovert 200 M microscope with a 63X Plan Apo 1.4 oil objective (Carl Zeiss) for imaging. Prior to the analysis, a lambda stack was made to obtain the emission spectrum for each fluorophore, and barrier filters were placed to separate the fluorescence emission peak and avoid cross-linking of the emission spectrum curves [Alexa 488: excitation filter of 450–490 nm, beam splitter of 495 nm, and emission filter of 500–550 nm; Cy3, excitation of 538 –562 nm, beam splitter of 570 nm, and emission filter of 570–640 nm]. Confocal images were taken using the “multi-tracking” mode. The image acquisition parameters, such as the diameter of the pinhole, the gain detector, and the laser power, were adjusted to give the adjusted dynamic range in all observed preparations. A Z-stack was obtained from each section with optical cuts of 1 μm size in the Z axis. From the Z-stack, the image with the best immunoreactivity for TRH and CTB colocalization was chosen, and the Manders overlap coefficient analysis was determined with LSM 510, Carl Zeiss 4.0sp1 software. The value of one was considered as total colocalization as referenced by Manders et al. (1993).
Anterograde tract-tracing experiments in rats
The anterograde tracer, Phaseolus vulgaris leuco-agglutinin (PHAL; Vector Laboratories, Burlingame, CA), was injected iontophoretically into the TuLH of 12 rats (Table 1) as follows. Rats were anesthetized i.p. with ketamine 50 mg/kg, xylazine 10 mg/kg body weight, and their heads positioned in a stereotaxic apparatus with bregma and lambda in the horizontal plane. A glass micropipette (20 µm outer tip diameter) filled with 2.5% PHAL in 0.01 M PB (pH 8.0) was lowered into the brain through a burr hole in the skull at the following stereotaxic coordinates from the bregma: AP = − 2.92 mm, DV = − 9.4 mm, L = − 1.6 mm corresponding to the TuLH (Paxinos and Watson 2009). The tracer was deposited by iontophoresis as described above. Rats were allowed to survive for 8 days and then deeply anesthetized with ketamine–xylazine and perfused transcardially with 20 ml 0.01 M PBS (pH 7.4), followed by 150 ml of 4% paraformaldehyde in 0.1 M PB, pH 7.4. The brains were rapidly removed, cut into two blocks, and cryoprotected by immersion in 30% sucrose-PBS overnight. The brains were sectioned at 25 µm into one-in-six series of sections and then collected into antifreeze solution to store at – 20 °C until used for immunohistochemistry. Sections were pre-treated with 0.5% H2O2 and 0.5% Triton X-100 in PBS for 20 min. Nonspecific antibody binding was reduced by treatment in 2% normal horse serum in PBS for 20 min after which they were incubated overnight in 1:5000 goat anti-PHAL antiserum (Vector labs) diluted in antibody diluent. After washing in PBS, the sections were incubated in 1:200 Cy3-conjugated donkey anti-goat IgG (Jackson Immunoresearch) for 2 h and rinsed in PBS. The specificity of PHAL antiserum was verified by the lack of any labeling in brain sections from animals that were not injected with PHAL (Supplemental Fig. 3, C1–C3). Sections from animals with injection sites in the TuLH area (Table 1) were further incubated in rabbit anti-pro-TRH178-199 antiserum (1:50,000, overnight), and subsequently in 1:400 Alexa 488-conjugated donkey anti-rabbit IgG (Jackson) for 2 h, at RT. Sections were rinsed and mounted as mentioned above. Antibody characterization has been described in detail (Wittmann et al. 2009).
Anterograde tract-tracing experiments in mice
The anterograde tracer, PHAL, was injected iontophoretically into the TuLH of ten C57BL/6 J adult male mice as described for rats, except that the stereotaxic coordinates were from the bregma AP = − 1.94 mm, DV = − 5.5 mm, L = − 0.8 mm (Paxinos and Franklin 2001; Table 1). The tracer was deposited by iontophoresis, and mice were allowed to survive for 8 days and then deeply anesthetized with ketamine–xylazine, and perfused transcardially with 5 ml 0.01 M PBS (pH 7.4), followed by 50 ml of 3% paraformaldehyde in 0.1 M PB, pH 7.4/1% acrolein. The brains were rapidly removed, cryoprotected by immersion in 30% sucrose-PBS overnight, sectioned at 20 µm, and then either processed for PHAL/ histidine decarboxylase (HDC) floating immunohistochemistry or thaw-mounted on Fisherbrand Superfrost Plus Microscope Slides, air-dried, and stored at − 80 °C until used for double-labeling immuno-in situ hybridization (ISH) fluorescence.
For immuno-ISH fluorescence, a set of mounted sections from animals with injection sites in the TuLH area (n = 3; Table 1) were hybridized with a histidine decarboxylase (Hdc; a gift from Dr. Erik Hrabovszky) fluorescein 12-UTP riboprobe, thoroughly washed, dehydrated, and pre-treated with 0.5% H2O2 and 0.5% Triton X-100 in PBS to follow the immunodetection protocol. Double immunofluorescence was detected after incubating overnight in 1:5,000 goat anti-PHAL antiserum and 1:100 anti-mouse fluorescein (11426320001, Roche) and subsequently in 1:200 Cy3-conjugated donkey anti-goat IgG and 1:200 Alexa 488-conjugated donkey anti-mouse IgG for 2 h.
For immunohistochemistry, a separated set of floating sections (Table 1) was incubated overnight in 1:5,000 goat anti-PHAL antiserum and 1:5,000 rabbit anti-histidine decarboxylase antiserum (16,045, Progen) and subsequently in 1:400 Alexa 488-conjugated donkey anti-rabbit IgG (Jackson) and 1:200 Cy3-conjugated donkey anti-goat IgG for 2 h, at RT. Sections were rinsed, mounted, and processed for immunofluorescence imaging and data analysis as follows. Specificity controls for anti-rabbit HDC antibody are described in detail by Yu et al. (2019).
Immunofluorescence imaging and data analysis (PHAL experiments)
For a quick overview, immunofluorescence was observed using a Zeiss Axioplan 2 fluorescence microscope. The images were captured, double exposed while switching filter sets for each fluorochrome, and superimposed in Adobe Photoshop CS4 to create a composite image of the same field as described.
Identification of double-labeled PHAL/TRH-immunofluorescence profiles in the TuLH or double-labeled PHAL/TRH or PHAL/HDC-immunofluorescence fibers in the TMN was determined using a CSU-W1 Yokogawa SDC on an inverted Zeiss microscope Observer Z1, equipped with Plan Neo 20X/0.8 NA and Plan Apo 63X/1.4 N.A. Fluorescence was excited with the 488 nm (50 mW) and 561 nm (20 mW) lines diode lasers and collected with a Bright Line FF01-525/30 nm and 617/73 nm, respectively. Images were acquired with an Andor iXon 5078 controlled with Slide Book 6.17 software. Multiple stage positions were collected using a WK-XYBH-APZ30-AV00FT ASI stage controller and optical sections were collected using a Z-stage ASI Piezo MS- 2000 Controller.
To quantify the degree of colocalization, original images were processed using an ImageJ macro (Schindelin et al. 2012) designed to perform the following procedure. Application of Otsu thresholding (Otsu 1979) over the 488 and 561 channels is to eliminate background pixels. Then, for each single optical section, a set of filtered pixels 488 (Gi) and 561 (Ri) was used to calculate a specific value for the Object Pearson’s coefficient (https://svi.nl/ColocalizationTheory). To illustrate the same set of filtered pixels on each single focal plane, we generated a Pearson colocalization map Mp 3 (https://svi.nl/ColocalizationTheory). A Z-stack obtained from each 488 or 561 thresholded image, with optical cuts of 1 μm size in the Z axis, was merged and represented as a composed image using the green and red channels on the ImageJ software (version 2.1.0/1.53 h, NIH, USA).
Dual-label fluorescence in situ hybridization
Ten µm (mice) or 18 µm (mice and rat) coronal sections were cut from the rostral extent of the hypothalamic lateral hypothalamus to the tuberal lateral hypothalamus (Paxinos and Watson 2009; Paxinos and Franklin 2001; Table 1) using a Leica CM3050 S cryostat, thaw-mounted on Fisherbrand Superfrost Plus Microscope Slides (Thermo Fisher Scientific; Cat #12-550-15), air-dried, and stored at – 80 °C. The mounted sections were fixed with 4% paraformaldehyde—0.1 M PB (pH 7.4) for 20 min, rinsed in PBS for 5 min, acetylated with 0.25% acetic anhydride in 0.1 M triethanolamine for 10 min, treated with ascending ethanol series (2 min) and chloroform (10 min), partially rehydrated in 95% ethanol, and then processed for in situ hybridization as described (Lazcano et al. 2015; Aguilar-Valles et al. 2007). Four adjacent series (S1–S4) of 18 µm-thick rat coronal sections (n = 3), each containing every 12th section, were hybridized with the mixture of the digoxigenin (dig)-labeled TRH receptor 1 (Trhr) (S1, S3) or digoxigenin-labeled TRH receptor 2 (Trhr2; S2, S4) and either fluorescein-labeled Trh or Hdc riboprobes. Two series (S1, S2) of 10 µm (n = 3) or two series (S1, S2) of 18 µm (n = 3) thick mice coronal sections covering the rostro-caudal extent of the TuLH (S1) or the TMN (S2) were hybridized with a mouse digoxigenin-labeled Trh and a fluorescein-labeled Cre recombinase riboprobe or a dig- labeled Trh and a fluorescein-labeled Hdc riboprobe. Sections were incubated overnight at 56 °C in a humidified chamber as described (Jones et al. 2019). The specificity of hybridization for each antisense probe has been reported elsewhere using sense probes, which resulted in the absence of specific hybridization signal in the tissues of interest (Trhr, Trhr2: Heuer et al. 2000; rat Trh: Fekete et al. 2000; mouse Trh: Kádár et al. 2010).
The Trhr, Trhr2 and Trh probes were detected with peroxidase-conjugated, anti-digoxigenin antibody (diluted 1:100 in 1% blocking reagent, Roche) and the signal was amplified with the Tyramide Signal Amplification (TSA) Plus DIG Kit (Cat# NEL748E001KT, Perkin Elmer) for 30 min, using the DIG amplification reagent at 1:500 dilution in 0.05 M Tris (pH 7.6) containing 0.01% H2O2.
Sections were then incubated in a rabbit monoclonal anti-digoxigenin antibody (Thermo Fisher, Cat# 700772; at 1 μg/ml concentration) for 3 h in the presence of 2% sodium azide to inactivate peroxidase activity. Sections were thoroughly washed in PBS and incubated overnight in peroxidase-conjugated sheep anti-fluorescein antibody (Roche, Cat# 11426346910; diluted 1:100 in 1% blocking reagent). Signal amplification was applied for 30 min using the TSA Plus Biotin Kit (Perkin Elmer) with the TSA Plus biotin reagent diluted 1:300 in 0.05 M Tris and 0.01% H2O2. The biotin deposits and the anti-digoxigenin-antibody were detected with Alexa Fluor 488-conjugated Streptavidin and Alexa 594-conjugated anti-rabbit IgG (Jackson Immunoresearch; 1:200), respectively. Sections were rinsed thoroughly in PBS, once in Tris 0.05 M (pH 7.6) and coverslipped with Vectashield antifade mounting medium with DAPI (Vector Laboratories). Immunofluorescence imaging and data analysis were made as described for CTB except that immunofluorescence was observed using a Leica DM 1000 LED fluorescence microscope with an HI PLAN 10X/0.25 or 40X/0.65 objective, and band-pass (BP) filter sets of 340–380/ dichromatic mirror (DM) 400/ barrier low pass (LP) 425; BP 480/40/DM 505/barrier BP 527/30; BP 560/40/DM 595/barrier BP 645/75 for DAPI, Alexa 488, and Alexa 594, respectively.
Images were captured using a digital Firewire camera (DFC450C, Leica) and a Leica Application Suite software. Sections were double exposed while switching filter sets for each fluorochrome and superimposed in Adobe Photoshop CS6 using an iMac computer to create a composite image of the same field.
Generation of a transgenic mouse line expressing Cre recombinase in TRH-producing cells
A bacterial artificial chromosome (BAC) clone (Clone ID: RP23-295F1, http://bacpac.chori.org), containing Mus musculus Trh genomic sequence along with 118.9 kb of 5’ flanking sequence and 80.5 kb of 3’ flanking sequence of the TRH gene, was used to generate TRH-Cre mice. The Cre recombinase coding sequence was inserted + 65 bp from the translational start site of TRH gene exon 2, along with a polyadenylation cassette and a kanamycin resistance gene flanked by a flippase-recognition target (FRT) cassette, to allow the selection of recombinants containing the insert. A 3.4 kb-long PCR product containing the mTrh flanked by the Cre-polyadenylation cassette-kanamycin amplicon was used to remove the template plasmid. Homologous recombination with electrocompetent cells was induced to insert the 3.4 kb PCR product into the BAC RP23-295F1. The FKF cassette was removed and obtention of a Trh–Cre BAC clone confirmed by sequence.
Positive clones were grown on chloramphenicol/ampicillin-resistant plates, scaled into LB antibiotic-resistant media, and purified using a commercially available kit (Nucleobond Bac Maxi Kit, BD Biosciences Clontech). The Trh–Cre BAC DNA was used to obtain transgenic founders by pronuclear microinjection of 0.5–1 ng of circular plasmid into C57BL/6 J oocytes using standard procedures by the Tufts Medical Center Transgenic Core Facility. Genotyping of transgenic mice was performed by standard PCR on genomic DNA isolated from tail snips at weaning using primers against pro-TRH exon 1 (mTRH sense primer: 5ʹ-TAGGCACCTTGGCACCCTGAT-3ʹ) and Cre recombinase protein (Cre antisense primer: 5ʹ-CCTGGTCGAAATCAGTGCGTT-3ʹ). PCR conditions for this reaction were: 94 °C for 2 min, [94 °C for 45 s, 60 °C for 30 s, 72 °C for 1:30 min] × 30 cycles, 72 °C for 10 min, stored at 4 °C. These primers generate a 600 bp band only in transgenic mice. The IL-2 gene was amplified as an internal control; IL-2 sense: 5ʹCTAGGCCACAGAATTGAAATATCT-3ʹ, IL-2 antisense: 5ʹ-GTAGGTGGAAATTCTAGCATCATCC-3ʹ. PCR conditions used for this reaction were [94 °C for 30 s, 60 °C for 1 min, 72 °C for 30 s] × 29 cycles, 72 °C for 2 min, stored at 4 °C. These primers generate a 350 bp band in all animals. Germline transmission was verified by cross-breeding TRH-Cre positive founders with wild-type C57BL/6 J mice. To maintain the TRH-Cre transgenic line, all subsequent crosses were performed using pure C57BL/6 J mice in Boston, MA USA or pure C57BL/6JN in Cuernavaca, Morelos, México.
Mapping of TuLH Trh neurons in Trh–Cre transgenic mice transduced with a Cre recombinase-dependent adeno-associated virus (AAV)
Trh–Cre mice generated in our laboratories (see above) were bilaterally injected by stereotaxic administration of an AAV carrying a Cre-dependent Gq-coupled hM3D DREADD fused with mCherry under the control of human synapsin promoter (AAV-hSyn-DIO-hM3D(Gq)-mCherry; UNC Vector Core Services, Chapel Hill, NC) at a rate of 100 nl /min (1 × 10⁹ Pfu) with a 20 µm external diameter glass capillary and a World Precision injector (Nanoliter 2010 # 4878); Bregma: AP = − 1.94 mm, DV = − 5.4 mm, L = 0.9 mm (n = 10 female; n = 5 male) (Paxinos and Franklin 2001; Table 1). The scalp was sutured, and the animal placed on a heating pad until full recovery from surgery and then returned to its home cage; buprenorphine (0.03 mg/ kg body weight; s.c.) was administered once a day for 2 days after injection. Six weeks later, to allow the expression of hM3Dq-mCherry in the TuLH, animals were deeply anesthetized with ketamine (100 mg/Kg) and xylazine (10 mg/Kg), perfused transcardially with 10 ml PBS, pH 7.4, followed by 50 ml of 4% paraformaldehyde in 0.1 M PB, pH 7.4 and their brains dissected and cryoprotected by immersion in 30% sucrose-PBS overnight. The brains were sectioned at 20 µm (Table 1) and then collected to verify the position of the injection and the status of TRH neurons by standard double immunohistochemistry as described above. Sections were incubated in mouse pro-TRH178-200 antiserum (1:1000) raised in rat (Péterfi et al. 2018) and rabbit red fluorescent protein (RFP) antiserum (1:1000, Cat. # 600-401-379, Rockland) overnight at RT. After washing, sections were incubated in 1:200 Alexa 488-conjugated donkey anti-rat IgG (Jackson Immunoresearch) and 1:200 Alexa 594-conjugated donkey anti-rabbit IgG (Jackson Immunoresearch) for 2 h. Sections were rinsed and mounted as described above. Immunofluorescence was observed using a Leica DM 1000 LED fluorescence microscope as described above. For a general view and a selection of the regions of interest, images were captured using a digital Firewire camera (DFC450C, Leica) and a Leica Application Suite software. Sections were double exposed while switching filter sets for each fluorochrome and superimposed in Adobe Photoshop CS6 using an iMac computer to create a composite image of the same field.
Confirmation of double-labeled mCherry/TRH-immunofluorescence in the TuLH or double-labeling of mCherry/TRH-immunofluorescence fibers in the TMN was determined using a CSU-W1 Yokogawa SDC on an inverted Zeiss microscope Observer Z1 as described above. Fluorescence was excited with the 488 nm (50 mW) and 561 nm (20 mW) lines diode lasers and collected with a BrightLine FF01-525/30 nm and 617/73 nm, respectively. Images were acquired with an Andor iXon 5078 controlled with Slide Book 6.17 software. Multiple stage positions were collected using a WK-XYBH-APZ30-AV00FT ASI stage controller and optical sections were collected using a Z-stage ASI Piezo MS- 2000 Controller. The analysis of colocalization was made as described for PHAL. A Z-stack obtained from each 488 or 561 thresholded images, with optical cuts of 1 μm size in the Z axis was merged and represented as a composed image, pseudo-coloring the green and red images from the ImageJ software (version 2.1.0/1.53 h, NIH, USA) with Adobe Photoshop CS6 to highlight colocalization.


留言 (0)