
記住我


Despite the value demonstrated by the emergency general surgery (EGS) model and its wide adoption, an EGS-specific national registry remains unestablished because of challenges in identifying this patient population in health systems.1–3 This hinders quality improvement (QI) programs from effective implementation. Current efforts to study EGS patients rely on one of three sources—administrative billing databases, surgical quality program such as the National Surgery Quality Improvement Project (NSQIP), or institutional registries based on the Trauma Quality Improvement Program (TQIP) model that uses an EGS coordinator and registrar for EGS-specific outcomes.4 Each of these have its limitations.
Outcome analyses using the existing billing or quality databases such as NSQIP often define patients by the necessity of emergent surgery or patients who underwent a set of predefined surgeries, which has several limitations. For one, these databases do not distinguish whether a patient is on an EGS service or received an emergency surgery by a specialty service. Second, EGS patients with significant nonoperative conditions that require the care of a surgeon, who are managed nonoperatively, or those who receive bedside procedures are not captured by these databases. Third, existing databases track only prespecified diagnosis and will miss a segment of patients cared for by the EGS team, as the exact scope of practice differs among institutions.5 These shortcomings can lead to an inaccurate representation of the EGS population, and as such, any subsequent database is diminished in its power to understand the entire population, address quality and access issues, or fully encompass the financial impact of the care provided by these surgeons. A recent effort to address some of the listed shortcomings is using a newly developed Acute Care Surgery module of NSQIP to study nonoperative management of EGS patients, but this is still in pilot phase and currently is only tailored to bowel obstructions.6
The recently developed TQIP model, while successful in demonstrating value in capturing EGS patients and tracking their outcomes compared with existing databases, is limited by the associated costs.7 It requires a dedicated team for data collection and abstraction that does not decrease over time. While TQIP is a customary or mandatory trauma center expense, there is not yet a current funding for a TQIP-like model for EGS registries, and this makes widespread adoption and implementation unlikely soon.
With the rise of big data in medicine, leveraging the electronic health record (EHR) to create a scalable registry then presents as a natural solution to the problems outlined previously. A registry integrated with the EHR offers several benefits, especially as it pertains to the EGS patients. First, all patients are already documented within the EHR, which allows for automated identification of EGS patients. Doing so decreases the manual time spent in identifying patients but still maintain accuracy of this curated patient list. Second, the EHR contains a vast amount of real-time data related to all aspects of the patient’s ongoing care. This then could be leveraged to improve care for EGS patients by providing immediate feedback on deficient metrics to treating clinical teams for prompt corrections. Lastly, EGS patient data can be streamlined into data warehouses that can then be used as launching point to collaborate with other institutions. Thus, we describe here the creation of a novel, scalable EHR-linked EGS registry that can support day-to-day clinical operations, QI efforts, and outcome-based research projects.
PATIENTS AND METHODS Patient SelectionWe built our registry for patients seen by the University of California San Diego (UCSD) Health’s EGS service. This project was granted exemption from institutional review board by the UCSD Human Research Protections Program. Strengthening the Reporting of Observational studies in Epidemiology guidelines was followed for standard reporting of this study. The completed checklist for the article is available as a Supplemental Digital Content (Supplementary Data 1, https://links.lww.com/TA/C369).
Development of the RegistryWe built our registry in the Epic EHR developed by Epic Systems Corporation (Verona, WI) with an in-house team of surgeons and clinical informatics analysts using tools readily available within the EHR. While we describe our registry built in the Epic EHR, the concepts could be applied to any EHR that uses the online transactional processing database and is linked to an analytical database. This data architecture is the most popular type for EHRs given its efficiency in large data processing and flexibility.8
At a fundamental level, the registry’s main role is identification of the EGS patient within the EHR and capturing their relevant data. However, in addition to the aggregation of data and measurements of outcomes, embedding this registry within the EHR allows it to capture the transactional data, such as orders being placed and vital signs being measured, in real time. This patient level data within the registry then can be relayed back to the clinical team immediately to alert them of possible metric deficiencies and thus prompt timely action. Figure 1 provides the overall framework of the registry.
 Figure 1:
 Simplified framework of the EGS registry.
Using that framework to define the scope of our registry, we then designed the detailed registry architecture as depicted in our concept model (Fig. 2). This diagram shows how the information of an EGS patient flows through three distinct phases within this registry. The first phase is identification of the EGS patients and bringing those patient records into the EHR registry. This is followed by two distinct phases that occur asynchronously: the “Rapid QI” phase where real-time EHR data are used to drive patient care and the “Research/QI” phase where the EHR data are converted to a common data model to support traditional research with the option of expanding to multi-institutional studies. A key component of our registry relies on the data architecture of the EHR. The majority of data in our EHR are stored in its transactional, real-time database containing a mix of structured and unstructured data. This database then houses the first phase and some parts of the second phase of the registry. Every 24 hours, the large quantity of data from the transactional database is automatically pruned, converted, and transferred to Epic Clarity, which is a relational database management system run on the programming language Structured Query Language (SQL) that is used for data analysis and reporting. The third phase of the registry derives largely from this database and its derivatives. It should be noted that, while this data architecture and process we described holds true for our EHR, its analogs can be found in other EHRs.
 Figure 2:
 Concept model of EHR-linked EGS registry. DVT ppx, deep vein thrombosis prophylaxis; UC, University of California.
Quality metrics in the Rapid QI phase of the registry are housed within the EHR’s transactional real-time database, which by virtue enables it to be constantly updated. Changes to these metrics then can be immediately made available to the clinical team through alerts or visualization methods, and any critical deficiencies can be addressed immediately. Longitudinal and aggregate data from these metrics can be used for traditional quality monitoring and improvement efforts by the service. Further description of this phase and the real-time metrics will be discussed in the “Real-Time Quality Metrics” subsection of the methodology.
For the Research/QI phase, the framework we propose here supports multicenter studies and larger-scale collaborative projects by using common data models and existing infrastructures. While different hospitals have different EHR vendors and thus have different encoding of data that traditionally makes sharing data between EHRs difficult, the common data model allows for data harmonization and thus makes data useful for any centers with existing data sharing networks. At UCSD, all data within the EHR relational data tables collected as part of standard care are converted to the Observational Medical Outcomes Partnership Common Data Model (OMOP-CDM) on a monthly interval. This converted OMOP data are stored in UCSD’s data warehouse and is also passed onto a centralized data warehouse hosted by the University of California that contains data from all University of California medical centers as illustrated in Figure 2. Well-designed queries can then be used to obtain desired data sets for studies such as EGS-related patient outcomes.
Alternatively, a federated analysis method can be implemented using Grid Binary Logistic Regression, which allows for multicenter analysis without physical transfer of data.9 Under this process, each participating center abstracts data from their local OMOP data set and generates an intermediate statistic value that is then passed onto a coordinating center for overall aggregation and analysis. These intermediate values do not contain individual-level data, which both preserves patient privacy and obviates the need for data sharing among institutions and has been used by other existing national EHR-based research networks.10
EGS Patient Capture and ValidationOur registry used existing EHR labels to automatically pull patient encounters into a relational database. A service team label was used to find primary EGS patients, while a note label was used to identify the consult patients. These labels have fixed selection options and are currently required to be completed at the end of an encounter, which enables reliable patient data capture in real time with minimal disruption to existing clinical workflow. We designated each unique patient encounter as the basic record unit within our database, as patients may have multiple encounters and we wanted our registry to be able to capture repeat hospitalizations, which is not possible with the patient as the unique record unit.
To validate our patient capture system, we conducted chart review of all patients who were pulled into the registry July 1, 2018, to December 31, 2020, to determine the false-positive EGS detection rate. A false-positive case is defined as one in which the patient visit was included in the registry but the patient was not seen by the EGS team. Because of the traditional challenges with identifying EGS patients, we were not able to validate the sensitivity of these rules. Instead, we prospectively obtained a list of all patients who were seen by the EGS service either as a consult or admission over a 4-week period, January 18, 2021, to February 14, 2021. The list was reviewed daily with the night and day EGS service teams to reconcile any differences. This list, which served as the criterion standard, was compared against the EGS registry for that same period to determine the sensitivity. To minimize observation bias, the incoming clinical teams were informed of the data gathering efforts but not given active education and instructions to change their clinical workflow related to the registry’s patient capture.
Real-Time Quality MetricsWe identified metrics that would be clinically useful in real-time and assist in ongoing QI efforts at a population level. Here, we describe three metrics to illustrate the potential benefits of leveraging real-time metrics within the EHR: total nil per os (NPO) time in a hospitalization, EGS postdischarge clinic follow-up scheduling rate, and readmission rate. The metrics were chosen for both practicality purposes and for highlighting the potential utility of this phase of the registry. For example, the clinic follow-up is the target of internal QI efforts, and having this metric available will expedite our efforts. It is also readily available in the EHR, which allows it to be rapidly deployed.
We built these metrics using a combination of existing measured fields within the EHR and custom SQL codes. For total NPO time, the start and end time stamps of each NPO order were exported to the SQL server associated with the EHR to calculate the cumulative NPO time during the entire hospitalization. This information was then reuploaded into the EHR in a custom created field. The EGS clinic follow-up metric identified whether a patient had an active order for EGS clinic follow-up and checked for whether the patient has an appointment scheduled before discharge. For readmission data, the EHR already has built-in logic to mark patients who had a hospital encounter within the last 30 days of discharge. We reapplied our registry inclusion rules to filter through the noise of this data set to identify those with EGS-related readmissions.
For reporting of these metrics in real time, a custom reporting interface was created within the Epic EHR using existing reporting workbench and dashboard tools that is easily accessible by the service teams and provided additional information such as service volume over time. Certain metrics such as NPO time was also displayed in the EHR patient list for increased ease of access.
Statistical AnalysisAll statistical analyses are conducted using the open-source software R (R Core Team, Vienna, Austria). Cases with absence of a data for binary variables were treated as negative cases. For the continuous variable NPO, absence of data meant that there was no NPO order during hospitalization, and thus, a value of 0 was assigned to that variable. Two-sample independent t test with was used for unadjusted analysis comparing quality metrics between primary EGS patients and consult patients. Two-sample proportion z test is used for comparison among variables with proportions as the measurement. An α level of 0.05 was set as the threshold of significance.
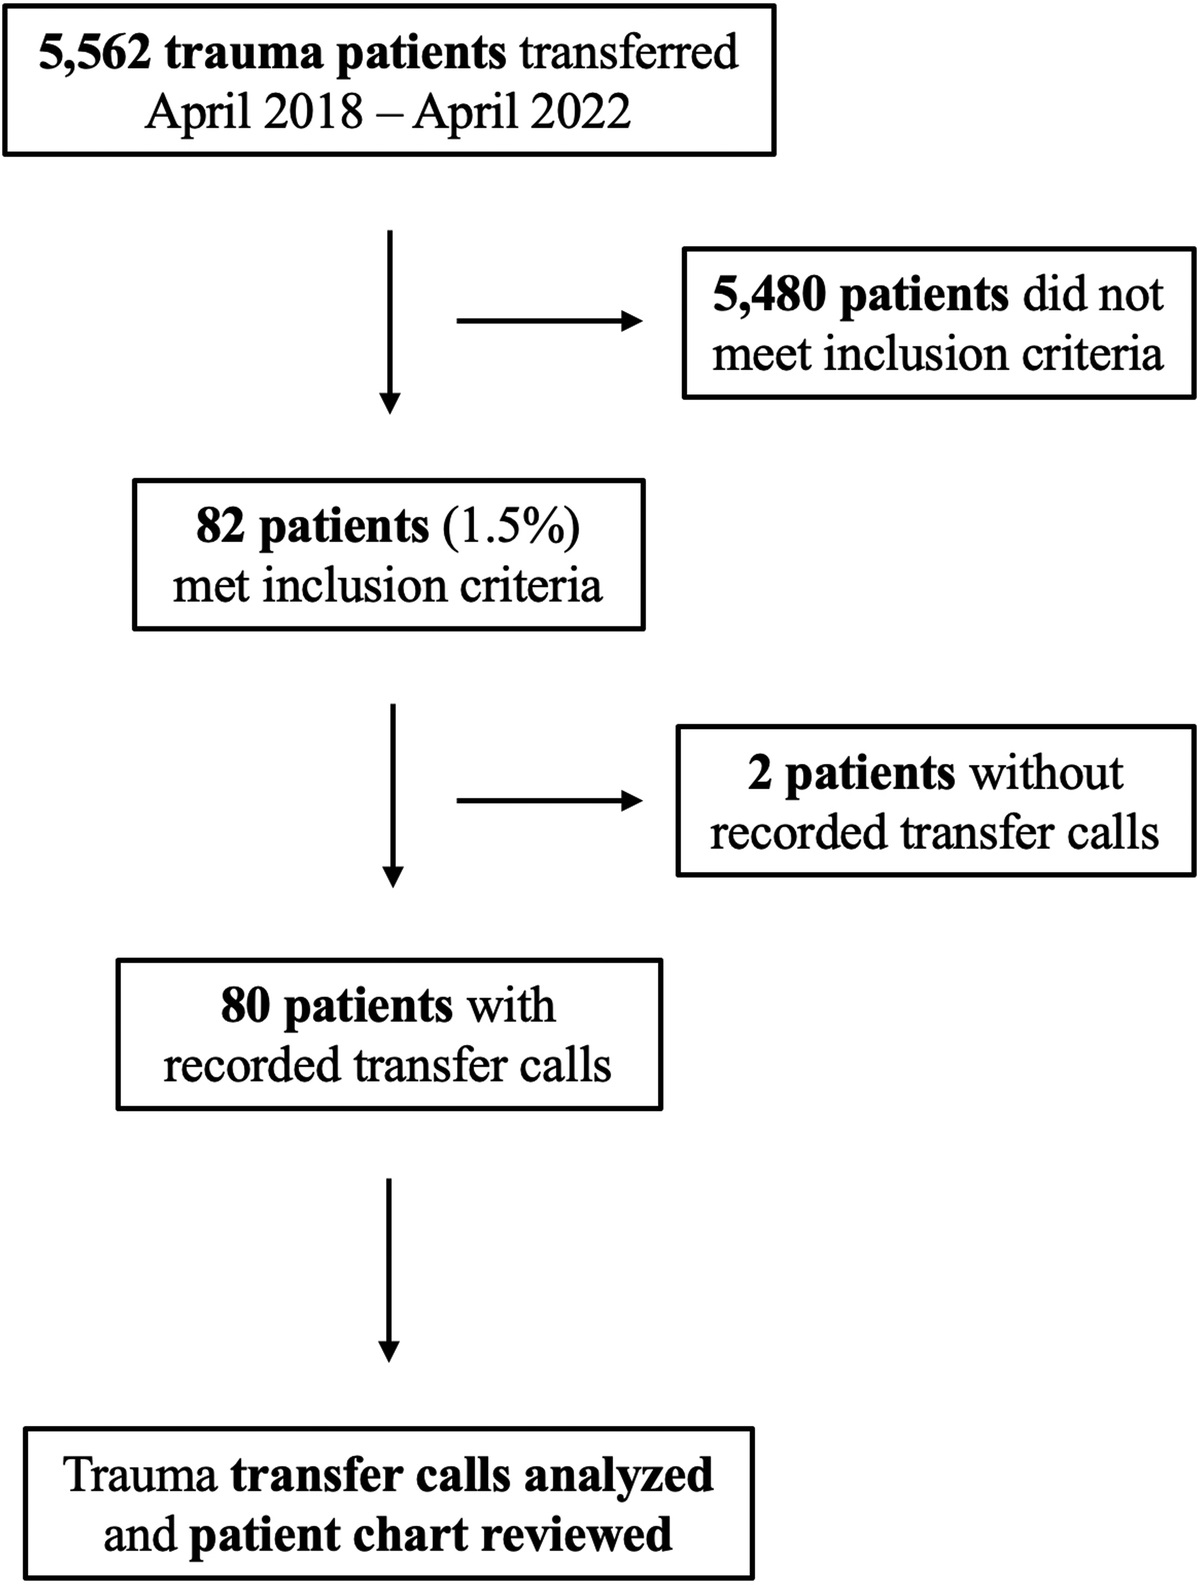
RESULTSOur registry captured 1,992 patient encounters with 1,717 unique patients from July 1, 2018, to December 31, 2020. During that period, there was a total of 78,419 emergency room visits and hospital admissions with 25,218 surgical encounters. The patient characteristics broken up by primary patient versus consults are shown in Table 1. There were no variables with missing data. In this cohort, the registry had an overall false-positive EGS detection rate of 1.86% (37 of 1,992 encounters) with a rate of 1.67% (17 of 1,029 encounters) for the primary EGS patient group and 2.07% (20 of 963 encounters) for the consult group. The CONSORT diagram in Figure 3 summarizes these results. The common reason for false positivity in the primary EGS group was patients who were on another general surgery service but mislabeled in the EHR as being on the EGS service at some point during their hospitalization. For the consult group, the error was having a patient who required a trauma surgery or burn surgery consult but mislabeled in the chart as requiring an EGS consult by the team.
TABLE 1 - Patient Characteristics and Quality Metrics of Retrospective EGS Cohort Overall EGS Primary Consults p* Unique no. patients 1,717 925 792 — Age, y 52 50 54 <0.001 Age group breakdown, y 15–30 13% 14% 11% 30–45 25% 27% 22% 45–60 30% 30% 29% 60–75 24% 23% 27% >75 8% 6% 11% % Male 60% 57.8% 62.6% 0.046 Length of stay, d 6.9 4.9 9.2 <0.001 % Deceased** 7.9% 3.7% 12.9% <0.001 Cumulative hours NPO 25.4 26.6 24.3 0.308 30-d Readmission rate 34.3% 29.2% 39.7% <0.001 EGS-related readmission rate 4.2% 2.2% 5.8% <0.001 % EGS clinic scheduled 77.5% 85.3% 60.7% <0.001*p Values are for comparison in demographic characteristics between the Primary and Consult group.
**Percent deceased refers to patients who were deceased as of December 31, 2020.
All the values shown are means except for percentages and unique number of patients.
 Figure 3:
 CONSORT diagram of the EGS registry retrospective cohort data capture review process and results.
In our prospective cohort, we had 74 unique patient encounters with an overall false-positive EGS detection rate of 0% and sensitivity of 85% (63 of 74 encounters), with a 97% sensitivity (32 of 33 encounters) for the primary EGS group and 75.6% sensitivity (30 of 41 encounters) for the consult group. Missed cases for the primary EGS group were due to having an incorrect service label within the EHR for the entire hospitalization. For the consult group, the missed cases were due to user error in inputting the service, causing the consult note to be attributed to another service.
Table 1 also displays the summary data from three real-time metrics we incorporated into our registry and applied to our retrospective cohort. The cumulative hours NPO during a hospital stay for all EGS patients was 25.4 hours and did not differ between those who were EGS primary patients and those who were consult patients. The overall 30-day readmission rate as marked by existing EHR reporting is 34.3% for all EGS patients, and this rate was significantly higher for those on other services compared with the EGS service (29.2% vs. 39.7%, p < 0.001). We found that the cases flagged as readmission were often false positives. To refine this metric, we reapplied the registry inclusion rules to the patients marked as being a 30-day readmit by the EHR to identify those who truly had a readmission within 30 days and required EGS service involvement. This yielded a lower overall readmission rate of 4.2%, but there was still a consistently lower readmission rate for patients on the EGS service compared with those on other services (2.2% vs. 5.8%, p < 0.001). Lastly, we measured the rate at which patients had a clinic appointment scheduled after being seen by the EGS service. We found that, of the patients who were recommended for clinic follow-up, 77.5% of them had an appointment scheduled. This also was higher for EGS primary patients compared with the consult patients (85.3% vs. 60.7%, p < 0.001).
DISCUSSIONThe concept of using an EHR-integrated registry is not new, as it has been successfully implemented for many chronic disease populations such as diabetes, but none exists for surgical in-patient populations including EGS.11 Here, we describe the creation of an EHR-based registry for EGS that show that is designed to support clinical care at the patient level and provide population-level data. We provide both a conceptual framework and a proof-of-concept implementation at our institution. Our validation results show that the automated capture of system based on clinical workflow and EHR labels had low false-positive rate and high sensitivity.
In support of clinical operations, we built quality metrics within the registry that are measured in real time and fed back to the clinical team. In doing so, teams can proactively act to ensure that all patients receive quality standard care rather than finding about deficiencies in retrospective quality reports. For instance, in patients with acute pancreatitis, cumulative NPO time can be used to ensure timely initiation of enteral nutrition by alerting clinical teams to patients who did not have enteral feeds initiated within 24 hours of diagnosis or have prolonged periods of NPO. Furthermore, the cumulative NPO metric could be used to quantify the impact of procedural delays and postponements on patient’s nutritional status as well as support studies looking at impact of the nature of insidious periods of NPO. Tools available for traditional EHR-based interventions such as alerts, order sets, and data visualization modules can be also leveraged for each metric as needed.
From a QI perspective, aggregate data from these metrics can identify areas of need within our clinical operations. In our retrospective cohort, we noted significant discrepancies in the percent of patients who have a scheduled follow-up EGS clinic appointment after discharge between those who are on the EGS service and those who were seen as consults. In addition, we noted that the overall clinic schedule completion rate was only 85%. Both support the need to revamp of our clinic referral process and have helped in our service’s QI initiative. The differences noted between primary and consult EGS patients can also fuel further research studies looking at the reasons underlying these differences and addressing any potential inequities in care delivery.
Lastly, our registry can be leveraged for research enterprises. Single-institution clinical outcome studies are supported through native EHR structured data reports built within the registry. Clinical outcome data for multicenter studies can be obtained from conversion of institutional EHR data to a common data model such as OMOP-CDM. Automated collection of relevant structured data in conjunction with emerging technologies in natural language processing and phenotyping from EHR data can address important EGS questions that historically have required extensive manual chart review.12–14 Furthermore, a federated data analysis using Grid Binary Logistic Regression, which preserves patient privacy while enabling pooled analysis without the need for patient-level data transfer among institutions, can serve as the basis for a dedicated nationwide EGS research consortium.15
The EHR-based EGS registry addresses key issues with regard to EGS-related research. It provides a comprehensive method to collect and analyze nonoperative care of EGS patients, which fulfills a major gap described previously by Havens et al.2 Its agile framework and low manual effort requirement in the day-to-day data acquisition compared with the other existing models lower the barrier to adoption. Similarly, the registry data are housed in the same databases used for hospital operations, which already contain the necessary resources and maintenance protocols required to protect and preserve the data. Through the real-time collection of patient care–related data and computations within the EHR, this registry offers opportunity to improve patient care on an individual level driven by metrics, which existing solutions are not capable of doing. In addition, the general blueprint for building this registry could be adapted to any hospital that uses an EHR with the popular online transactional processing data architecture and has expertise in building EHR registry building.
The use of an EHR-based registry, especially for surgical patients, is a potential paradigm shift in how outcomes research is conducted. Traditional models used disease-specific registries or databases such as NSQIP that employed many staff to maintain a database composed of manually entered data through chart review. This method, while having high quality of data, is labor intensive and limited in its ability to pivot to answer other questions. Administrative databases use claim data for population-level studies or health service research. This, while relatively cost effective, lacks the granularity of data and suffers from data accuracy. Our registry offers the best of both worlds—improving data flexibility and accuracy while also decreasing the labor associated with its creation and maintenance. Furthermore, because it can interact in real time with the clinical team and provide feedback on any potential gaps in care for patients, the registry doubles as an intervention tool. Thus, it opens a new avenue of potential QI and research questions such as examining whether the implementation of an EHR registry for EGS patients could decrease the care discontinuity.
Our method, however, is not without limitations. The inclusion rules aimed at leveraging existing clinical workflows within the EHR are subject to user error, which is reflected by our false-positive EGS detection rate of 1.8% and capture rate of 85%. However, we identified systematic errors that can be fixed with quick interventions such as education on standardizing service names, which we anticipate will improve our capture rate as we go through further iterations of the project. In the same vein, this process will also differ from institution to institution and thus may have differences in performance. As such, the implementation of this registry at institutions will require the availability of in-house expertise in clinical informatics and EHR-based registries. However, this level of informatics support is likely present at most tertiary centers, as they will have some component of population health and chronic disease management using the EHR registry tools.11,16 The registry and implementation details are also limited to the Epic EHR, which, while prevalent among tertiary centers, is not found in all hospitals. Thus, certain features described here, especially the real-time metrics capture and feedback mechanism, may differ in other EHR, and the associated advantages may not be fully realized. Resource utilization and level of expertise required to build the registry may also differ significantly. Nevertheless, some of the other core benefits and capabilities of the registry including data sharing with common data models such as OMOP will endure regardless of the EHR used. Another related limitation is that the registry will require regular maintenance by the technical team, which adds additional costs. For research purposes, the use of OMOP-CDM to characterize clinical outcomes in surgical patients will require up-front resource commitment to develop and validate against manual chart abstraction. Despite advances in automated chart abstraction and outcome capture, our registry will likely not be able to address all the permutations of research questions because of the constraints of data captured within the EHR and technological limitations at this time. Still, tools can be used in conjunction with the EHR such as emerging machine learning methods to augment the traditional chart review and improve efficiency of these studies.17 In addition, automation of the validated process will offset this cost over time. Lastly, this registry does require buy-in and dedicated resource from a center’s clinical informatics team. We recognize that not all centers have such resources and, thus, limit its propagation to smaller community hospitals. The counterpoint to that is that these centers will also likely not have the resources or need to establish a dedicated EGS service.
In brief, we have developed a novel EHR-based registry for EGS that can support day-to-day clinical operations as well as QI and research programs. Our registry departs from traditional models by taking harnessing existing technologies and clinical informatics methods. Adoption of this model beyond our institution will have many challenges. It may be that this registry provides a transition to broader efforts in the future. Nevertheless, we hope that this will lay the foundation for new methods in EGS QI and research.
AUTHORSHIPZ.M., A.M.S., and A.E.L. conceived the project. Z.M. and M.R. carried out the data collection and analysis. Z.M., M.R., and A.E.L. wrote the article. A.M.S. and J.J.D. provided critical revision of the article.
ACKNOWLEDGMENTSWe thank Carlos Ramirez, Humna Tariq, and Tracy Magee for their work in creating and implementing the EGS registry within Epic.
Z.M. is supported by the National Library of Medicine Training Grant (NIH grant T15LM011271).
DISCLOSUREThe authors declare no conflicts of interest.
REFERENCES 1. Ball CG, Hameed SM, Brenneman FD. Acute care surgery: a new strategy for the general surgery patients left behind. Can J Surg. 2010;53(2):84–85. 2. Havens JM, Neiman PU, Campbell BL, Croce MA, Spain DA, Napolitano LM. The future of emergency general surgery. Ann Surg. 2019;270(2):221–222. 3. Paramo JC, Puls MW, Welsh DJ, Andreone P. 2016 ACS governors survey: will acute care surgery change the surgical landscape?Bull Am Coll Surg. 2017;102(5):28–34. 4. Becher RD, Meredith JW, Chang MC, Hoth JJ, Beard HR, Miller PR. Creation and implementation of an emergency general surgery registry modeled after the National Trauma Data Bank. J Am Coll Surg. 2012;214(2):156–163. 5. Shafi S, Aboutanos MB, Agarwal S Jr., Brown CV, Crandall M, Feliciano DV, Guillamondegui O, Haider A, Inaba K, Osler TM, et al. Emergency general surgery: definition and estimated burden of disease. J Trauma Acute Care Surg. 2013;74(4):1092–1097. 6. Wandling MW, Ko CY, Bankey PE, Cribari C, Cryer HG, Diaz JJ, Duane TM, Hameed SM, Hutter MM, Metzler MH, et al. Expanding the scope of quality measurement in surgery to include nonoperative care: results from the American College of Surgeons National Surgical Quality Improvement Program emergency general surgery pilot. J Trauma Acute Care Surg. 2017;83(5):837–845. 7. DesPain RW, Parker WJ, Kindvall AT, Learn PA, Elster EA, Jessie EM, Rodriguez CJ, Bradley MJ. Comparison of outcomes between the national surgical quality improvement program and an emergency general surgery registry. J Healthc Qual. 2021;43:76–81. 8. Gamal A, Barakat S, Rezk A. Standardized electronic health record data modeling and persistence: a comparative review. J Biomed Inform. 2021;114:103670. 9. Wu Y, Jiang X, Kim J, Ohno-Machado L. Grid Binary LOgistic REgression (GLORE): building shared models without sharing data. J Am Med Inform Assoc. 2012;19(5):758–764. 10. Ohno-Machado L, Agha Z, Bell DS, Dahm L, Day ME, Doctor JN, Gabriel D, Kahlon MK, Kim KK, Hogarth M, et al. pSCANNER: patient-centered Scalable National Network for Effectiveness Research. J Am Med Inform Assoc. 2014;21(4):621–626. 11. Eggleston EM, Klompas M. Rational use of electronic health records for diabetes population management. Curr Diab Rep. 2014;14(4):479. 12. Denny JC, Bastarache L, Ritchie MD, Carroll RJ, Zink R, Mosley JD, Field JR, Pulley JM, Ramirez AH, Bowton E, et al. Systematic comparison of phenome-wide association study of electronic medical record data and genome-wide association study data. Nat Biotechnol. 2013;31(12):1102–1110. 13. Matevish LE, Medvecz AJ, Ebersole JM, Wanderer JP, Eastham SC, Dennis BM, Guillamondegui OD. The silent majority of emergency general surgery: an assessment of consult and operative volumes. J Surg Res. 2021;259:217–223. 14. Murff HJ, FitzHenry F, Matheny ME, Gentry N, Kotter KL, Crimin K, Dittus RS, Rosen AK, Elkin PL, Brown SH, et al. Automated identification of postoperative complications within an electronic medical record using natural language processing. JAMA. 2011;306(8):848–855. 15. Kim J, Neumann L, Paul P, Day ME, Aratow M, Bell DS, Doctor JN, Hinske LC, Jiang X, Kim KK, et al. Privacy-protecting, reliable response data discovery using COVID-19 patient observations. J Am Med Inform Assoc. 2021;28:1765–1776. 16. Mendu ML, Ahmed S, Maron JK, Rao SK, Chaguturu SK, May MF, Mutter WP, Burdge KA, Steele DJR, Mount DB, et al. Development of an electronic health record-based chronic kidney disease registry to promote population health management. BMC Nephrol. 2019;20(1):72. 17. Bronsert M, Singh AB, Henderson WG, Hammermeister K, Meguid RA, Colborn KL. Identification of postoperative complications using electronic health record data and machine learning. Am J Surg. 2020;220(1):114–119.
留言 (0)