
記住我
Our primary objective for this paper was to explore whether the atypical patterns of facial expression production metrics in autism reflect the dynamic and nuanced nature of facial expressions or a true diagnostic difference. To this end, we collected facial videos during an experimental study, derived a set of automated facial expression features from the videos using the iMotions affect recognition toolkit [26, 27], and applied an exploratory unsupervised learning approach on the feature sets for ASD and NT participants separately to derive interpretable clusters.
ParticipantsA total of 84 participants, originally part of a larger study, were included in this analysis. The current sample (n = 84) consisted of 27 ASD participants (12 female, 14 male, 1 other) and 57 neurotypical (NT) participants (21 female, 36 male). All participants in this sample were adults between the ages of 18 and 59 years. Participants were pre-screened using the Wechsler Abbreviated Scale of Intelligence Second Edition (WASI-II) [28], with Full Scale IQ (FSIQ) scores ≥ 70. Participants also completed the Social Responsiveness Scale-2 (SRS-2), a self-report questionnaire that measures autistic traits [29]. Autism diagnoses for participants were confirmed by the clinical judgment of a licensed psychologist specializing in the assessment of ASD, supported by research-reliable administration of the Autism Diagnostic Observation Schedule-2 (ADOS-2) [30]. Exclusion criteria for both ASD and NT groups included the presence of other neurological and genetic disorders, non-ASD-related sensory impairments (e.g., uncorrected visual or hearing impairments), and substance/alcohol abuse or dependence during the past 2 years. Furthermore, individuals in the NT group were excluded if they had reported a previous psychiatric history, cognitive or sensory impairment, use of psychotropic medications, or clinically elevated scores on the Social Communication Questionnaire (SCQ) [31]. Individuals with ASD and co-occurring ADHD, anxiety, or depression were included, while those with other recent psychiatric diagnoses within the past 5 years or co-occurring neurogenetic syndromes were excluded. All participants provided informed consent and were compensated $20 per hour of their time following each session. All procedures were approved by the Institutional Review Board for human subjects at Vanderbilt University Medical Center.
Experimental procedureWe captured participants’ facial expressions while they completed an adapted version of the Multifaceted Empathy Test (MET) [32], a validated multidimensional computer-based task that separates arousal, emotional, and cognitive components of empathy. A full description of the MET can be found in Quinde-Zlibut et al. [25]; briefly, the adapted version presently used includes 32 emotionally charged photographs depicting positive and negative scenarios and is known as the MET-J [33]. When presented with each image, participants were asked to rate their level of arousal, emotional relatedness (emotional empathy), and finally a cognitive empathy (i.e., emotion recognition) multiple choice question. In the present study, the task was designed to be compatible with the iMotions v.6 computer software platform for biosensor integration [26]. The facial expressions of interest for the cluster analysis were recordings from emotional empathy trials where participants viewed an emotional image (of either positive or negative valence) and were asked to answer: “While looking at the picture, how much do your feelings match the boy’s feelings?” Note that while the previous example is for a photograph of a boy, the task included standardized and validated images of males and females of all ages from the International Affective Picture System [34].
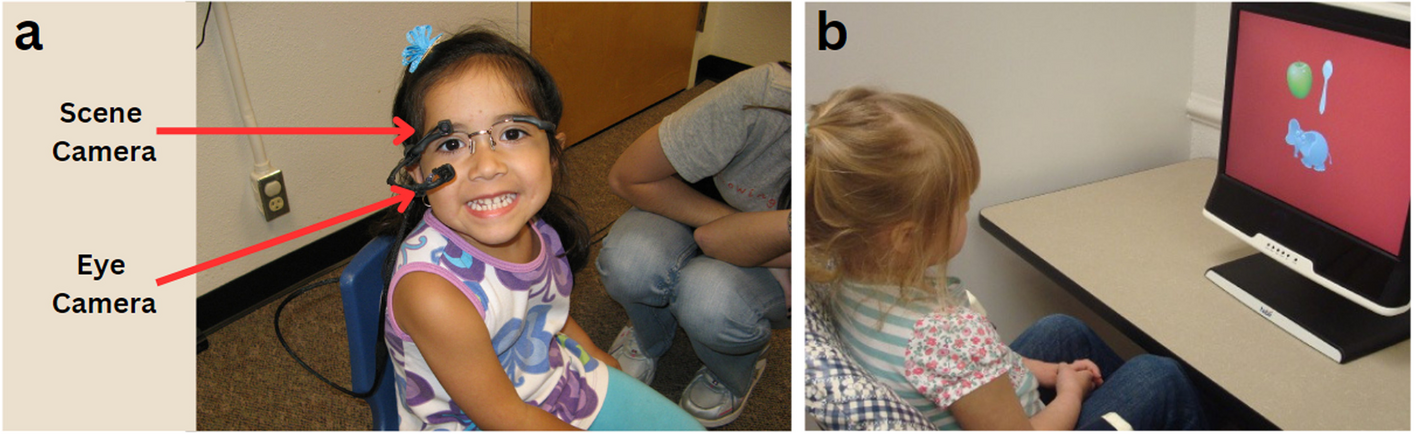
Data collectionAll participants in the MET study worked individually in the same well-illuminated testing room using a webcam-enabled laptop, which facilitated the collection of facial videos. The videos were processed post hoc using the iMotions AffDex SDK. The AffDex engine works by detecting 33 points around major facial landmarks (e.g., eyes, nose, mouth, etc.; Fig. 1), tracking and analyzing them throughout stimuli presentation to identify and classify 20 “facial action units” (AUs; e.g., upper lip raise, outer brow raise, etc.) [27]. Likelihood scores are computed based on the probability that detected AUs are equal to evaluations made by a human rater. Facial expressions or AUs with probabilities below 10% are considered to be of high uncertainty and are thus given likelihood scores of 0. The algorithm, based on Ekman and Friesen’s Emotional Facial Action Coding System (EMFACS) [35], then uses combinations of these facial AUs to compute likelihood scores for the presence of 7 core emotions (joy, anger, fear, disgust, contempt, sadness, and surprise) and summary metrics like facial engagement/expressiveness and emotional valence. The AffDex channels of interest, derived from the video frames at a frequency of 30Hz, are further defined below:
1.Engagement/expressiveness: a general measure of overall facial expressiveness, computed as the average of the highest evidence scores from the upper (brow raise, brow furrow, nose wrinkle) and the lower face region (lip corner depressor, chin raise, lip pucker, lip press, mouth open, lip suck, smile), respectively.
2.Valence: a measure of the affective quality of the facial expression, i.e., how positive or negative the associated emotion is. Increased positive valence was determined in AffDex by high likelihood of AUs like smile and cheek raise, while increased negative valence was determined by high likelihood of AUs like inner brow raise, brow furrow, nose wrinkle, upper lip raise, lip corner depressor, chin raise, lip press, and lip suck.
Fig. 1
Example of the 33 AffDex detected points around the major landmark facial features. Note that the two points between the lips are really one point that was captured during slight movement
The decision to focus on these summary metrics was made a priori to maximize objectivity and avoid confounds related to assumptions about emotion. Likelihood scores for AUs offer a more concrete and interpretable metric across clinical groups than emotion scores. AffDex scores for AUs typically recruited for expressions of joy (smile) and anger (brow furrow) were found to be significantly correlated to the corresponding EMG metrics (zygomaticus mayor/corrugator supercilii) [36]. We decided against comparing groups based on emotions (e.g., joy, sadness, etc.) because AffDex validation studies suggest that the algorithm’s classification of emotion channels is still too premature for comparative use [37, 38]. Furthermore, the autism-specific FACS and electromyography (EMG) literature is still scant and inconclusive [39, 40] — making it difficult to develop hypotheses regarding how specific AUs are recruited in this population. Derived from individual AUs, summary metrics allow for group comparisons without making assumptions about emotional states underlying specific facial expressions, which may vary by group. Thus, we decided to assess facial expression in terms of overall production (i.e., overall AUs activated in response to stimuli) and appropriateness (i.e., overall congruence of AUs activated in response to stimuli).
Approach for clustering the ASD and NT groupsFeature selectionFor each group (NT and ASD), we constructed a set of four features from the data processed through iMotions. The features, listed below, reflect overall levels of facial expressiveness and emotional valence of participants under two different experimental conditions: (a) When they responded to images evoking positive emotion valence and (b) When they responded to images evoking negative emotion valence. For each participant, we computed the average peak expressiveness and valence scores across trials depicting images of positive and negative emotional valence.
1.Expressiveness (−): average peak expressiveness score for images with negative valence
2.Expressiveness (+): average peak expressiveness score for images with positive valence
3.Valence (−): average peak emotion valence score for images with negative valence
4.Valence (+): average peak emotion valence score for images with positive valence
The coefficient of variation (SD/mean) was computed for each constructed feature, as a variance-based feature selection criterion. All four features had coefficients of variation > 20% and were included for clustering. Contrary to values from the engagement channel (which range from 0 to 100), values from the valence channel range from −100 to 100 with negative values indicating negative affect, 0 indicating neutral affect, and positive scores indicating positive affect. Thus, to avoid any potential order-of-magnitude-related feature biases within groups, each feature was Z-score standardized across participants. This was done to account for range differences in participants’ responses between the engagement and valence variables and prevent higher values from playing a more decisive role during clustering.
K-means clusteringA K-means algorithm was applied on the processed feature set of each group (ASD and NT) using the k-means implementation available in the cluster package [41] in the R environment for statistical computing [42]. K-means is a distance-based algorithm that clusters data points based on how similar they are to one another. Similarity is defined as the Euclidean distance between points such that the lower the distance between the points, the more similar they are. Likewise, the greater the distance, the more dissimilar they are [43]. In practice, the K-means algorithm clusters data points using the following steps:
1.Choice of an optimal value for k clusters: For the present analysis, we used the total within sum of squares (WSS) method. This involves comparing how the WSS changes with increasing number of clusters and identifying the number of clusters associated with the biggest drop in WSS. In our case, the optimal number of clusters determined by this method was k = 2 for both the ASD and NT cluster analyses.
2.Random assignment of each data point to an initial cluster from 1 to K: This step involves matching each participant with the closest centroid in an n-dimensional space where n corresponds to the number of features (in this case n = 4).
3.Centroid recalculation: After participants are assigned to k clusters, the centroids are recalculated as the mean point of all other points in the group.
4.Cluster stabilization: Steps 2 and 3 are repeated until participants are no longer reallocated to another centroid.
To validate assumptions made about the variance of the distribution of each attribute, the resulting clusters were visually assessed for linear boundaries, and based on their average silhouette widths, a measure of how similar each data point is to its own cluster compared to other clusters. Positive silhouette (Si) values indicate appropriately clustered data (the closer to 1, the better the data was assigned). Negative Si values indicate inappropriately clustered data while Si values of 0 indicate that the data point falls between two clusters.
The stability of the resulting clusters was assessed by bootstrap resampling of the data without replacement and computing the Jaccard similarities of the original clusters to the most similar clusters in the resampled data. Jaccard similarity values measure the ratio of points shared between two clusters and the total number of points across both clusters. The mean over the bootstrap distribution of similarity values serves as an index of the stability of the cluster and is henceforth referred to as the Jaccard Index (JI) [44]. Clusters yielding Jaccard Index values < 0.6 are considered to be highly unstable, between 0.6 and 0.75 to be indicative of patterns within the data, ≥ 0.75 to be valid and stable, and ≥ 0.85 to be highly stable [45]. One hundred bootstrap resampling runs were carried out in R using the clusterboot function in the fpc package [46] and the kmeansCBI interface function corresponding to our clustering method.
Within-group comparisonsWithin groups, clusters were compared using a robust, non-parametric effect-size statistic, Cliff’s delta [47, 48] using the orddom package [49] in R. Delta does not require any assumptions regarding the shape or spread of two distributions and estimates the probability that a randomly selected observation from one distribution is larger than a randomly selected observation from another distribution, minus the reverse probability. Possible delta (δ) values range from −1 to 1, where values of 0 indicate a complete overlap of groups and values of −1 or 1 indicate that all the values in one group are larger than all the values in the other.
Our variables of interest for this analysis included age, average peak engagement/expressiveness, average emotion congruence, and all the SRS-2 subscales. Average peak engagement/expressiveness was calculated as an average of the expressiveness scores to both negative and positive images. Average congruence was calculated as the average number of instances when a participant’s valence scores matched the emotional valence of the MET images (i.e., when the valence score was greater than 0 and the image was positive, the facial expression was marked as congruent). This metric was calculated across trials as a more intuitive measure of how appropriate participant’s facial expressions were in relation to the valence of the stimuli.
Between-group comparisons of stable clustersFor the purpose of determining whether there is a true difference in facial expressiveness, we conducted ASD-NT group comparisons on the stable subtypes identified through the separate ASD and NT cluster analyses. Separate robust ANOVAs were computed for average peak engagement and average valence. This analysis was implemented in R using the bwtrim function in the WRS2 package [50]. Briefly, the function adopts a between-within subjects design (i.e., one between-subjects variable and one within-subjects variable) to identify effects based on trimmed means. The trimmed mean discards a specified percentage of values at both ends of a distribution, providing an alternative to the arithmetic mean that is less sensitive to outliers. For both dependent variables, the between-within subjects ANOVA was calculated on the 10% trimmed mean.
Exploratory analysesFinally, we ran exploratory correlation tests between average engagement and the emotion recognition scores from the MET-J study [25], ADOS-calibrated severity scores, and SRS subscales (social cognition and social awareness) to better understand the relationship between these variables.
留言 (0)