
記住我


The MEDIM cohort is a cross-sectional study conducted 2010–2012 including Iraqi and Swedish-born residents of Malmö, Sweden (30–75 years of age, residing in the same geographical area in Malmö, matched for age) as previously described [18]. A subset of men participating in the MEDIM study, where the health examination showed that they were never smokers, nonobese (body mass index (BMI) < 30 kg/m2), and without a history of hypertension, T2D, hyperlipidemia or CVD, were invited to participate in the study (either March to May 2017 or March to May 2018).
Physical activity was self-assessed using the international physical activity questionnaire (IPAC) capturing time (minutes) physically active over the last 7 days [19]. Those who were less active than 150 minutes were considered physically inactive.
Food habits were also self-assessed using National Board of Health and Welfare guidelines for methods of preventing disease [20], capturing frequency of intake of vegetables, fruit and berries, fish and seafood as well as intake of sweet food and drinks (such as bakery, chocolate, dessert, sweets, etc.). A diet index can capture the quality of food intake, and low points < 9 are considered unhealthy eating habits [20].
Participants with at least three of the following were considered to have metabolic syndrome: systolic blood pressure > 140 mmHg; diastolic blood pressure > 90 mmHg; fasting TG > 1.7 mmol/l; insulin resistance (HOMA-IR above the 4th quartile, i.e., > 2.6) or BMI > 30 kg/m2 [21].
All subjects completed a magnetic resonance imaging (MRI) exclusion form with standard MRI patient safety criteria. Only subjects without any contraindications for MRI (defined as noncompatible metallic implants or devices or claustrophobia) were eligible.
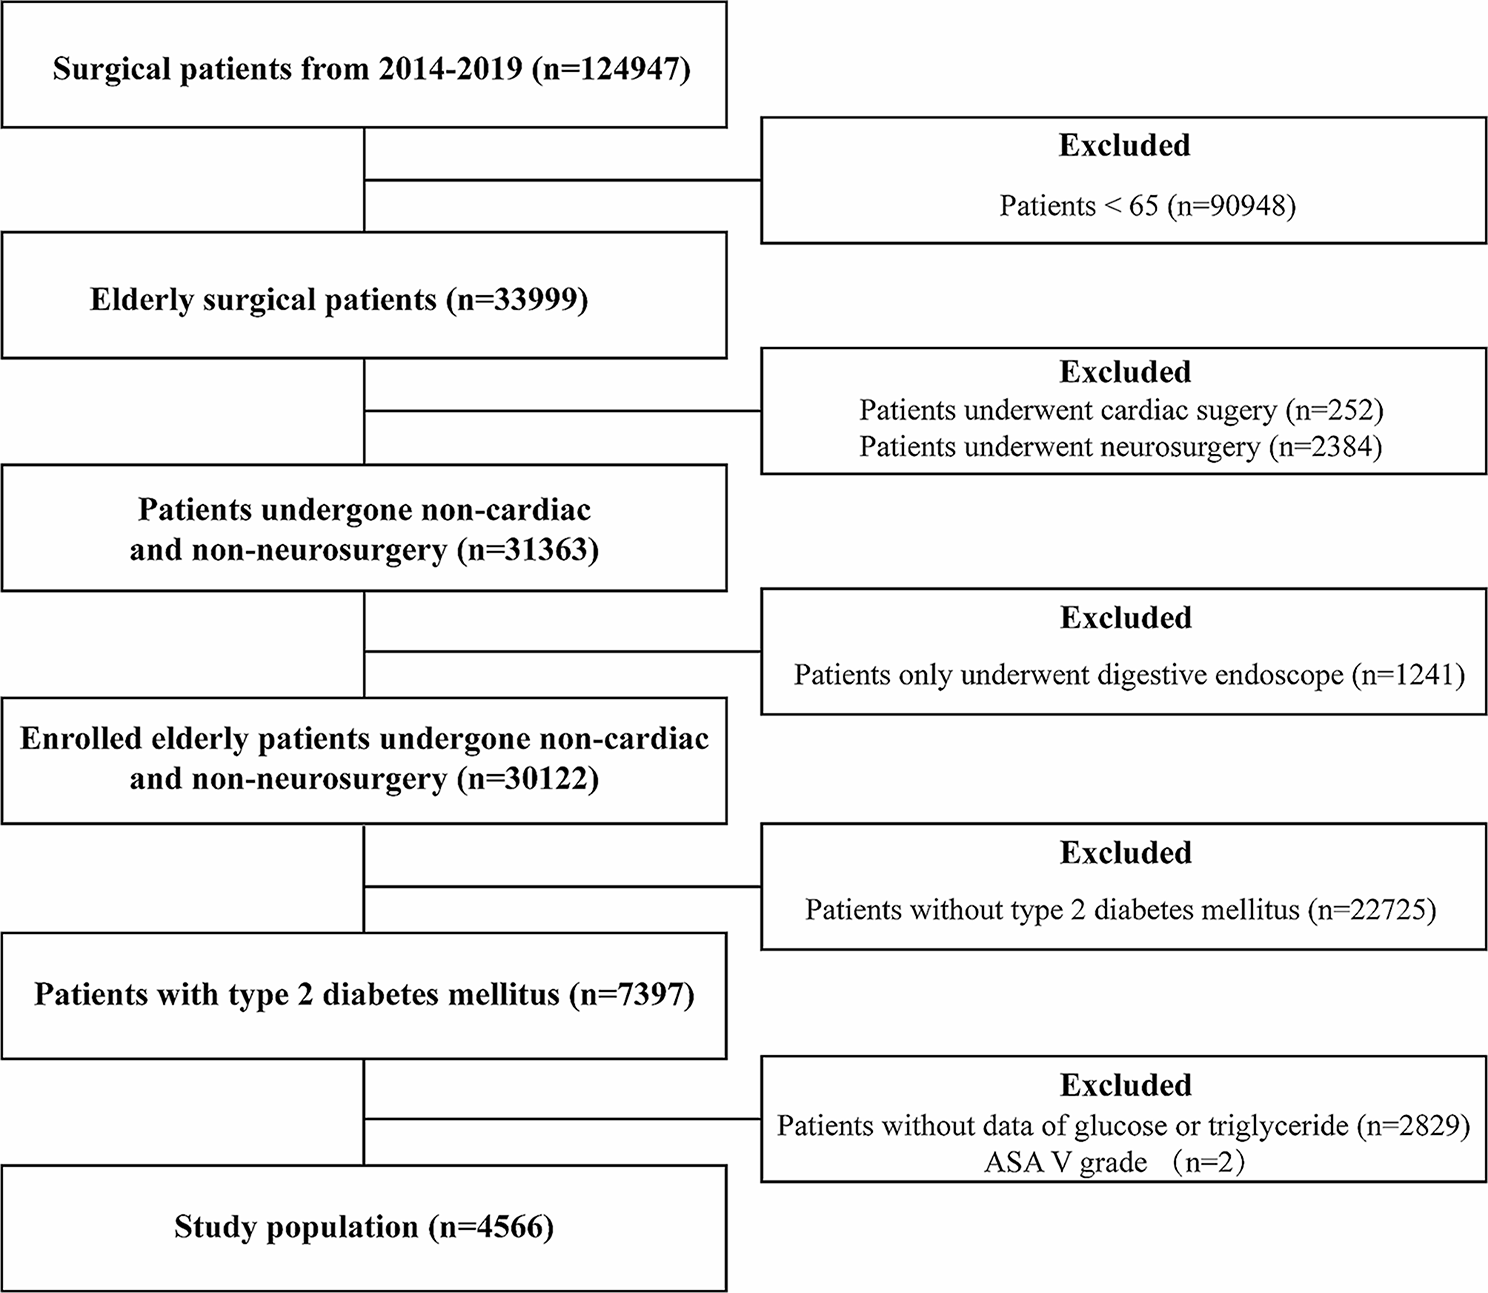
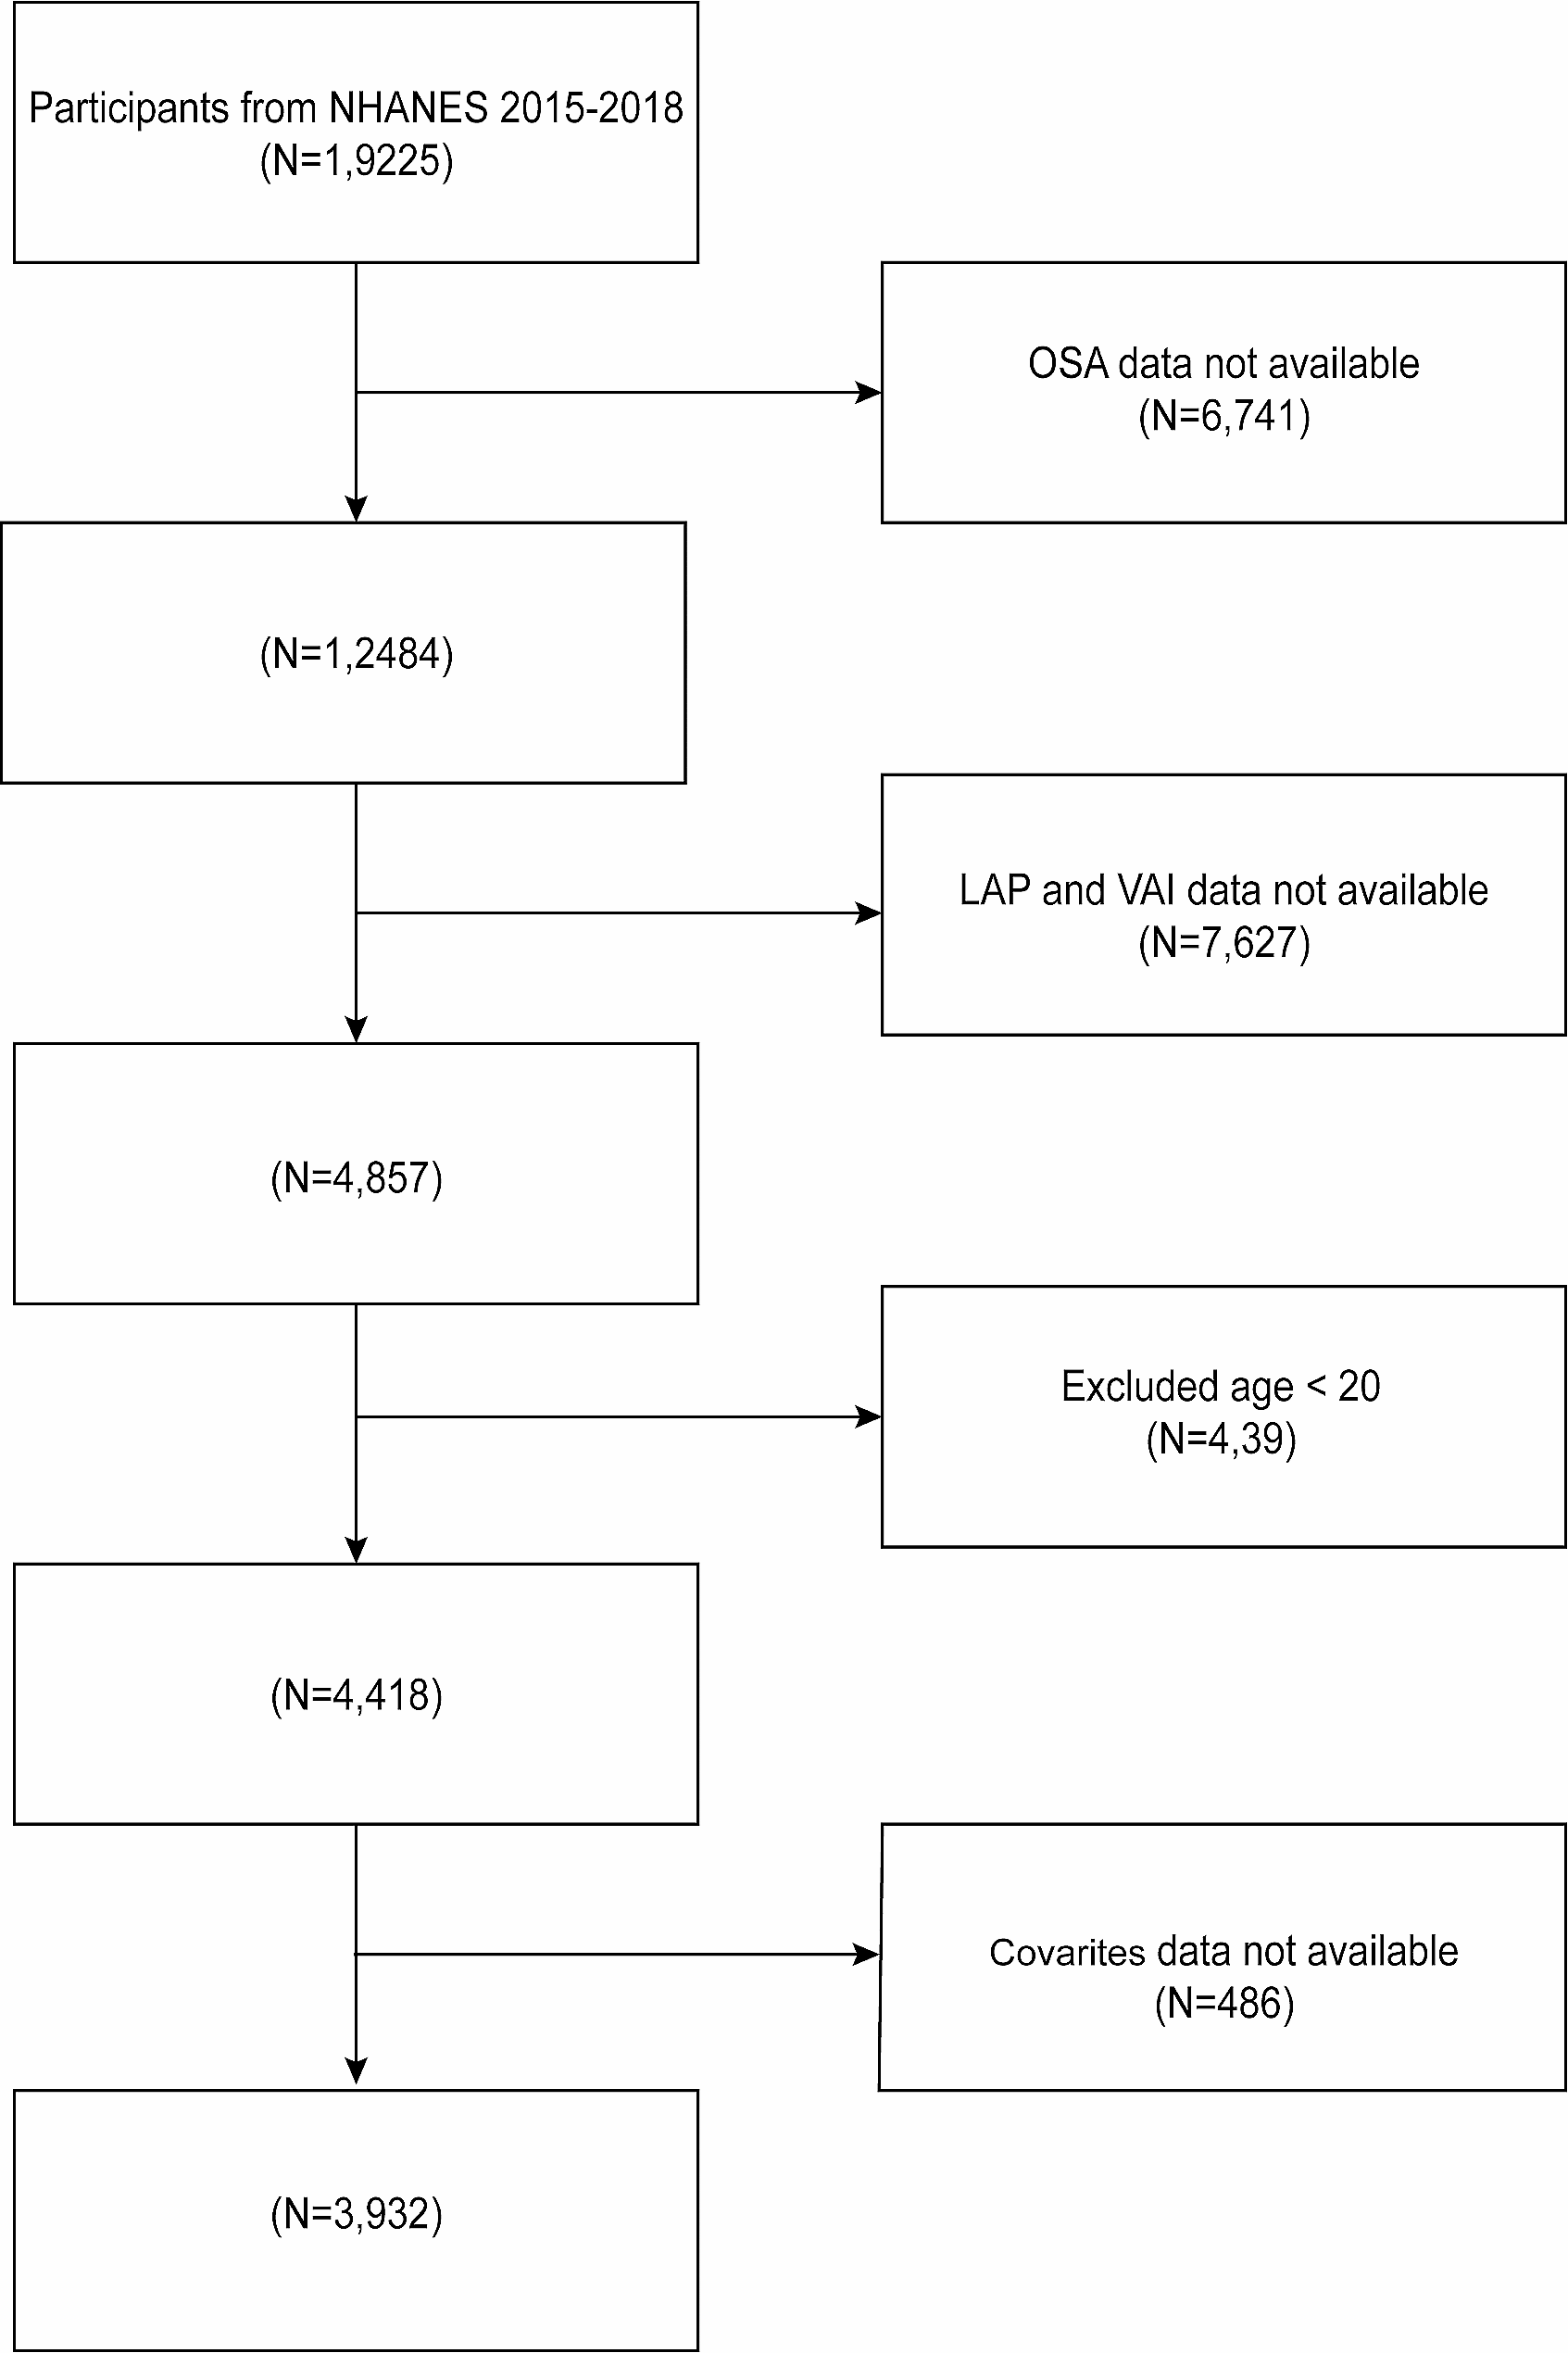
In total, 259 nonobese males (born in Iraq n = 140; born in Sweden n = 119) without CVD risk factors were invited to participate in the study (Fig. 1). A total of 42 men, 26 Iraqi born and 16 Swedish born, participated in the study, including fasting samples and oral fat tolerance tests (OFTTs). Biopsies were conducted in 25 Iraqi and 16 Swedish-born men. In 13 Iraqi-born and 11 Swedish-born men, mRNA was assessed, and adipocyte size was measured in 15 Iraqi-born and 8 Swedish-born men.
Fig. 1
Flowchart for eligible participants in conducting the oral fat tolerance test. †Oral Fat Tolerance Test (OFTT), ‡ Magnetic Resonance Imaging (MRI)
In total, 23 men born in Iraq and 15 men born in Sweden were examined by MRI. Due to technical errors, four thigh data sets (two Swedish-born and two Iraqi-born), eight abdominal data sets (four Swedish born and four Iraqi born), and eleven spectra (five Swedish born and six Iraqi born) could not be evaluated and were therefore excluded from the MRI results.
Laboratory assessmentsAnthropometrics, body composition, and laboratory data were assessed by trained Swedish research nurses with the presence of an Arabic-, English- and Swedish-speaking interpreter. Body weight was measured using an electronic scale (Coline, 34–5062 RTC3010, China), while participants were requested to wear light clothing and remove shoes. A wall-mounted stadio-meter was used to measure height. Waist circumference was measured to the nearest cm in the standing position after gentle expiration. A tape measure was placed around the bare midriff of each participant, and the waist circumference was measured midway between the lower border of the rib cage and the superior border of the iliac crest. Hip circumference was measured at the maximum level, to the nearest cm, using a tape measure. Bioelectrical impedance analysis was used to assess fat mass and fat % (Tanita Pro, Tanita Europe BV, The Netherlands).
Fasting blood samples were collected and analyzed for blood glucose, total cholesterol, triglycerides (p-TG), high-density lipoprotein cholesterol (p-HDL) and low-density lipoprotein cholesterol (p-LDL). Homeostatic model assessment (HOMA) was used to estimate both insulin resistance (HOMA-IR) and beta cell function (HOMA-beta) [22].
Indices were calculated as follows:
HOMA - IR = fasting insulin (mU/L) × fasting glucose (mmol/L)/22.5.
HOMA - β = [20 × fasting insulin (mU/L)/[fasting glucose (mmol/L) - 3.5].
Oral fat tolerance test (OFTT)An OFTT was conducted after a 12-h overnight fast [7]. A standard fat meal of 4425 kJ (1057 kcal) was prepared from 100.0 g vanilla ice cream, 150.0 g cream, 70.0 g chocolate sauce, and 35.0 g natural cottage cheese, in total containing 5 energy percent (E%) protein (13.5 g), 66 E% fat (78.7 g) and 29 E% carbohydrates (74.0 g). For lacto-intolerant individuals, there was a corresponding lactose-free alternative of 4433 kJ (1059 kcal), containing 14.0 g protein, 78.5 g fat (of which 49.8 g was saturated fat) and 74.0 g carbohydrates. The participants were instructed to drink the meal within 15 minutes and were asked to keep physical activity to a minimum and not drink or eat during the following 6 h. Blood samples were drawn at baseline (fasting samples), 30 minutes, 1 h, 2 h, 3 h, 4 h and 6 h for determination of p-TG.
Fat distribution in the liver, thigh and abdomenTo examine fat accumulation in the liver and thigh as well as the abdominal adipose tissue distribution, subjects from both groups underwent magnetic resonance imaging (MRI) and magnetic resonance spectroscopy (MRS) examinations of the liver, abdomen, and thigh using a 3 T MRI scanner (TIM Trio, Siemens Healthineers, Erlangen, Germany). To estimate the IMCL/water concentration ratio in the thigh, two point resolved spectral selection techniques (PRESS) were acquired: one with water suppression for the estimation of the IMCL signal amplitude and one without water suppression for the estimation of the water signal amplitude.
Fat/water imaging using six echoes was performed to obtain proton density fat fraction (PDFF) maps of the liver and muscle (thigh) [23]. Semiautomated approaches were used to outline the liver, SAT of the thigh, and thigh muscle regions of interest (ROIs). Using the estimated PDFF maps of the left thigh, the IMAT and SAT-thigh volumes were calculated by summing the PDFFs within the respective ROIs and multiplying by the voxel size. IMAT was defined as fat within the muscle fascia [24]. Fat-only images from the volumetric interpolated breath-hold examination (VIBE) acquisition were used to estimate the volumes of abdominal SAT and VAT. A semiautomated region-grow method was used to outline the subcutaneous depot, while the visceral depot was manually outlined to avoid the spinal cord. To further separate the VAT from other structures and organs within the abdominal cavity, a threshold was used. Only voxels above the cutoff value were considered adipose tissue and included in the VAT ROI [25, 26].
The MRS analysis was conducted using JMRUI software [27, 28]. The amplitude of IMCL was estimated from the water-suppressed spectra, while the water amplitude was assessed from the spectra without water suppression. The ratio between the concentration of IMCL and water was then calculated as suggested by Boesch et al. [29]. All the MRI and MRS sequences and corresponding settings are shown in Table 2.
Adipocyte-size distribution and mRNA expression in subcutaneous fatSubcutaneous adipose tissue samples were obtained through a needle biopsy following local anesthesia at the right side of the umbilicus at a distance of approximately 7–10 cm. Samples were analyzed for adipocyte-size distribution using a Beckman-Coulter counter after osmium fixation as described previously [30]. For mRNA analysis, samples were immediately snap-frozen in liquid nitrogen, lysed and homogenized in Qiazol™ lysis reagent (Qiagen). RNA was isolated using an RNeasy® Mini Kit (Qiagen) according to the manufacturer’s recommendations. RT-qPCRs were performed using the Quantifast SYBR Green RT–PCR kit (Qiagen) and Quantitect primer assays for 18S, SLC2A4, COL1A1, LPL, and CIDEA according to the manufacturer’s instructions. Primer sequences are considered proprietary information by Qiagen. mRNA expression levels were measured using a StepOnePlus real-time thermal cycler (Applied Biosystems, Waltham, USA) and quantitated using the ΔΔCT method as described by Livak and Schmittgen [31]. 18S mRNA expression levels were used for normalization.
Statistical analysesAnalyses were performed using SPSS version 24 (IBM). Comparisons of baseline characteristics between the Swedish and Iraqi populations were assessed using the independent-sample T test or the Mann–Whitney U test for normal and nonnormally distributed continuous variables, respectively (Table 1). Data on total area under the curve (tAUC), incremental AUC (iAUC) of postprandial p-TG concentration from Iraqis and Swedes were Log10 transformed (i.e., residuals tested for normality) and analyzed by general linear models (GLM) with age and BMI as covariates. Two-sided P values < 0.05 were considered statistically significant.
Table 1 Baseline characteristics of study participants that underwent an oral fat tolerance testTable 2 The MRI and MRS examinations and the corresponding parameter settingsWilcoxon rank sum tests were conducted to compare mRNA expression, MRI-estimated PDFFs, adipose tissue volumes, and IMCL/water concentrations of the Iraqi-born men to those of the Swedish-born men. The adipose cell size distribution is illustrated by plotting the average frequency within each bin measured from all subjects in each group (Iraqi versus Swedish). Maximum adipocyte size was collected at the peak value in the large adipose cell population for each individual.
留言 (0)