
記住我


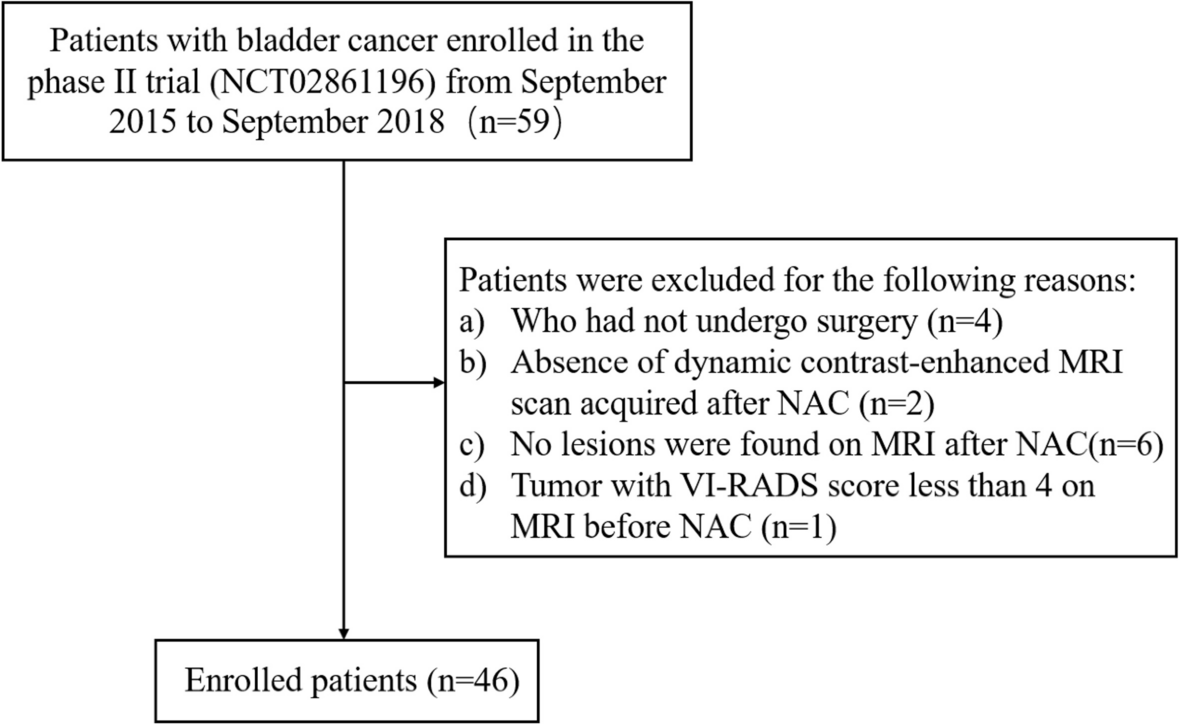


Between October 2015 and March 2021, 261 consecutive treatment-naïve patients with unresectable liver cancer who received DEB-TACE were identified from the electronic medical database of Wuhan Union Hospital. Of the 261 patients, 103 were excluded owing to: (a) histology other than HCC (n = 8) or (b) extrahepatic metastases (n = 6) or (c) conditions not eligible for measuring AEF, including haemorrhage in tumor (n = 1), main trunk of portal vein tumor thrombosis (n = 1), arterioportal shunt (n = 7) or (d) absence of triphasic CT scan data at baseline or at follow-up (n = 63), or (e) receiving any treatments other than TACE at follow-up (n = 17). The diagnosis of HCC was either biopsy-proven or met the European Association for the Study of the Liver (EASL) imaging criteria [16]. Eventually, 158 treatment-naïve HCC patients treated with DEB-TACE were enrolled for pre-treatment analyses. Of note, fourteen patients who obtained complete response (CR) after initial DEB-TACE were further excluded for the absence of viable residual tumor, leaving 144 patients for post-treatment analysis (Fig. 1). Five patients who previously underwent partial hepatectomy for HCC were confirmed without recurrence during at least 2 years of follow-up, and therefore HCC lesions of theirs were regarded as de-novo tumors [17].
Fig. 1
Flowchart showing the patient selection. HCC lesions with haemorrhage, main trunk tumor thrombosis of portal vein, or arterioportal shunt were not eligible for creating quantitative color mapping and therefore excluded. Fourteen patients who obtained complete response were excluded from post-treatment analyses because of the absence of residual tumors. DEB-TACE: drug-eluting bead transarterial chemoembolization; HCC: hepatocellular carcinoma; DSA: digital subtraction angiography
DEB-TACE technique and follow-up protocolAll DEB-TACE procedures were performed by a team of interventional radiologists with no less than 10 years of experience. For the treatment, CalliSpheres (Jiangsu Hengrui Medicine Co. Ltd., Jiangsu, China) beads of two different sizes (100–300 μm or 300–500 μm) were loaded with 60 or 80 mg of epirubicin per vial (1 g DEB) and mixed with non-ionic contrast medium to obtain the final injectable beads. After local anesthesia, transfemoral access was gained, and a 5-F visceral catheter (Yashiro, TERUMO, Japan; or R-H, COOK, USA) was advanced into the coeliac axis to identify the arterial blood supply. Superior mesenteric arterial portovenography was also performed to confirm the patency of the portal vein. Then, a coaxial 2.7-F microcatheter (Progreat, Terumo, Japan) was superselectively placed into the feeding arteries of tumors for embolization in all patients. The DEB were administrated up to a maximum of two vials, and further embolization was performed with non-resorbable bland microparticles if needed. Finally, angiography was performed to determine whether vascular stasis was achieved.
The pre-treatment examinations included liver function and alpha-fetoprotein (AFP). The baseline CT scan of the liver was scheduled within 2 weeks before treatment. Patients were followed up with triphasic CT an average of 46 days after initial treatment, and “on-demand” TACE procedures (DEB or conventional) were scheduled at an interval of 6 to 12 weeks upon the demonstration of viable tumors or intrahepatic recurrences by CT unless there was evidence of contraindications. Antiangiogenesis therapy was recommended once radiological progression (according to mRECIST) occurred (Sorafenib as initial treatment and Apatinib if the former failed) unless there was evidence of contraindications. The last follow-up date was September 30, 2021.
Image and AEF acquisitionAll CT acquisitions were performed on a Somatom Definition AS, a Somatom Definition, or a Somatom Force CT scanner (Siemens Healthcare, Erlangen, Germany). After unenhanced scanning, a triphasic contrast-enhanced scan was performed after intravenous administration of 80–100 mL non-ionic contrast medium (Iopamidol, 370 mg I/mL, Bracco) using power injection at a rate of 2.5–3.0 mL/s followed by saline flush (20 mL). Arterial phase, portal venous phase, and equilibrium phase images were obtained at 30 seconds, 50 seconds, and 3 minutes, respectively. Tube voltage was set at 120 kV with automated tube current modulation. Axial slices of 1.5 mm thick were reconstructed, and a medium smooth convolution kernel (B30f) was used. After image acquisition, the unenhanced, arterial phase, and portal venous phase data sets were transferred to a syngo.via workstation by Siemens Healthcare (Erlangen, Germany). Quantitative color mapping of AEF was then generated using the dedicated AEF tool contained in the MM Oncology mode on the workstation (Fig. 2).
Fig. 2
Arterial phase images and corresponding AEF color maps of three representative transverse planes 4 days before (a-f) and 34 days after ( g- l) DEB-TACE from a 76 years old, male, HCC patient who had SD response according to mRECIST. Before treatment, a heterogeneously enhanced HCC lesion was located at the right lobe, with significantly higher AEF (\(\frac=67.3\%\), showed as red and yellow region) than surrounding liver parenchyma (\(\frac=15.0\%\), showed as blue and purple region). After treatment, the necrosis of tumor induce by embolization showed as signal loss on the AEF color map, whereas the AEF of residual viable tumor (\(\frac=60.0\%\)) remain higher than surrounding parenchyma (\(\frac=12.0\%\)). DEB-TACE: drug-eluting bead transarterial chemoembolization; HCC: hepatocellular carcinoma; SD: stable disease; mRECIST: modified response evaluation criteria in solid tumors; AEF: arterial enhancement fraction
Image analysisThe primary lesion was determined as the largest measurable target tumor of each patient in the consensus of two radiologists (B.C and D.Q.X) for AEF and mRECIST evaluation. Radiological features of the primary lesion, including diameter, margin (smooth or non-smooth), and macrovascular invasion (presence of portal vein or hepatic vein tumor thrombosis), were reviewed for subgroup analysis. Lesion diameter was estimated by measuring the maximum diameter of viable tumor on the arterial-phase images. Treatment response was classified into CR, partial response (PR), stable disease (SD), and progressive disease (PD) in accord with mRECIST [3].
The AEF of primary HCC lesion pre-treatment (AEFpre) and that of residual viable tumor post-treatment (AEFpost) were obtained from baseline and the first follow-up AEF color map for each patient. After initial DEB-TACE, viable residual tumors were first identified on arterial phase imaging of contrast-enhanced CT and then confirmed in the following TACE procedure. The decrease ratio of AEF was defined as (AEFpre – AEFpost)/AEFpre. The region of interest (ROI) of the viable tumor was manually drawn in three representative transverse planes, and the mean AEF of three sections was used for further analysis. On each representative plane, an ROI of 1 × 1 cm2 was placed 4-5 cm away from the tumor without containing major vessels to calculate the mean of tumor-free liver parenchyma. The consensus on ROI drawing was achieved by two radiologists mentioned above who had participated in the lesion confirmation.
Statistical analysisAfter testing for normality using the Kolmogorov-Smirnov test, AEF values were expressed by mean ± standard deviation (SD). Categorical variables were expressed as frequencies (percentage). Student’s t-tests were used to compare AEFpre or AEFpost between clinical and radiological subgroups. We compared the AEF of the different response groups using analyses of variance (ANOVA), and the Holm-Bonferroni correction was performed for the post hoc test [18]. The Wilcoxon-signed rank test was used to assess the differences between AEFpre and AEFpost. The Pearson’s product-moment correlation coefficients (r) were determined for the magnitude of the relationship between AEFpre and lesion diameter, and the Spearman rank correlation coefficients (ρ) for that between AEFpost or decrease ratio and treatment response. Overall survival (OS) was defined as the interval between the first DEB-TACE procedure and death or the last follow-up (considered censored). The best cutoff values for AEFpre, AEFpost, and decrease ratio were determined by Cutoff Finder, a web application (http://molpath.charite.de/cutoff) developed by Budczies J et al. [19], to identify the patients with favorable and unfavorable survival outcomes. The cutoff optimization was based on the point with the most significant (log-rank test) split. Survival curves for OS were created according to the Kaplan-Meier method. Uni- and multivariate Cox regression analyses were performed to estimate the influence of AEF and possible confounding factors on OS, including age, gender, Child-Pugh class, baseline AFP levels, lesion number, lesion diameter, macrovascular invasion, treatment response, and repeated TACE treatment courses after the initial DEB-TACE. A p-value of less than 0.05 was considered significant. R software version 4.1.2 (http://cran.r-project.org) was used for all statistical analyses.
留言 (0)