
記住我


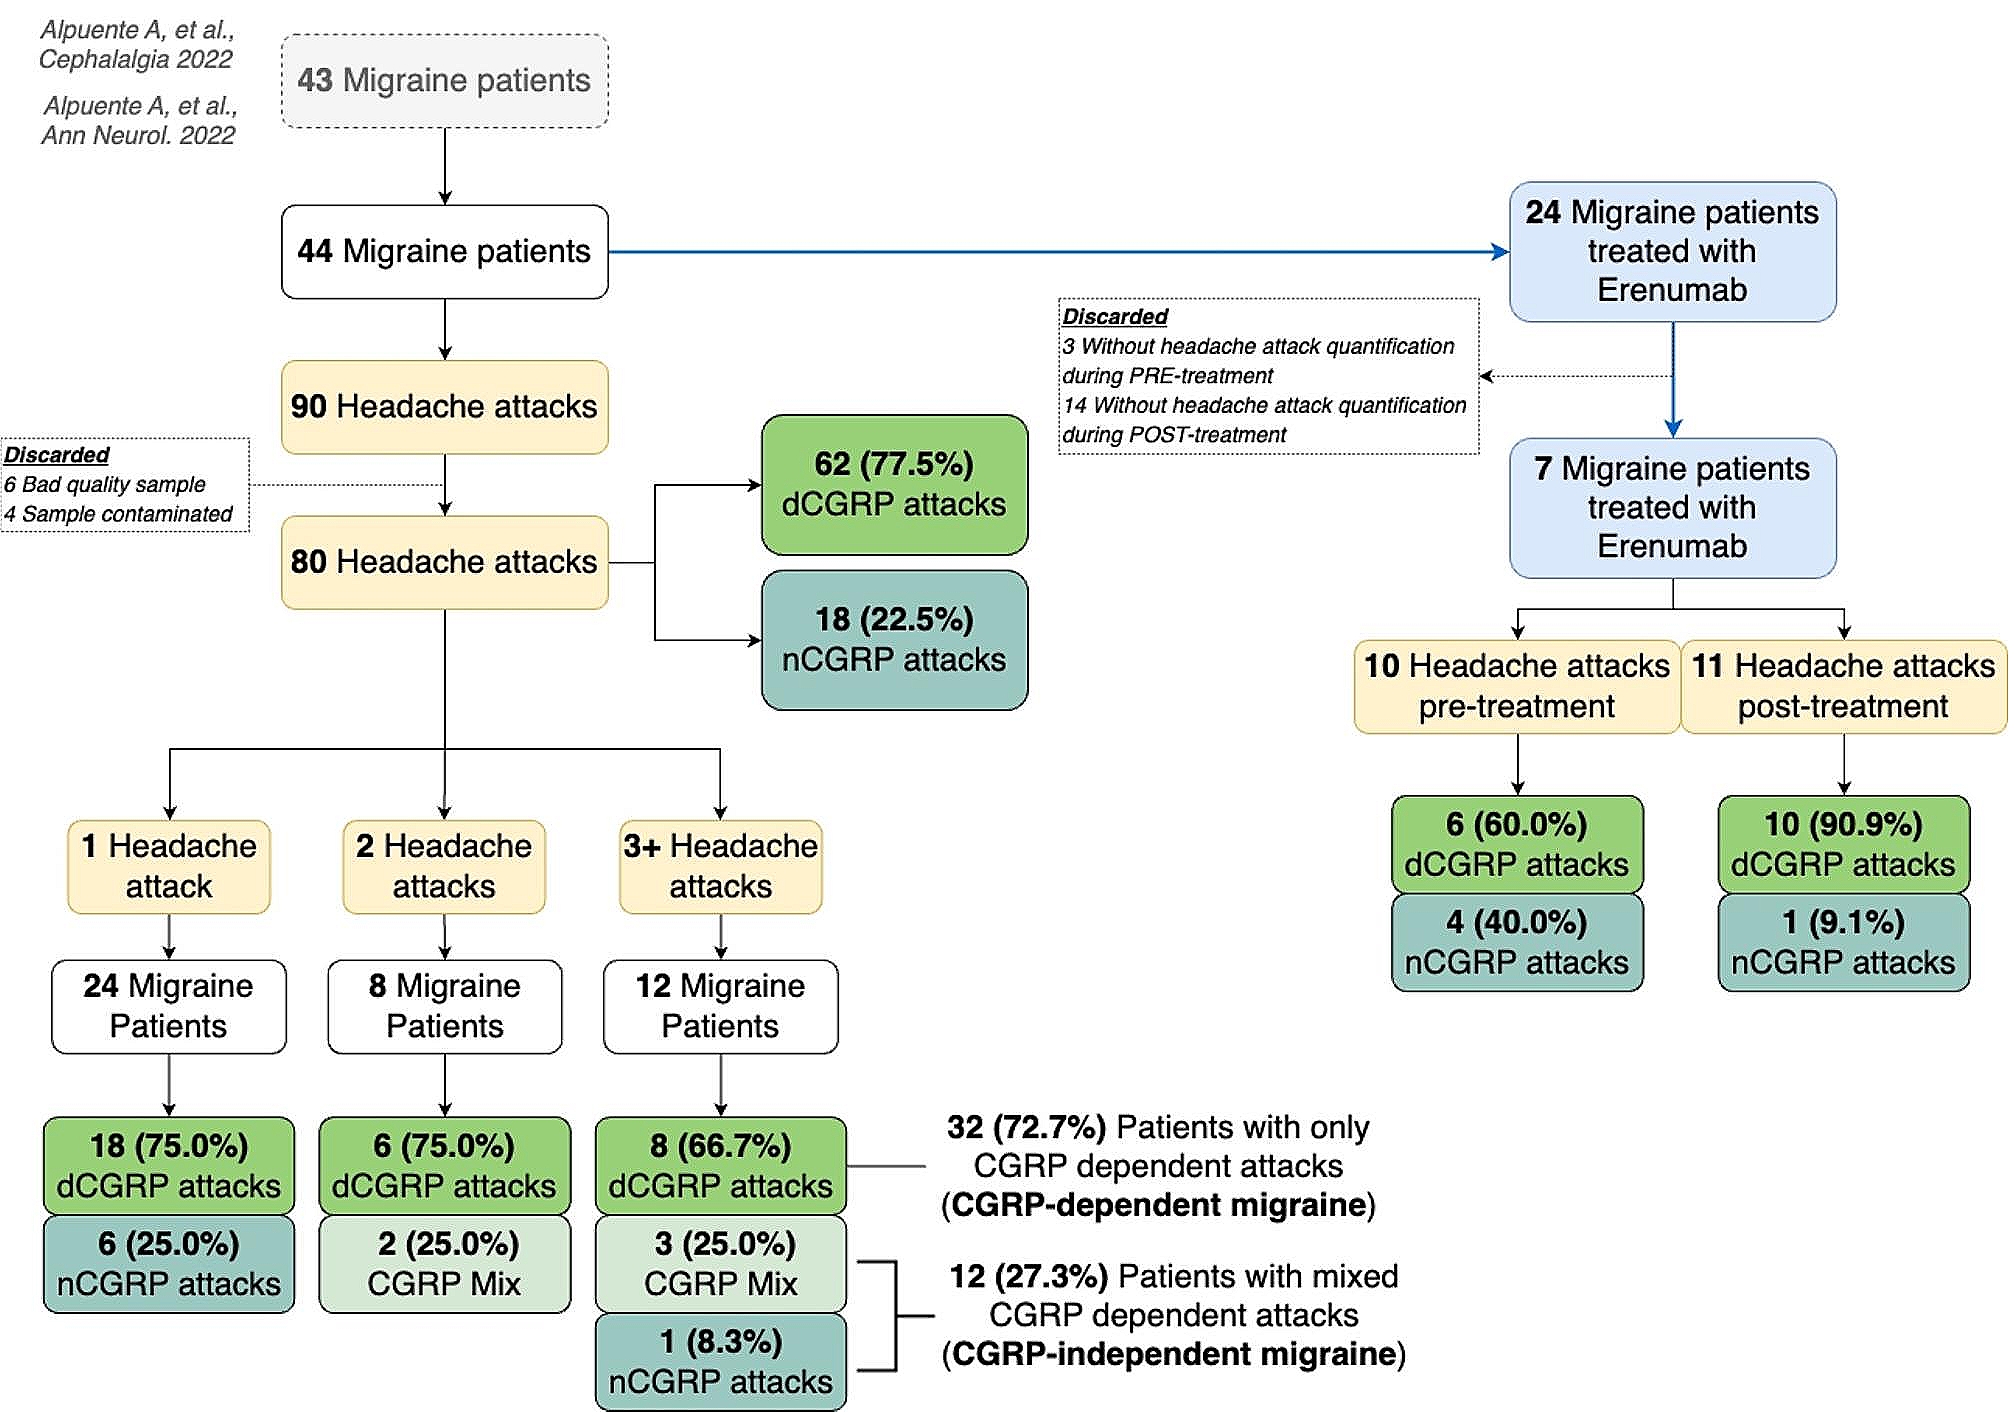

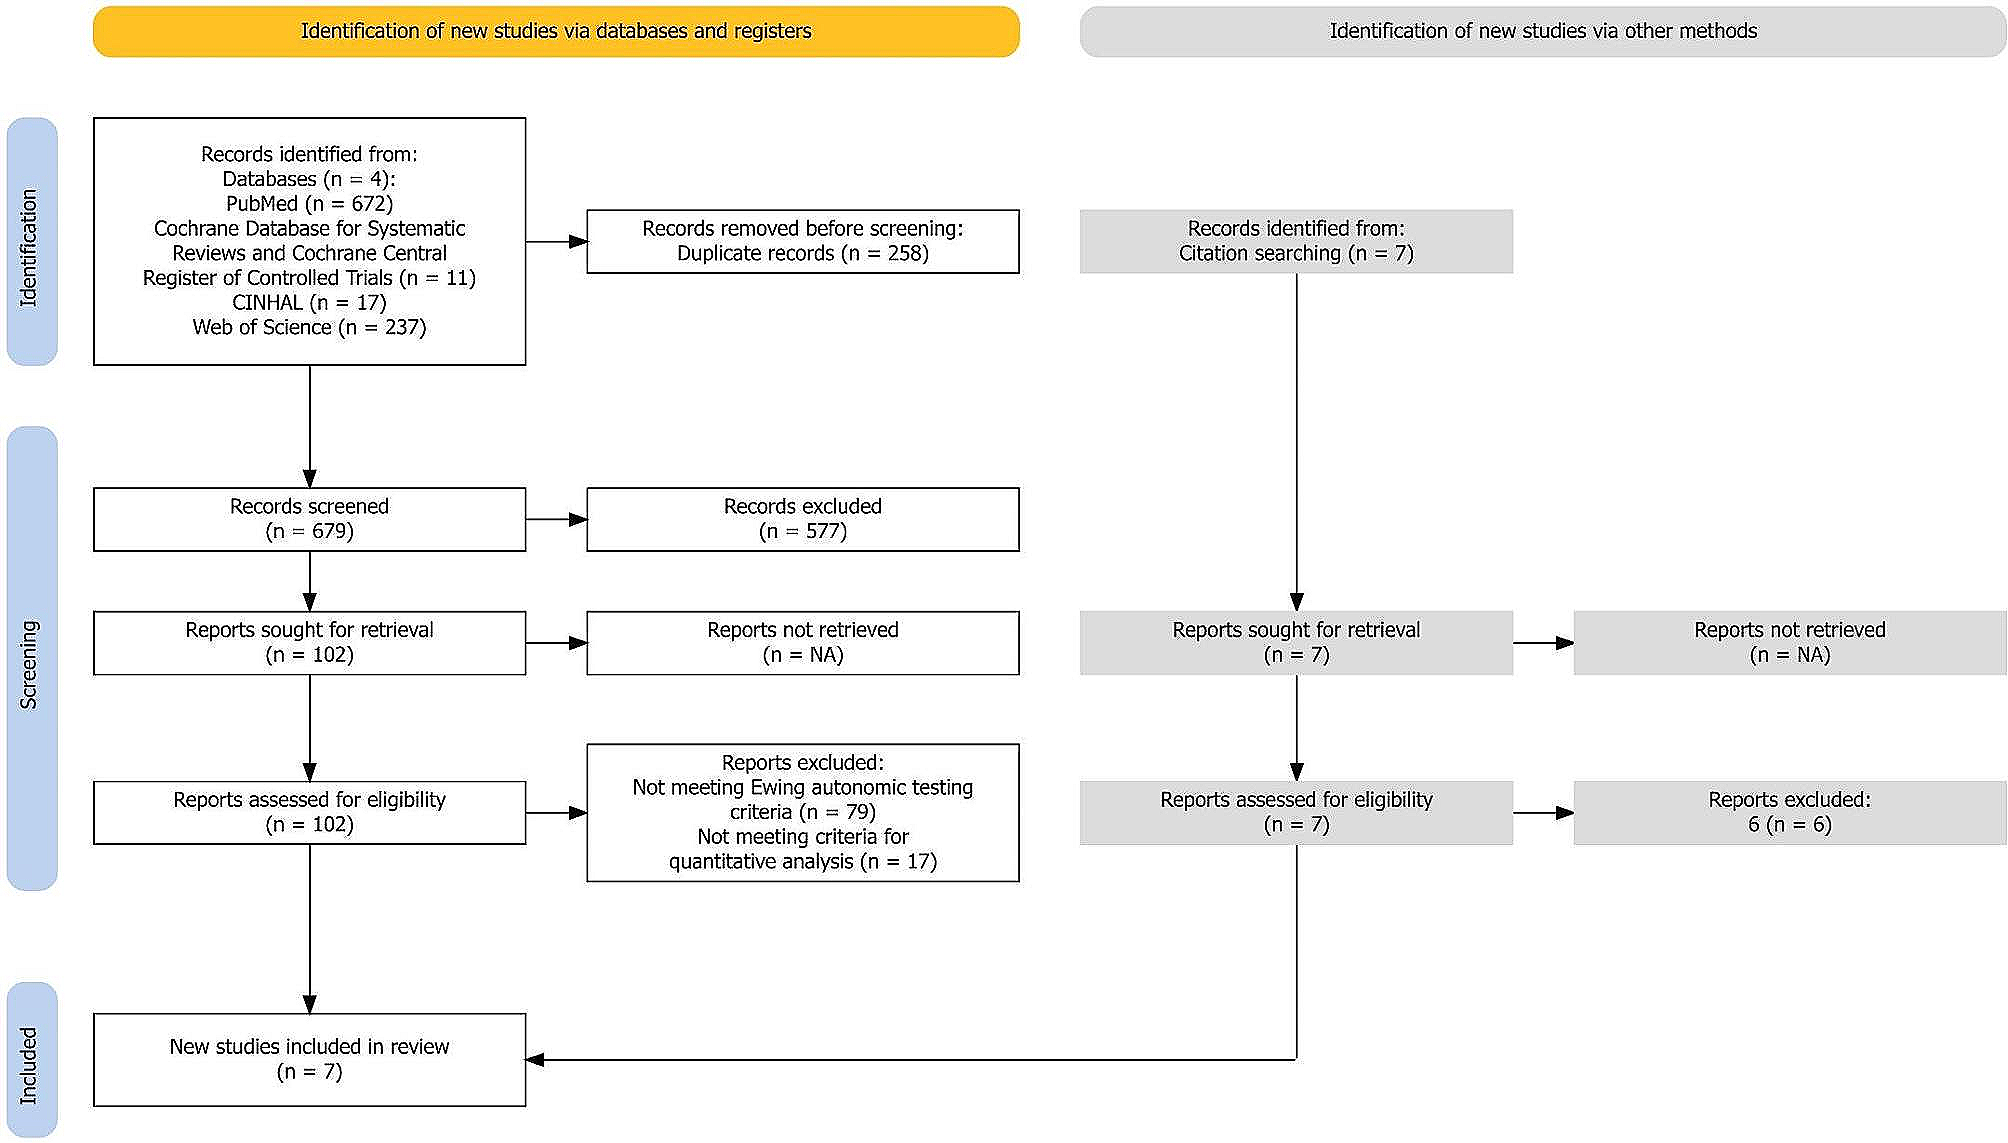
Totally, 349 patients initially diagnosed with CH were invited to enroll in the study, and 341 patients agreed to participate. After a review of the patients’ information by two headache experts, 14 patients were excluded (Fig. 1). Finally, 327 patients were included in the study, of whom 318 were diagnosed with episodic CH and 9 were diagnosed with chronic CH. The study population consisted of 269 men and 58 women (a male-to-female [M:F] ratio of 4.6:1), with a median duration of 10 (interquartile range, 5.0–15.0) years (Table 1).
Fig. 1
Flow chart of patient enrollment
Table 1 Demographics and characteristics of patients with cluster headache, according to pre-attack and pre-episode symptoms Clinical characteristicsThe duration of cluster attacks were 1–2 months in 50.2% of patients, 2 weeks to less than 1 month in 23.5%, more than 2 months in 13.1% and less than 2 weeks in 10.4%. For the cluster episode, 41.6% of patients had less than one per year, and the others had one (37.0%) or more than one (21.4%). In our cohort, 44.0% of patients had a positive history of tobacco exposure, and 33.3% of the surveyed patients stated they drank alcohol (Table 1).
Pre-attack symptomsOverall, 269 (82.3%) patients had PAS. Comparison of the demographic characteristics of patients with and without PAS revealed that more people with PAS smoked (p = 0.037). In comparing headache characteristics between patients with PAS and those without PAS, a higher number of headache locations (2.0 vs. 3.0; p = 0.009), higher visual analog scale rating (8.5 vs. 9.0; p = 0.025) were observed in patients with PAS. There were no significant differences between groups in terms of age, sex, drinking history, diagnosis, family history of CH, coexisting other types, disease duration, duration of episode or frequency of episode.
Among patients with PAS, 29.4% of them reported experiencing one PAS, 13.4% of them reported experiencing two PAS, and 14.1% reported experiencing three PAS; the remaining 43.1% reported experiencing more than three symptoms (Fig. 2). The most common PAS was head and facial discomfort (74.4%), followed by neck stiffness (32.3%), anxiety and upset (30.1%), and was unwillingness to talk (29.4%). Other PAS were phonophobia (20.8%), yawning (19.3%), irritability (19.3%), photophobia (17.5%), drowsiness (14.9%), fatigue (14.5%), and changes in concentration (14.1%) (Fig. 2). The prevalence of subtypes was as follows: local discomfort symptoms, 82.5%; general symptoms, 65.8%; and CAS, 9.3%. With regard to the timing of PAS before headache, most patients had an interval of ≤ 10 min (149 cases, 55%), followed by 10–30 min (93 cases, 35%), > 60 min (15 cases, 6%), and 30–60 min (12 cases, 4%) (Fig. 3).
Fig. 2
The left shows the number of patients with pre-attack symptoms; the middle shows patients experiencing different numbers of pre-attack symptoms simultaneously; the right shows the number of patients experiencing different pre-episode symptoms
Fig. 3
Durations of pre-attack and pre-episode symptoms before headache
The factor associated with the presence of PAS in the univariable and multivariable logistic regression analyses was the number of triggers (OR = 1.798, 95% CI = 1.264–2.558, p = 0.001), and smoking history (OR = 2.067, 95% CI = 1.089–3.924, p = 0.026) (Table 2; Fig. 4).
Table 2 Univariable and multivariable logistic regression analyses to assess factors associated with PAS Fig. 4
Multivariable logistic regression analyses to assess factors associated with PAS and PES
To observe the distribution of smokers and non-smokers in the different types of PAS, we counted the number and percentage of smokers/non-smokers for each type of PAS in Table 3.
Table 3 The number and percentage of smokers/non-smokers for each type of PASWe performed a linear fit, and the figure shows that the number of triggers and the number of PAS are highly correlated (Fig. 5).
Fig. 5
The left shows the correlation of number of triggers to number of PAS; the right shows the correlation of number of triggers to number of PES
Pre-episode symptomsIn total, 68 patients (68/327, 20.8%) had PES. Among them, symptoms occurred ≤ 3 days before the cluster episode in 22 patients (32%), 3–7 days before in 29 patients (43%), 7–14 days before in 4 patients (6%), and > 14 days before in 13 patients (19%) (Fig. 3).
The most common symptoms were head and facial discomfort (23 cases, 33.8%), followed by anxiety and upset (15 cases, 22.1%), sleep issues (14 cases, 20.6%), and fatigue/mild headache (non-CH) (11 cases, 16.2%), neck discomfort (9 cases, 13.2%), irritability/drowsiness (6 cases, 8.8%), phonophobia (4 cases, 5.9%), nasal congestion/osmophobia/hoarseness/photophobia/palpitation/warm palms (3 cases, 4.4%), premonition of attacks/dizziness/frustration/sensation of cold/ear swelling (2 cases, 2.9%), shadow attacks (defined as a cluster-like episodes of milder pain and shorter duration/toothache/hyperesthesia/diuresis/redness of the eyes/food cravings/overactivity/constipation; 1 case, 1.5%) (Fig. 2).
One factor was associated with the presence of PES in univariable and multivariable logistic regression analyses: the number of triggers (OR = 1.372, 95% CI = 1.100–1.712, p = 0.005). There were no significant differences in demographic or disease-related information or headache characteristics between the groups (Table 4; Fig. 4).
Table 4 Univariable and multivariable logistic regression analyses to assess factors associated with PESThe linear fit was performed to verify whether there was a correlation between the number of triggers and the number of PES. The results showed that the number of triggers was well correlated with the number of PES (Fig. 5).
留言 (0)