
記住我
BaF3 is an IL3 dependent, murine, pro-B cell line that has been used extensively in the study of leukemogenesis and is a well-known assay for evaluating the ability of genes to transform BaF3 cells into IL3 independence as an indication of oncogenic potential [26]. Using the tnFGFR1 construct created in the MIG retroviral vector (Fig. 1A), we noted that BaF3 cells cannot be acutely transformed to IL3 independence in this short-term survival assay. In contrast, the parental BCR-FGFR1 chimeric kinase and a mutant form of the gene in which the granzyme-B (GZMB) recognition site was mutated (BCR-FGFR1m) such that tnFGFR1 cannot be generated (Fig. 1A) successfully transformed BaF3 cells to IL3 independence, demonstrating that BCR-FGFR1m is as effective an oncogene as the parental gene in this assay (Fig. 1B). To investigate the effect of tnFGFR1 on primary cells, BM cells were transduced with retroviruses expressing either BCR-FGFR1/GFP, BCR-FGFR1m /GFP, tnFGFR1/GFP or GFP alone. GFP-positive cells were then flow sorted and cultured in vitro. Cells transduced with both BCR-FGFR1 and BCR-FGFR1m showed rapid cell proliferation at the two higher initial concentrations, while cells transduced with the tnFGFR1 construct did not show any evidence of growth or survival (Fig. 1C). Thus, from these transformation assays it does not appear that tnFGFR1 is acutely oncogenic in this short-term assay.
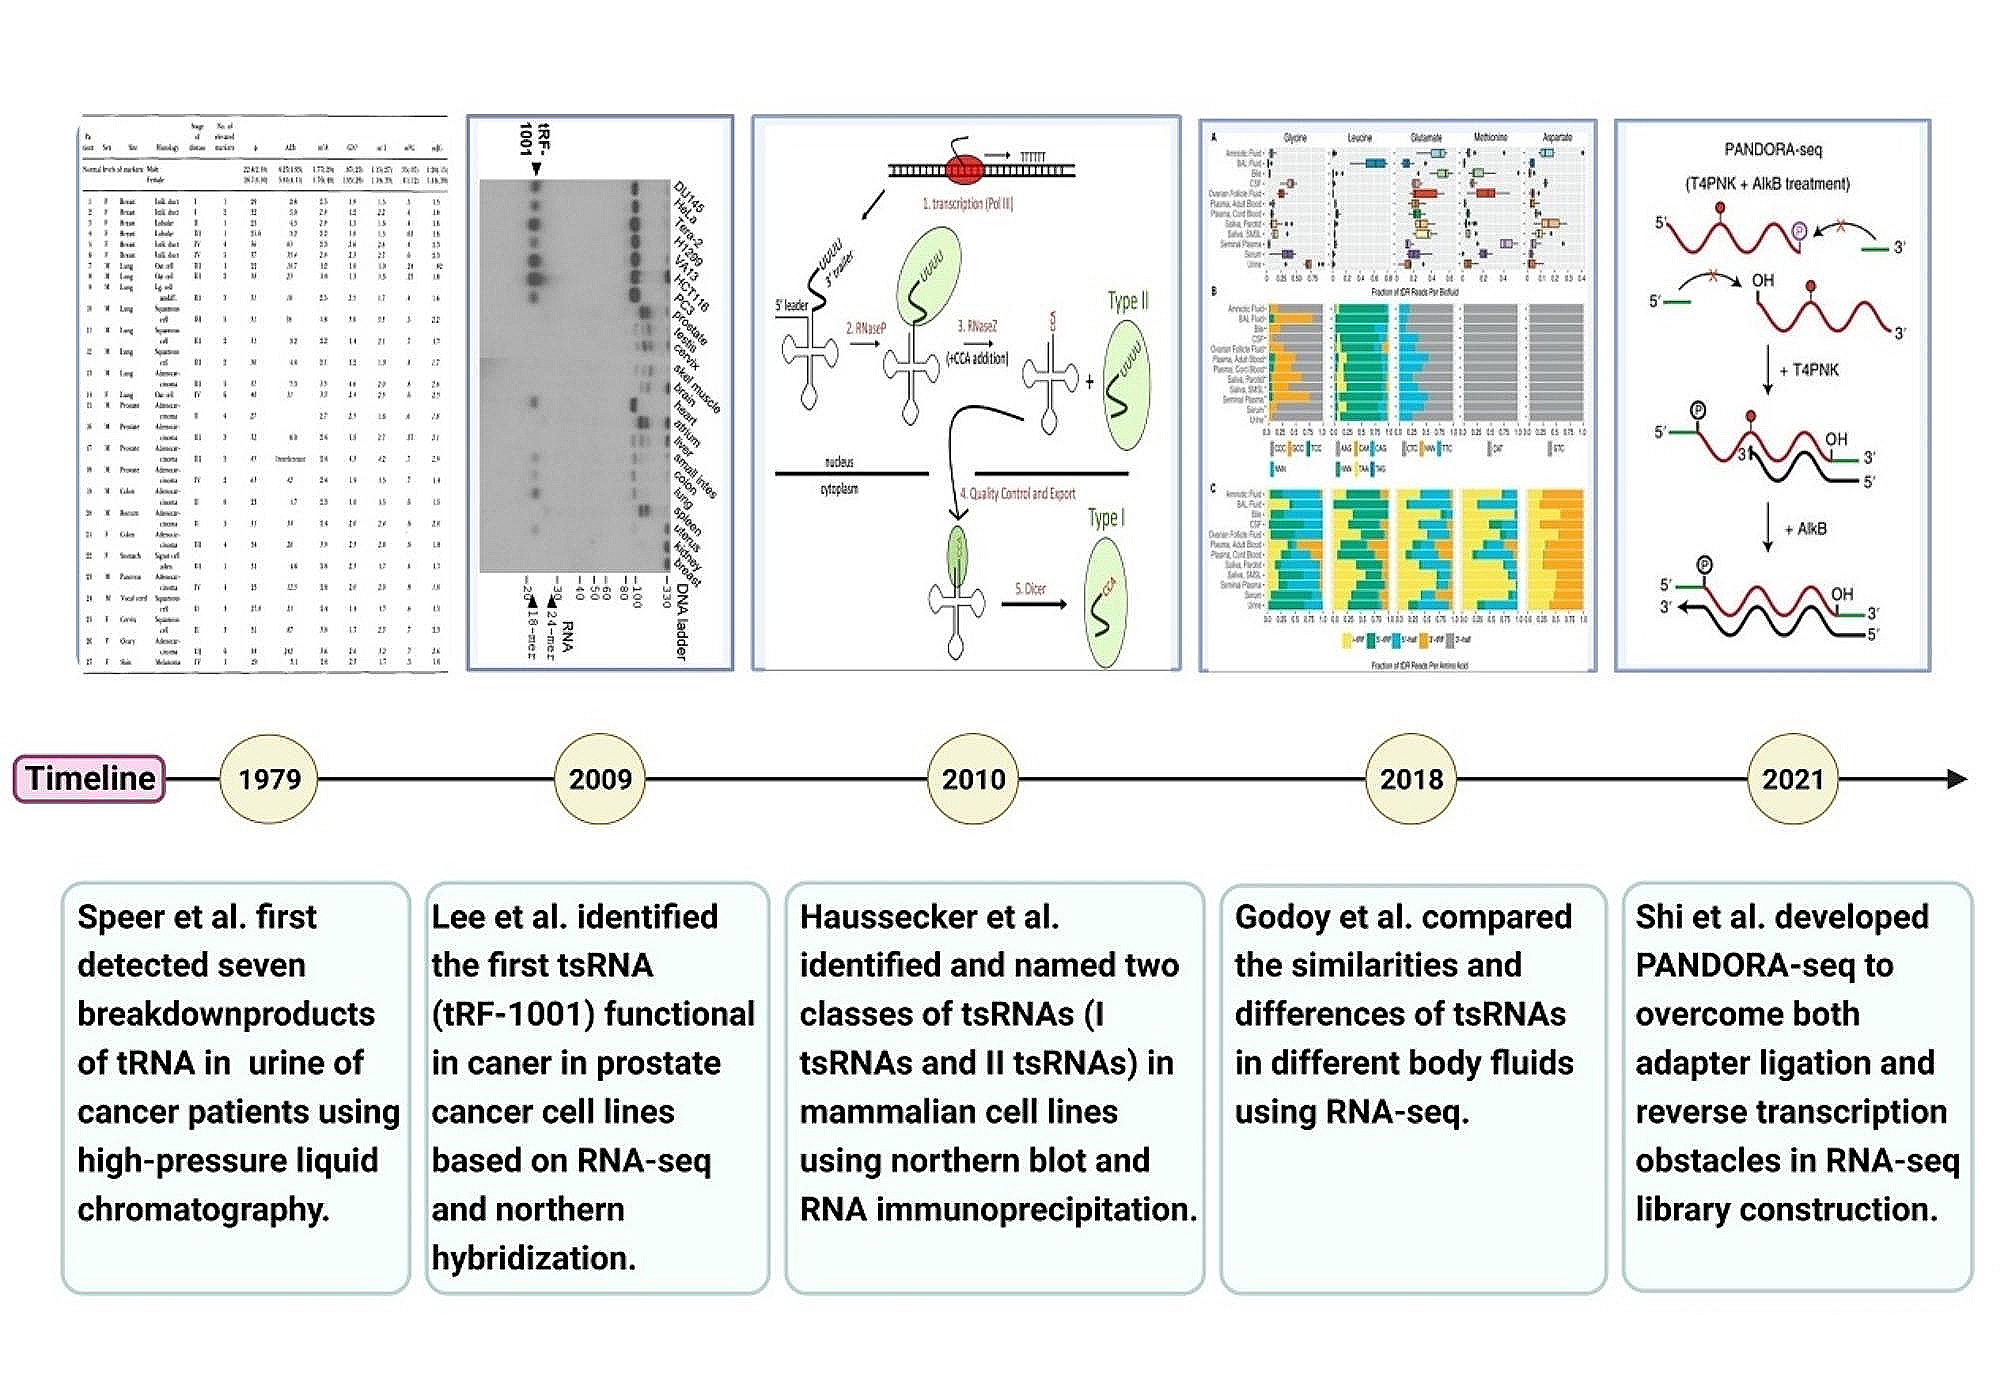
Fig. 1
Assessment of the oncogenic transformation ability of tnFGFR1. Schematic of the retroviral constructs used in transformation assays indicating the location of the mutation in the granzyme-B recognition sequence and truncation of the BCR chimeric kinase (A). Acute transformation potential of these three constructs is shown in (B) where the BCR-FGFR1 kinase and its mutant derivative (N = 3) can competently transform BaF3 cells to IL3 independence compared with the tnFGFR1 construct and the empty vector, which cannot. In a plating assay using normal murine BM cells transduced with the different constructs (N = 3), tnFGFR1 failed to promote proliferation of BM cells, compared with the BCR-FGFR1 and BCR-FGFR1m constructs (C). Kaplan-Meier survival curves for cohorts of mice (N = 5) receiving transplants of stem cells transduced with either the BCR-FGFR1 chimeric gene or its mutant form, compared with stem cells transduced with either the empty vector or the tnFGFR1 construct (D). In two independent experiments, while both the BCR-FGFR1 construct and its mutant derivative results in rapid onset (30–50 days) of leukemia, the cells transduced with the empty vector do not develop disease. Cells transduced with tnFGFR1 develop disease but with a significantly extended latency period (150–160 days). When the cells from the primary experiment were transplanted into secondary hosts, while the latency period was significantly reduced, the relative latency period between the full-length kinases and tnFGFR1 is maintained (D). Scatter plots for individual mice (N = 5) in the four subgroups (E) demonstrates that leukemia development is associated with increased liver and spleen weight as well as WBC count compared with the MIG control. The two spleens that showed low overall weight were derived from the mice that died early in the experiment probably because of high involvement of the BM before significant mobilization of leukemic stem cells to the peripheral circulation. Analysis of blood smears from xenografted mice transfected with each of the constructs supports the leukemia diagnosis (F). ns = not significant. *p ≤ 0.05, **p ≤ 0.01, ***p ≤ 0.001
tnFGFR1 can transform mouse hematopoietic stem cells independently in vivoThe prevailing hypothesis for chimeric kinase transformation of stem cells is that, through its dimerization, the FGFR1 kinase domain becomes phosphoactivated which, in turn, leads to activation of downstream oncogenic signaling pathways [5,6,7, 19, 20, 27]. Since tnFGFR1 does not have the dimerization motif present in the chimeric kinases, and is not phosphorylated [17], the question arose whether it could act independently as an oncogene to transform primary hematopoietic stem cells in vivo in the longer term. To investigate this potential, therefore, we used the in vivo bone marrow transduction and transplantation assay described previously [19]. Using retroviral constructs, murine hematopoietic stem cells were transduced ex vivo and transplanted into lethally irradiated syngeneic BALB/C hosts. Both the BCR-FGFR1 and BCR-FGFR1m transduced cells led to a typically [28] rapid (< 21 days) onset of leukemogenesis (Fig. 1D). In contrast to the BaF3 assay results, however, tnFGFR1 transduced cells also developed leukemia, but only after a relatively long (~ 150 days) latency period (Fig. 1D). These experiments were performed on two occasions with the same result. When the tnFGFR1 transformed cells were transplanted into secondary hosts, the latency period for disease development, although shorter (~ 40 days) than that seen in the primary transplant, was again relatively long compared with the full length and mutant chimeric kinases (Fig. 1D). The in vivo leukemogenesis analysis was supported by the increased spleen and liver weights as well as the white blood cell count at the time of sacrifice in the primary transplanted mice after transduction with the various constructs (Fig. 1E). Compared to the wild-type BCR-FGFR1 and BCR-FGFR1m, the WBC levels in tnFGFR1 leukemic mice show a moderate increase, suggesting less mobilization of leukemia cells from the bone marrow into the peripheral circulation. The increased WBC count was also supported by Wright-Giemsa staining of blood smears from these mice (Fig. 1F). In addition, H&E staining of spleen tissue sections also confirmed high levels of transformed leukemia cells in these mice (Supplement Figure 1).
tnFGFR1 transformed stem cells have a biphenotypic immunophenotypeTransduced bone marrow cells co-express GFP from the MIG transduction vector [19], allowing specific isolation and analysis of transduced cells. Since the MIG transfected cells do not transform, the samples from these recipient mice are GFP-negative and so represent those seen in normal mice. Flow cytometric analysis showed that the GFP+ leukemic cells derived from the bone marrow of the tnFGFR1 transduced mice were mostly negative for the T-cell and myeloid lineage markers analyzed (Mac1, Gr1, CD4, CD8,) but showed the same high-level B220+ B-cell phenotype seen in the BCR-FGFR1 transformed cells (Fig. 2). Importantly, the tnFGFR1 transformed cells also showed a predominant KIT+ immunophenotype with a small Sca1+ subpopulation, suggesting a relatively pure population of cells with a stem cell immunophenotype (Fig. 2). In contrast, cells transformed with either the parental full-length kinase or the BCR-FGFR1m kinase predominantly showed the previously reported B220 + IgM- immunophenotype [28] with small subpopulations that express Kit and/or Sca1. Analysis of the spleen cell from the same strains showed identical immunophenotypes (Supplement Figure 2). It appears, therefore, that tnFGFR1 can promote expansion of leukemia stem cells with a B-cell/stem cell immunophenotype, which is not typically seen for the various chimeric kinases.
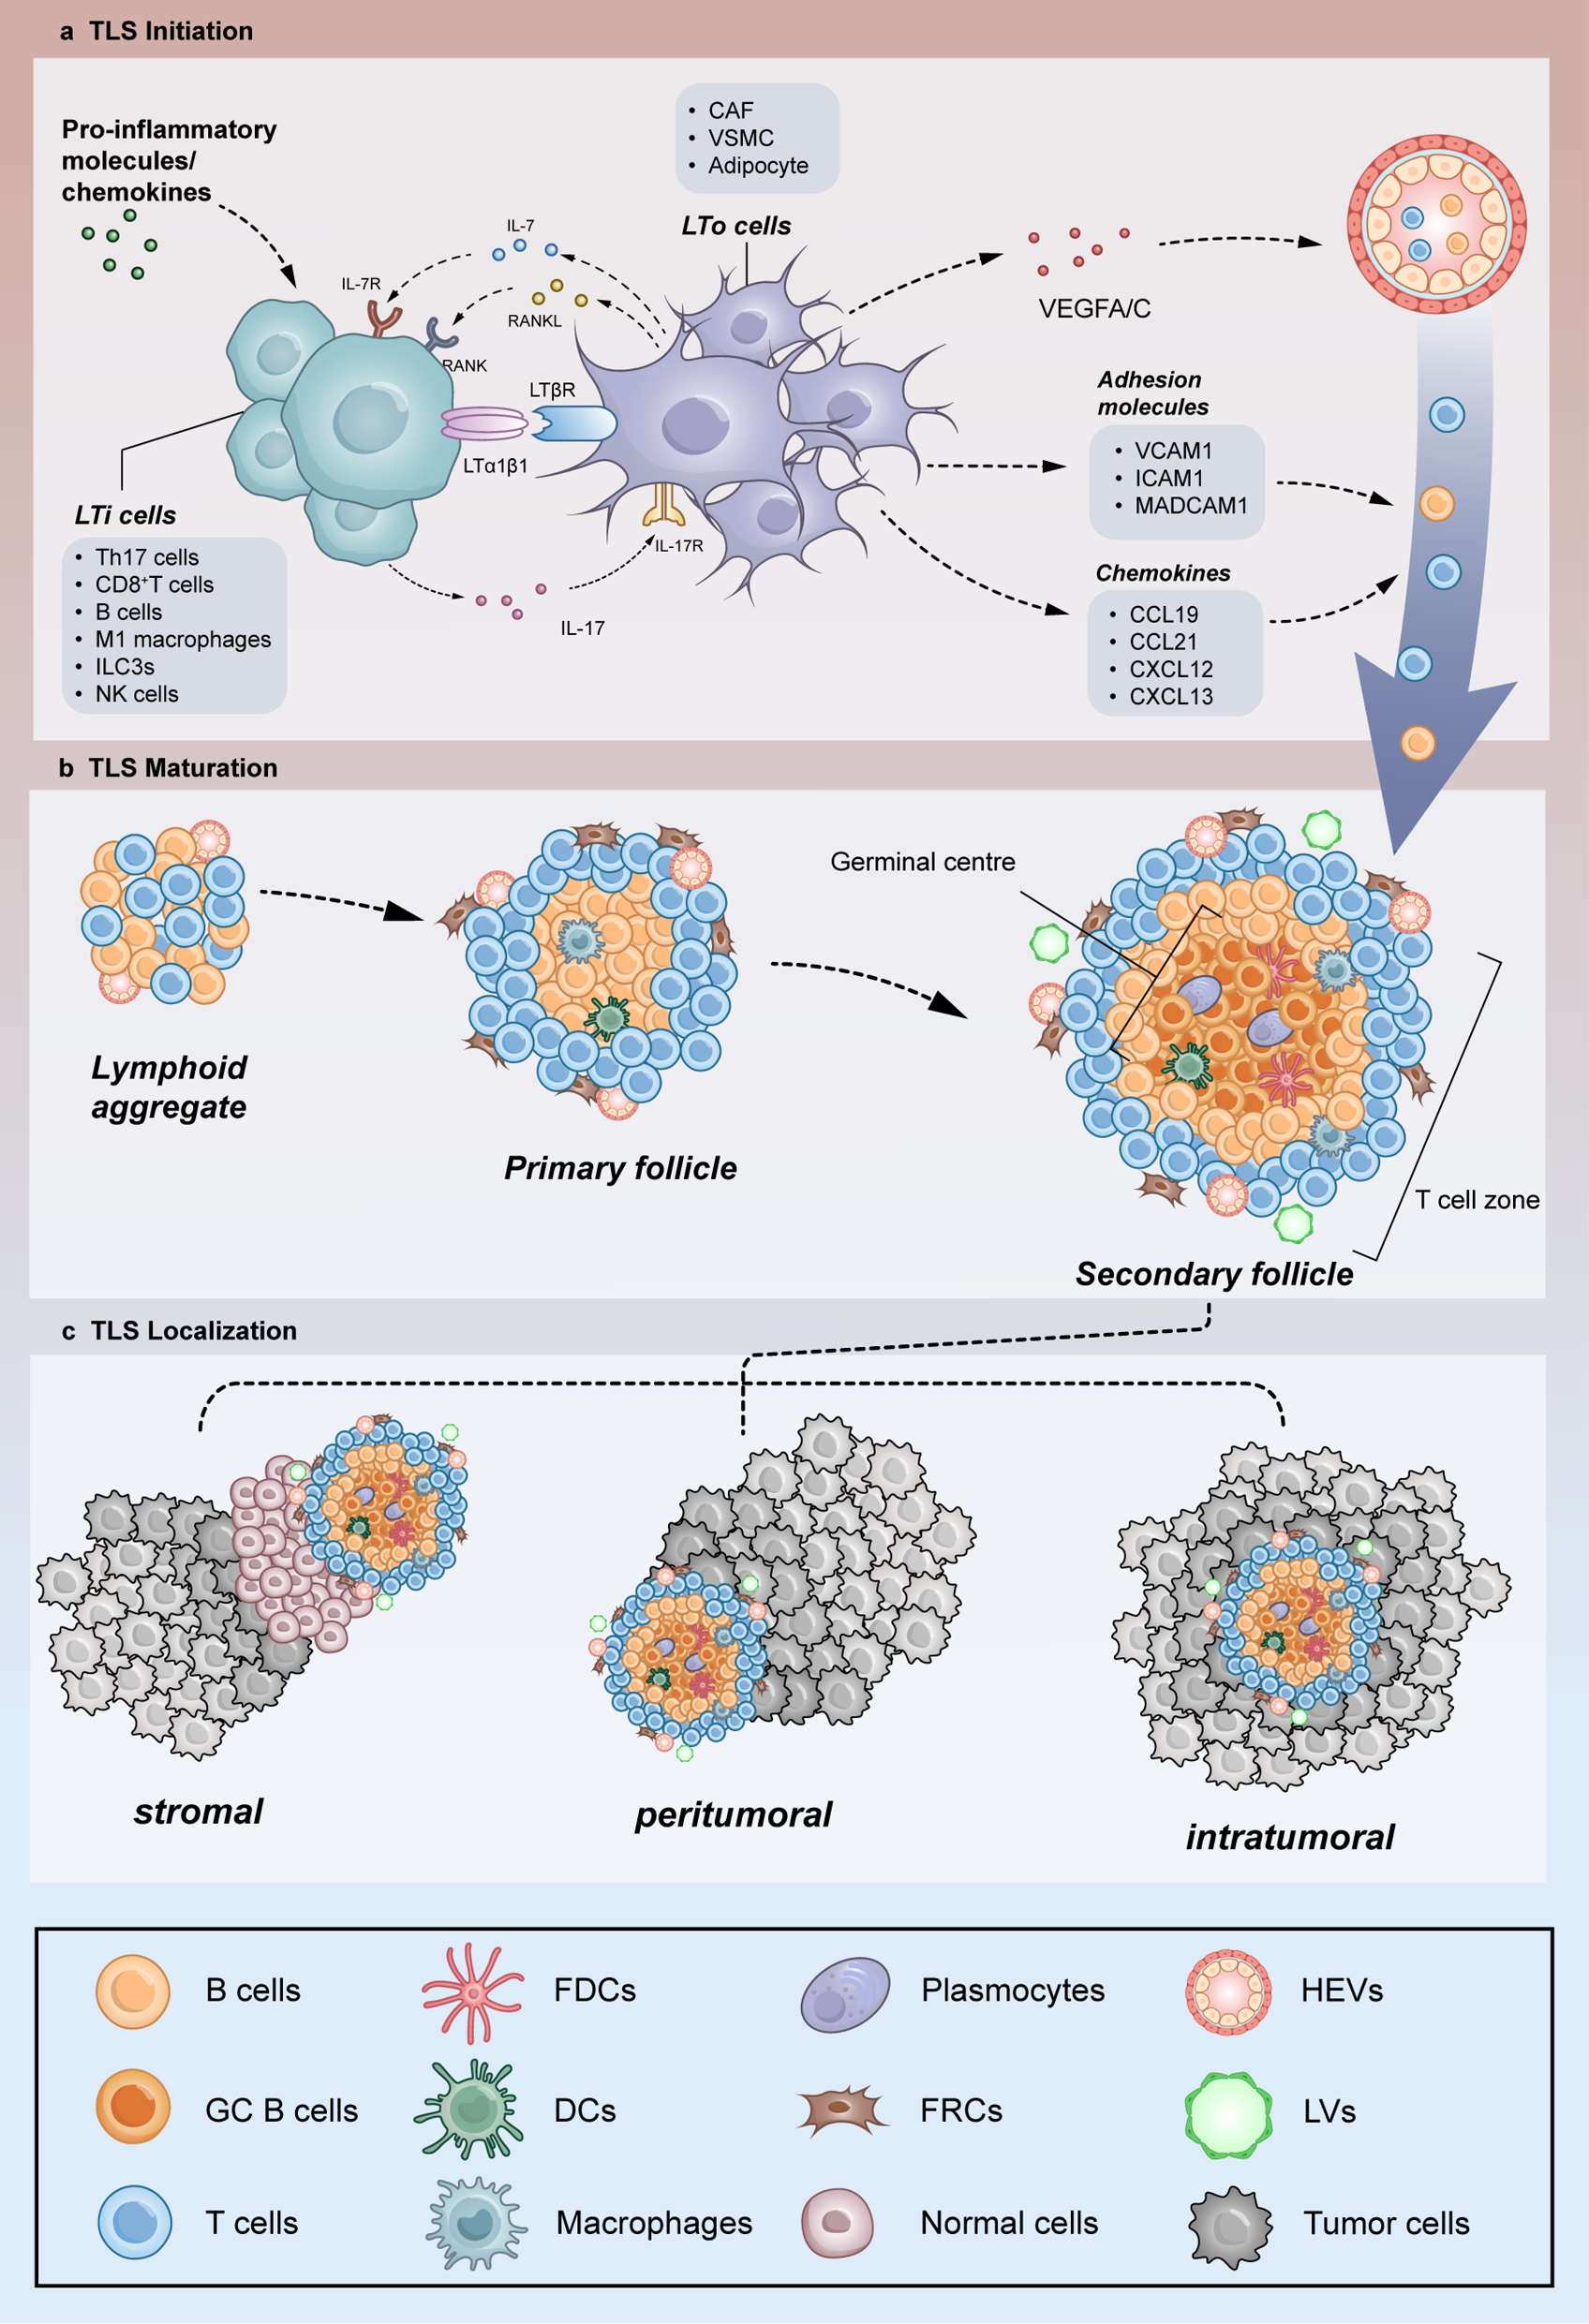
Fig. 2
tnFGFR1 promotes leukemia development with a stem cell immunophenotype. Representative flow cytometric profiles of the bone marrow cells from the mice transplanted with various derivative constructs of the BCR-FGFR1 kinase (A) at the time of sacrifice show extensive GFP-positive cells in all cases, demonstrating leukemic development compared with the MIG control which are GFP-negative (normal) cells. Analysis of cell lineage-specific markers demonstrates low levels (< 10%) of T-cell (CD8/CD4) and myeloid (Mac1/Gr1) markers but high-level presence of the B220 B-cell marker in cells transduced with the full length chimeric kinases as well as the tnFGFR1 transduced cells. Analysis of stem cell markers KIT and SCA1, however, indicate that while the BCR-FGFR1 kinases and its mutant derivative are mostly negative, the cells from the tnFGFR1 transduced mice predominantly express KIT with a small subgroup also expressing SCA1. Quantitative scatter plots for each marker in each individual mouse within the subgroups (N = 5) compared with the MIG transfected control cells are shown in (B). ns = not significant. *p ≤ 0.05, **p ≤ 0.01, ***p ≤ 0.001, ****p ≤ 0.0001.. These values represent pairwise comparison between individual oncogenic chimeric kinases and the normal MIG group in each case
The extended latency of leukemia progression and stem cell like immunophenotype in the tnFGFR1 primary leukemia model suggested a potential direct role of tnFGFR1 in promotion and maintenance of the leukemia stem cell population. When the expression of tnFGFR1 was examined in bone marrow cells following serial transplantation of leukemias driven by BCR-FGFR1 (Fig. 3A) and ZMYM2-FGFR1 (Fig. 3B), the primary leukemia cells showed a predominant expression of the full-length kinase, with relatively low levels of tnFGFR1. In contrast, the leukemia cells from the 6th generation of transplantation expressed much higher tnFGFR1 levels, with a relatively reduced expression of the full-length FGFR1 fusion kinases, indicating an enrichment of the tnFGFR1 expressing leukemia stem cells during the progressive transplantations.
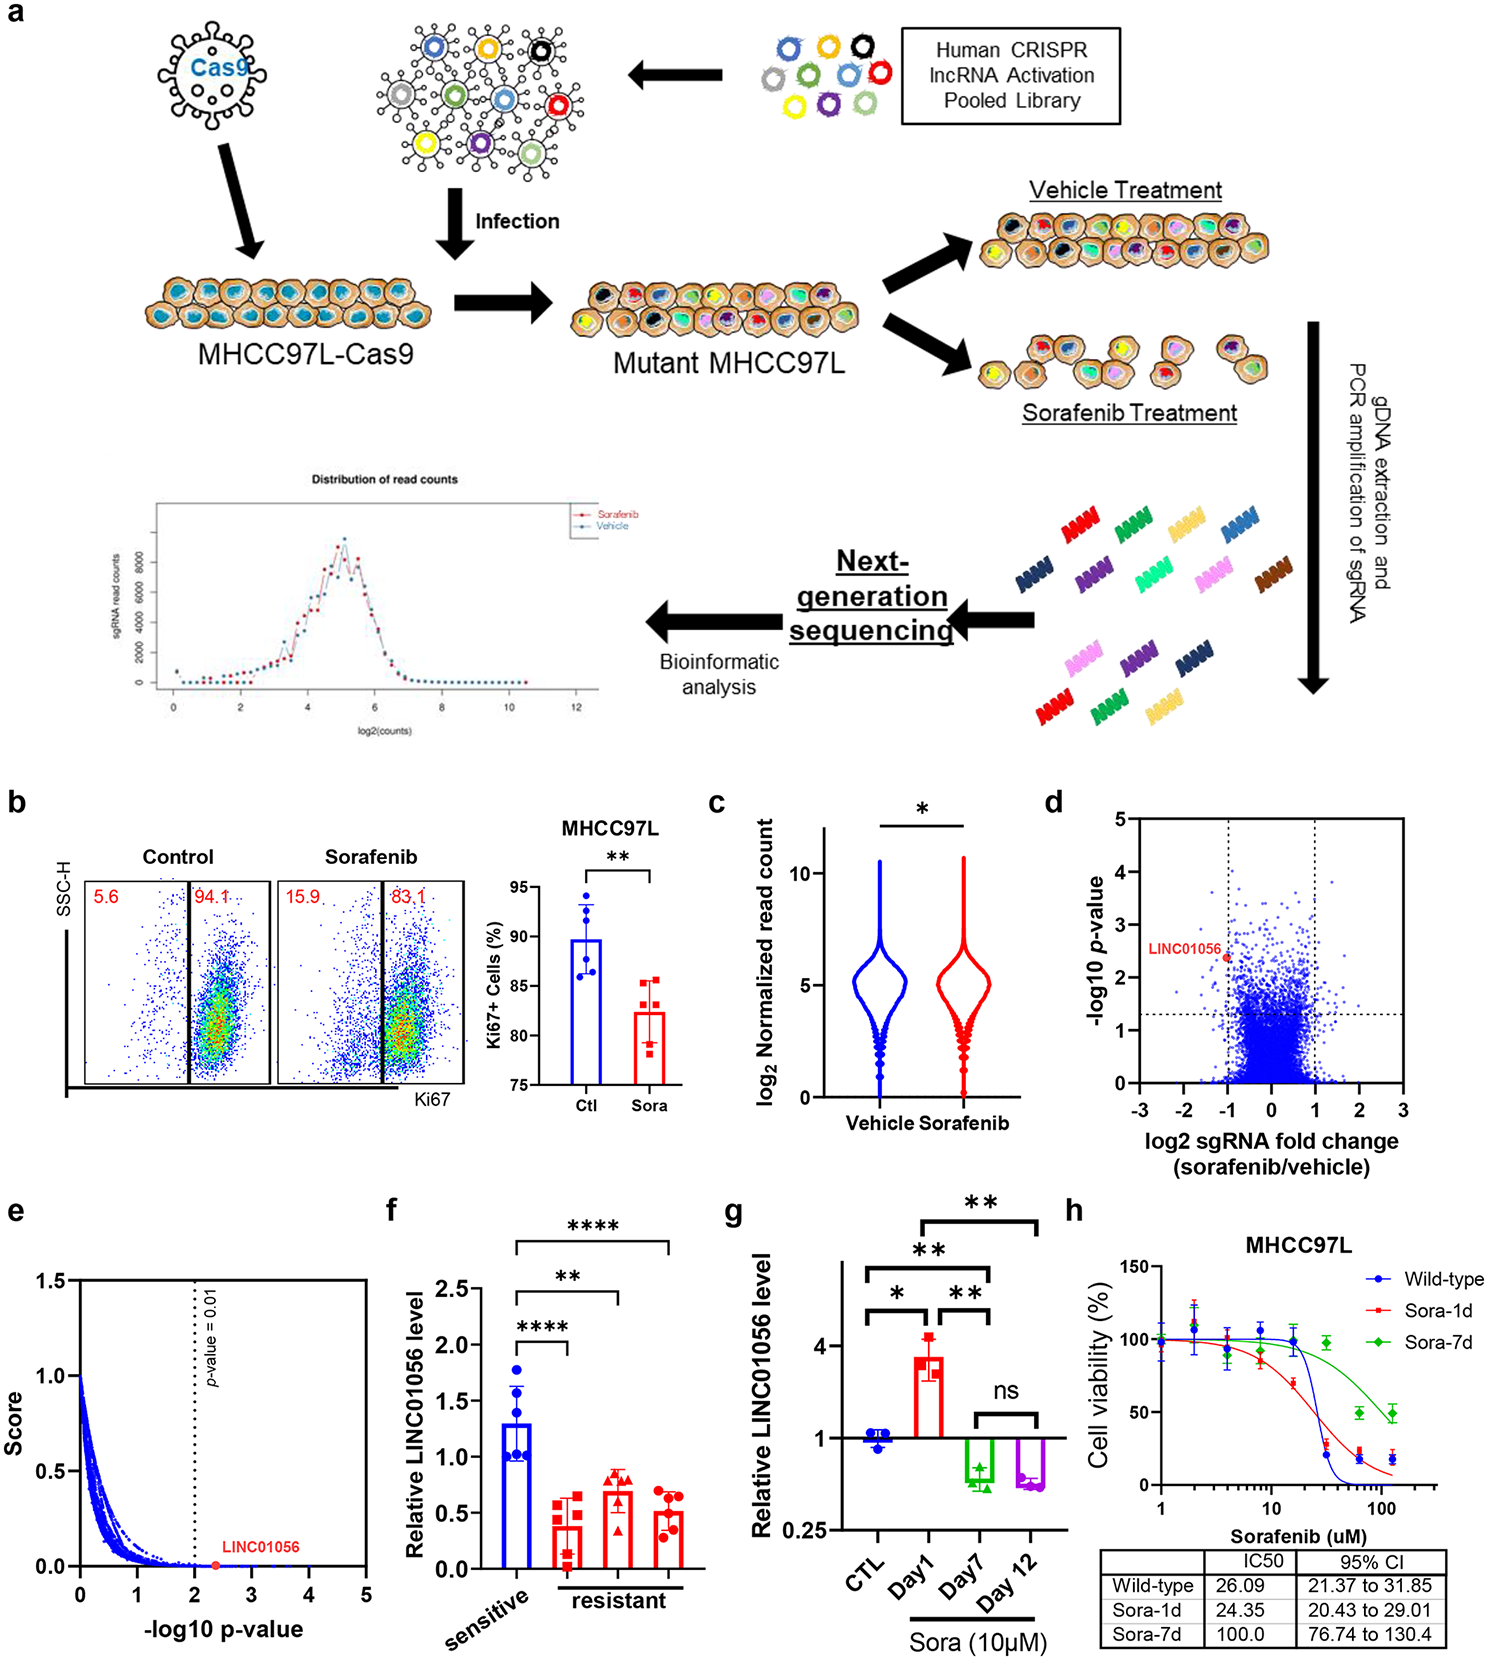
Fig. 3
tnFGFR1 is expressed widely in primary leukemia cells from mouse models and AML patients and is produced by GZMB cleavage of the full-length FGFR1. Western blot analysis of mice (N = 3) with primary transduced cells shows the full length kinase is expressed at high levels relative to the truncated tnFGFR1 in both BCR-FGFR1 (A) and ZMYM2-FGFR1 (B) murine leukemic cells. After serial transplantation of these cells from the primary mice through 6 cycles, the serially transplanted leukemia cells consistently demonstrate dominant expression of the tnFGFR1 derivative. In these cohorts there is increased expression of GzmB that is proportional to the increase in tnFGFR1 levels. Analysis of 29 primary AML bone marrow samples and 4 patient-derived xenograft (PDX) samples from immune compromised mice (C) demonstrates the presence of the full length FGFR1 kinase in specific cases, most of which also show the presence of the truncated kinase. In several other cases, there is predominant expression of the truncated kinase. For AML#10 and AML9276, the second transplant shows increased levels of FGFR1 proteins as seen in the syngeneic transplants, with AML9276 showing preferable enrichment of tnFGFR1. BaF3 cells transformed with the full length kinase (BCR-FGFR1) are used as molecular size controls. qRT-PCR analysis using primers targeting sequences in the proximal region of FGFR1 (P1), across the granzyme B cleavage site (P2) and within the tnFGFR1 derivative (P3) in a subset of nine of the most representative human AML samples (D) shows no significant difference in the relative copy number of different regions of FGFR1 mRNA between the tnFGFR1 exclusive samples and samples expressing both the full-length and truncated FGFR1 proteins. Sanger sequencing across the granzyme B cleavage site (E) from three AML that show high levels of tnFGFR1 protein show no alternative splicing around the GZMB site. qRT-PCR analysis of GZMB mRNA levels in the same samples (F) shows that higher levels of tnFGFR1 protein is correlated with high levels of GZMB expression. Mutation of the GZMB recognition site prevents tnFGFR1 production in BaF3 cells transformed with BCR-FGFR1m, compared with its parental BCR-FGFR1 transformed cells (G). Longer exposure times (L-expo) reveals tnFGFR1 in the cells transduced with BCR-FGFR1 but not BCR-FGFR1m. When mouse BBC2 and human KG1 SCLL cell lines are treated with GZMB Inhibitor II, quantitation of the protein levels normalized to actin levels (ACTB) shows the production of tnFGFR1 is decreased accordingly with increased inhibitor concentration (H). ns = not significant. *p ≤ 0.05
tnFGFR1 is frequently generated in human AML cellsWhile FGFR1 chimeric kinases are specifically associated with SCLL, our previous studies in primary human AML demonstrated increased expression of FGFR1 in up to 20% of de novo human AML samples [10]. To evaluate the presence of tnFGFR1 in human AML, we surveyed its expression levels in 38 archival primary AML bone marrow samples and 4 patient-derived xenograft (PDX) samples (Fig. 3C, Supplement Figure 3A) that were previously established in immunocompromised mice [10]. As suggested from our previous observations [10], 9.52% of these primary human samples (4/42; AML11463, AML17358, AML10705 and AML11353) as well as cells from four PDX models AML#10 1st, AML#10 2nd, AML9276 1st and AML9276 2nd expressed a full length FGFR1 kinase. Consistent with the observation in the mouse models, all of these samples also expressed the truncated tnFGFR1. Surprisingly, an additional 15 samples (35.71%; AML10967, AML11481, AML12490, AML13486, AML1409, AML12531, AML#26, AML12735, AML#1, AML162258, AML169010, AML0396, AML0546, AML1049, AML#40) apparently only expressed tnFGFR1, albeit at variable levels, without the presence of detectable levels of the full length FGFR1 kinase (Fig. 3C, Supplement Figure 3A), Of note is that in the 4 AML PDX samples (AML#10 and AML9276), the bone marrow samples from the 2nd serial engraftment of AML9276 showed preferential increases in tnFGFR1 expression, similar to the observation in the serial transplantation in the mouse models, implying a potential role of tnFGFR1 in maintaining the AML stem cell phenotype.
The observation from western blotting (WB) analysis (Fig. 3C, Supplement Figure 3A) showed that in some cases the truncated FGFR1 protein was present apparently in the absence of the full-length protein, which raised the issue of whether this is due to the rapid turnover of the full length protein by GZMB cleavage or as a result of alternative splicing at the mRNA level. To investigate this issue, we performed qRT-PCR analysis of the RNA isolated from AML patient samples used for the WB in Fig. 3C for which high quality RNA was available. In this study we designed primers around exon 3 of FGFR1 (P1), across the granzyme B cleavage site (P2) and around exon 13 in a region retained in the tnFGFR1 variant. In the qPCR analysis, a 1:1:1 amplification ratio of all three primers would indicate the presence of a full length FGFR1 mRNA transcript. Alternatively, a 1:1:2 ratio would indicate the presence of two transcripts, one from a full length mRNA and one from a spliced tnFGFR1 transcript. As shown in Fig. 3D, the relative expression levels of P2 and P3 in the 9 samples analyzed were normalized to their respective levels of the P1 amplicon. When the levels of P2 and P3 amplicons were compared between samples which clearly expressed both full length and truncated proteins and those that apparently showed only the truncated protein, there was no significant difference in mRNA copy number for each of the internal sites of FGFR1, demonstrating that there is no independent short tnFGFR1 transcript. Furthermore, Sanger sequencing of the P2 mRNA products spanning the GZMB cleavage site from three samples where the full-length protein was not detected by WB, showed no alternative splicing around this region (Fig. 3E). Together, these results indicate that only the full-length FGFR1 mRNA is present in these samples (Fig. 3D and E).
tnFGFR1 is generated by GZMB cleavage of the full -length fusion kinaseWe previously demonstrated that tnFGFR1 in SCLL is generated through GZMB cleavage [17]. When GZMB expression levels were analyzed in samples from serial transplantation in vivo, the significantly higher levels of tnFGFR1 expression in the leukemia cells from the 6th transplantation were reflected in an increased GZMB expression level in the same cells (Fig. 3A and B), compared with the primary transplantation. These observations are consistent with the idea that tnFGFR1 levels increase proportionately with GZMB enzyme activity. Analysis of GZMB transcript levels using qRT-PCR (Fig. 3F) in this cohort showed significantly increased mRNA expression levels in all cases where only the tnFGFR1 protein was identified by WB compared with those where both protein isoforms were detected and further, the highest expression levels were shown in the two samples that showed highest levels of tnFGFR1 protein (AML12490 and AML12531). Overall, this analysis demonstrates that the truncated FGFR1 protein is not a result of alternative splicing at the mRNA level but at the level of protein cleavage and that the higher the GZMB levels the more prevalent the tnFGFR1 protein. Consistently, the serial PDX samples show unbiased enrichment of the full-length FGFR1 transcript (Supplement Figure 3B). AML9276, which displays a preferential increases in tnFGFR1 protein expression, with reduced full-length FGFR1 after serial transplantation, shows significantly higher upregulation of GZMB transcription (Supplement Figure 3B).
Using the BaF3 cell lines transduced with different variant constructs, we further confirmed that mutation in the GZMB recognition site prevented the production of tnFGFR1 (Fig. 3G). An exclusive expression of tnFGFR1 was observed in the cells transduced with this truncated derivative. With increased exposure, a clear signal from tnFGFR1 can be seen in the cells expressing BCR-FGFR1, but not in the BCR-FGFR1m derivative (Fig. 3G). To complement these observations, we also used GZMB inhibitor II (previously called Ac-IETD-CHO [29]) to pharmacologically inhibit its activity in SCLL cell lines BBC2 and KG1 (Fig. 3H), where there was a dose-dependent inhibition of the production of tnFGFR1, further confirming the role of GZMB in the generation of the truncated nuclear tnFGFR1 derivative in both human and mouse models.
tnFGFR1 does not appear to activate classic FGFR1 signaling intermediatesTo investigate changes in signaling pathways resulting from tnFGFR1 expression, we compared Reverse Phase Protein Array (RPPA) analysis [30] of BaF3 cells transduced with either the full length or mutant BCR-FGFR1 kinases with those transduced with either tnFGFR1 or the empty vector. This assay measures protein levels for a series of 304 protein targets implicated in cancer development. As shown in Fig. 4A, the parental BCR-FGFR1 and the BCR-FGFR1m variant displayed a similar expression profile reflecting classical FGFR1 signaling pathways, such as activated Stat3_pY705, SHP_pY542, Cyclin-D3, S6_pS235/236 and S6_pS240/244. In contrast, tnFGFR1-expressing cells did not show activation of any of these signaling intermediates. Instead, tnFGFR1 preferentially activated Pdcd4, MAPK_pT202_Y204, p90RSK_pT573, p38_PT180_Y182, GZMB and VEGFR-2. The differential activation of some of these pathways was further confirmed by western blot analysis (Fig. 4B). Of particular interest was the upregulation of GZMB in tnFGFR1 expressing cells compared with the other transduced cells, suggesting a possible positive feedback regulation between tnFGFR1 and GZMB (Fig. 4A and B), to promote the production of the tnFGFR1 derivative in these cells. The low level of GMZB in the full-length BCR-FGFR1 kinases correlates with high levels of the full length chimeric FGFR1 kinase and relative low expression of tnFGFR1 in these cells.
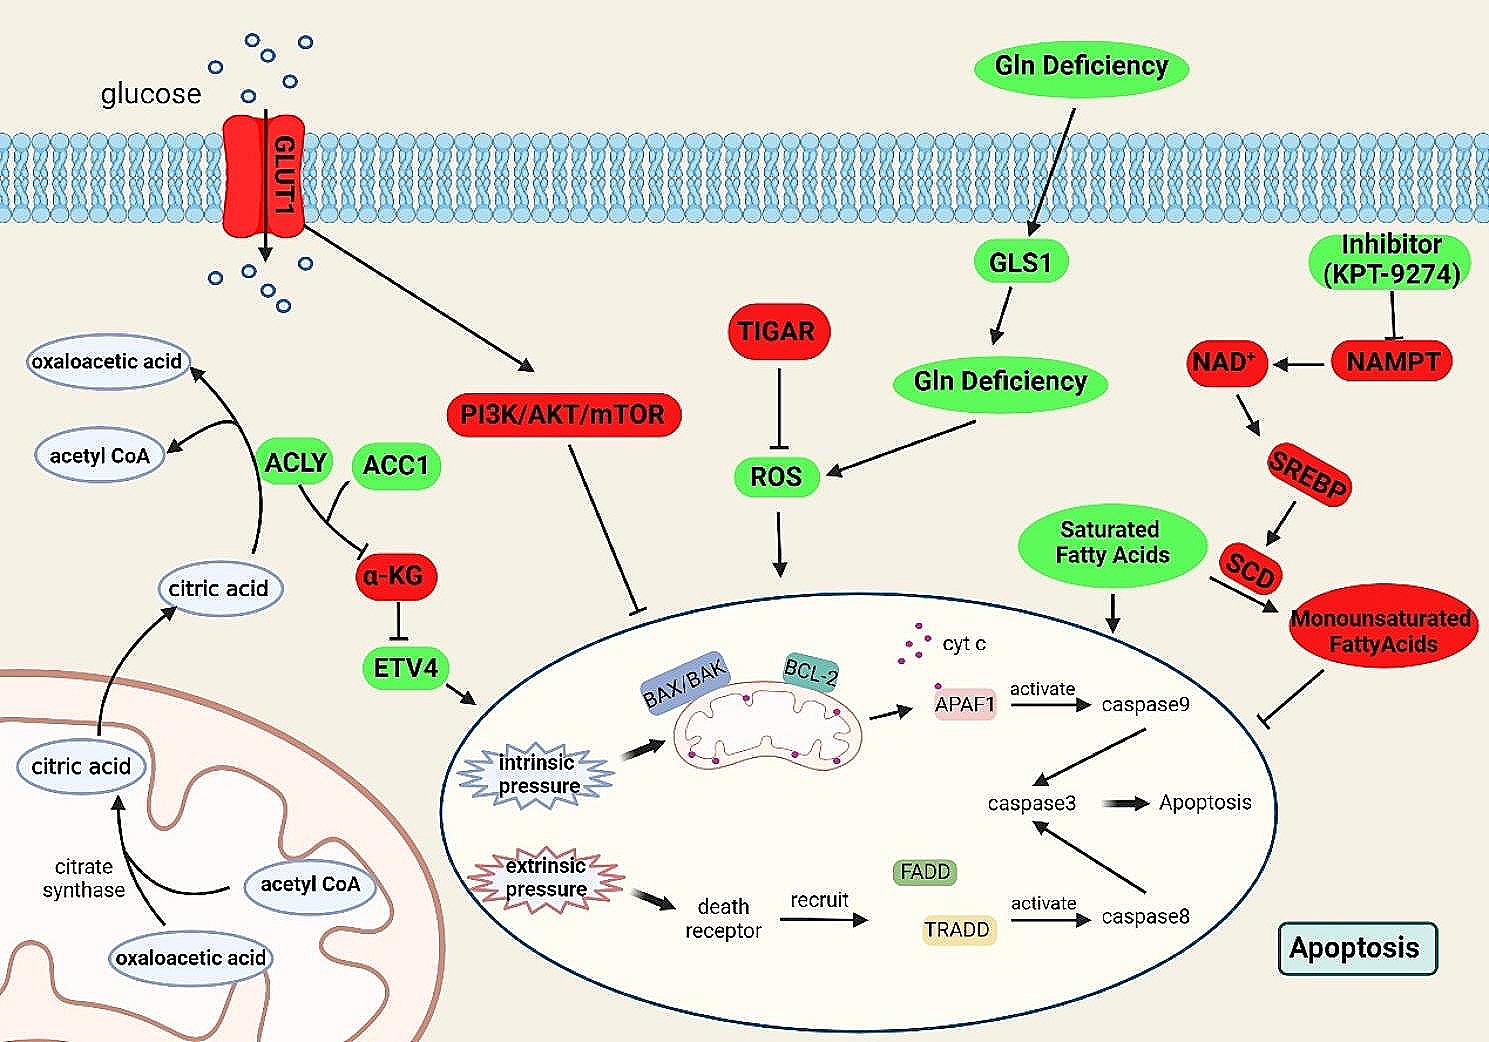
Fig. 4
The truncated tnFGFR1 shows a distinct profile of oncogenic signaling compared with the full length chimeric kinases. RPPA analysis of BaF3 cells transduced with either empty vector (MIG) or tnFGFR1 and maintained on IL3, or transformed with the BCR-FGFR1 chimeric kinase or its GZMB site mutated version (A). Selected preferentially activated pathways identified by RPPA are further validated by western blotting (B)
Identification of genes regulated by tnFGFR1 during leukemogenesisTo obtain a more detailed understanding of genes that might be specifically regulated by tnFGFR1 during leukemogenesis, we performed RNA-Seq analysis in a comparison between tnFGFR1 transformed primary leukemia cells and those transformed with the BCR-FGFR1m construct in which the truncated FGFR1 derivative is not generated. Genes activated in the tnFGFR1 transformed cells should be due to direct activation by the truncated kinase but the cytoplasmic activation events would not occur. Bone marrow cells from mice in which leukemogenesis was induced in hematopoietic stem cells were isolated from two different animals and RNA-Seq performed as described previously [8]. Data was processed using conventional approaches based on FPKM scores and the comparison generated a heat map of differentially expressed genes (Fig. 5A). The most significant GO functional groups identified using GSEA analysis included transmembrane signaling receptor activity, molecular transducer activity, actin binding and actin cytoskeleton (Fig. 5B). The rank order of genes upregulated as a result of tnFGFR1 expression is shown in Fig. 5C and their upregulation was confirmed by qPCR for the five (DNTT, IGF2BP3, SHISA2, MMRN1 and MUC13) most highly overexpressed genes (Fig. 5D). The three most under expressed genes in tnFGFR1 transformed cells (SYDE2, SLAMF9 and IKZF3) were also verified by qPCR (Fig. 5D). Similar qPCR verification was performed for genes in the GO-transmembrane signaling receptor activity and actin binding subgroup (Fig. 5D). Of note, the levels of expression changes in the genes showing under expression in all groups was significantly lower than those seen in the overexpressed genes, demonstrating a dominant role for tnFGFR1 in gene activation. When these gene expression profiles were compared with normal lineage negative Kit-expressing murine stem cells (Supplement Figure 4), there was a subgroup of genes exclusively expressed in the tnFGFR1 transformed cells and a different subgroup specifically expressed in the BCR-FGFR1m transformed cells. Analysis of the top ranked GO functional groups in these subpopulations of genes indicated that BCR-FGFR1m appears to specifically regulate cell proliferation and survival pathways, while the tnFGFR1 regulated subgroup of genes were specifically involved in maintaining an undifferentiated stem cell phenotype (Supplement Table 1).
Fig. 5
tnFGFR1 regulates a specific subset of genes during leukemogenesis. RNA-Seq analysis of leukemic cells from the bone marrow from mice transplanted with stem cells transduced with either tnFGFR1 or the mutant BCR-FGFR1m (n = 2) construct identifies specific patterns of expressed genes as shown in the heat map in (A). GSEA analysis (B) identifies significant enrichment for differential changes in pathways involved in receptor signaling, actin and cytoskeleton, and molecular transduction. The comparison in expression changes of genes in related pathways using qPCR is shown in (C) and qPCR verification (N = 3) of several of the most highly differentially expressed genes is shown in (D)
FLT3 and KIT are direct target genes regulated by tnFGFR1 during leukemogenesisSignificantly, Flt3 and Kit were among the highly upregulated genes in tnFGFR1 expressing cells, and both are known to be involved in maintaining stemness in hematopoietic-stem/progenitor cells (Fig. 5C and D). Western blot analysis of murine stem cells transformed with the full-length BCR-FGFR1 kinase showed relatively low levels of Flt3 and Kit. In the tnFGFR1 transformed cells, however, expression levels of Flt3 and Kit were highly upregulated (Fig. 6A). The relative expression levels in these two cell types was paralleled by expression levels of tnFGFR1. Analysis of a subset of primary human AML samples (Fig. 6B), including four which did not express tnFGFR1 and five that did, showed the same correlation between tnFGFR1 expression and both FLT3 and KIT expression. The significantly upregulated expression of KIT and FLT3 in AML samples exclusively expressing tnFGFR1was also confirmed at the mRNA level using qRT-PCR (Fig. 6C). The correlated expression of tnFGFT1 with Kit and Flt3 were confirmed using flow cytometry of primary leukemia cells from the mouse models (Fig. 6D). Thus, it appears that tnFGFR1, directly or indirectly, influences FLT3 and KIT expression. For most of the archival AML samples described in Fig. 3B, clinical annotation details were not available but in the cases shown in Fig. 6B, AML sample 11,463 was positive for the Flt3 ITD mutation while samples #9276, 11,353 and 12,490, although tested did not show the ITD mutation.
Fig. 6
tnFGFR1 activates KIT and FLT3 in primary leukemia cells. Western blot analysis of KIT and FLT3 expression in leukemic cells from primary, tnFGFR1 transduced stem cells shows upregulation of both genes, compared to those cells transduced with BCR-FGFR1m (A). A similar correlation was seen in primary human AML cells that either express or do not express tnFGFR1 (B). (C) qRT-PCR detection of KIT, FLT3 and FGFR1 mRNA expression for human AML samples used for western blotting in (B) shows increased levels for all three genes in tnFGFR1 expressing cells. The preferential activation of KIT and FLT3 is further validated by flow cytometry analysis of primary leukemia cell from mouse models (D). Using two different shRNAs targeting tnFGFR1 (E, above) in primary tnFGFR1 transformed bone marrow cells, qPCR analysis (N = 3) shows extensive knockdown of tnFGFR1, Flt3, and Kit mRNA compared with cells transduced with a scrambled shRNA (SCR). Western blot analysis of the same cells (E, below) shows effective reduction in FLT3 and KIT protein levels in cells treated with either shRNA. ChIP analysis in primary tnFGFR1 transformed cells isolated from mouse bone marrow, using primers P1 from an upstream intergenic region, P2 within the Kit (F, left) or Flt3 (F, right) promoters and P3 within intronic regions of the genes, shows enrichment only for the P2 defined promoter regions (N = 3). ChIP was performed using antibodies that are specific to tnFGFR1 and also to the MYC-tag that was included in the transfection construct, both of which show the same result. ChIP using IgG alone was performed as a background control. Kaplan-Meier analysis of an AML cohort (N = 422, GSE37642) demonstrates a highly significant decrease in overall survival in patients with high expression levels of both FLT3 and GZMB compared with those showing low-level expression. No significant change in survival was found for different levels of expression of FGFR1 or KIT (G). ns = not significant. *p ≤ 0.05, **p ≤ 0.01, ***p ≤ 0.001
To explore the relationship between tnFGFR1 and FLT3/KIT expression, we designed shRNAs that targeted tnFGFR1 and transfected them into tnFGFR1 transformed primary leukemic cells isolated from bone marrow of mice receiving the transduced cells. As shown in Fig. 6E, as a result of targeting with two shRNAs, which effectively reduced tnFGFR1 expression levels (Fig. 6E, upper) and protein levels (Fig. 6E, lower), there was a significant reduction in the expression of both Flt3 and Kit compared with cells transduced with virus containing a scrambled shRNA. To determine whether this was a direct transcriptional regulation, we performed ChIP analysis of the Flt3 and Kit promoters in primary tnFGFR1 transformed cells (Fig. 6F). In these experiments the transfected tnFGFR1 gene carries a MYC-tag allowing a specific analysis of its expression. Three primer pairs were used to analyse tnFGFR1 occupancy on these promoters, one (P1) upstream in an intergenic region, another within the Flt3/Kit promoters (P2) and a third (P3) located within an intronic region but beyond the promoter region. In both cases, high levels of tnFGFR1 were recovered by ChIP using the P2 primers that were specific for pull-downs using either the tnFGFR1 antibody or the Myc tag antibody. These results demonstrate the selective occupancy of tnFGFR1 on the promoters of these two genes. Thus, it appears that activation of Flt3 and Kit in this cell system is a direct result of tnFGFR1 acting in a transcriptional capacity.
In gene expression data derived from primary human AML samples (GSE37642), while there was no difference in overall survival between patients in which FGFR1 was expressed at high or low levels, there was a significant difference depending on expression levels of FLT3 (Fig. 6G). On the other hand no difference in survival was seen relative to KIT expression levels. Interestingly, high-level expression of GZMB was also associated with poor overall survival. This inferior prognosis associated with high GZMB and FLT3 expression levels, but not with FGFR1 or KIT, was further confirmed in the independent AML patient samples from the TCGA panCancer Atlas (Supplement Figure 5). Here, however, overexpression of FGFR1 and KIT was associated with better survival. While the reason for the survival difference between high and low expression of these genes in this TCGA dataset and the lack of a significant difference in GSE37642 dataset is not clear, it appears that expression of these two genes may not be a valuable predictor for better survival. In both AML patient cohorts, however, higher GZMB expression alone can be used as an independent indicator for poor disease outcome. Given that tnFGFR1 is produced by GZMB cleavage, and is involved in FLT3 activation, these patient survival data may suggest an important, but as yet underappreciated role of tnFGFR1 in human AML.
Targeting FLT3 as a treatment for tnFGFR1 driven leukemiaIn previous studies we have demonstrated that SCLL cells, both in vitro and in vivo, are remarkably sensitive to FGFR1 inhibitors whose major function is to prevent the phosphoactivation of the kinase [10]. Among the various FGFR1 inhibitors, BGJ398 has proved to be the most effective drug [10] and in the BaF3 cell system, while it was particularly effective in suppressing growth in both BCR-FGFR1 and BCR-FGFR1m kinases in a dose dependent manner, tnFGFR1 expressing cells were relatively insensitive (Supplement Figure 6A and B). This suppression of growth was also observed in primary bone marrow cells expressing BCR-FGFR1m which was associated with an increase in Annexin V staining as determined by flow cytometry (Fig. 7A and B) as well as progression through the cell cycle (Supplement Figure 6C and D). Western blot analysis demonstrates treatment with BGJ398 suppresses activation of BCR-FGFR1m but has no effect on tnFGFR1 or FLT3 activation (Fig. 7C). Cells expressing tnFGFR1 are resistant to FGFR1 inhibitors but, because FLT3 is upregulated in these cells and not in the mutant kinase expressing cells, when treated with the AC220 [31] FLT3 inhibitor (Fig. 7D), the tnFGFR1 expressing cells showed a dose dependent suppression of growth, whereas the mutant kinase expressing cells were relatively insensitive. This suppression in growth is also reflected in the delayed progression through the cell cycle (Supplement Figure 6C and D). Analysis of apoptosis in these cells showed increased levels of Annexin V in the tnFGFR1 cells treated with AC220 (Fig. 7E). When these cells are treated with AC220, activation of BCR-FGFR1m is unaffected but there is a reduction in FLT3 activation in tnFGFR1 expressing cells (Fig. 7F). To extend these studies to in vivo models, tnFGFR1-expressing leukemia cells were serially xenografted into BALB/C hosts and allowed to engraft for 7 days. Starting on day 8, individual mice were then treated daily with either 5 mg/Kg or 10 mg/Kg of AC220 until death of the first mouse in the control group (Day 15) when the treatment was terminated. There was a dose dependent improvement of cell survival time proportional to the dose of AC220, compared with mice treated with vehicle alone (Fig. 7G). which was reflected in spleen weight, white blood cell count and proportion of WBC expressing GFP (Fig. 7H-J), indicating the dependence of these tnFGFR1 expressing leukemia cells on FLT3 and providing a possible targeting strategy for this leukemia.
Fig. 7
Targeting Flt3 can inhibit leukemia progression driven by tnFGFR1. When the primary cells from mice xenografted with BCR-FGFR1m or tnFGFR1 were treated with increasing concentrations of BGJ398 (N = 3), the BCR-FGFR1m cells show a dose dependent suppression of growth whereas the tnFGFR1 transformed cells only show a mild suppression of growth at the highest concentrations (A). Flow cytometric analysis of Annexin V staining (B) shows significant apoptosis only in the BCR-FGFR1m expressing cells. BGJ398 treatment specifically blocks phosphorylation of the full length fusion kinase, but has no effect on the tnFGFR1 and FLT3 signaling (C). When the same cells were treated with the AC220 FLT3 inhibitor (D), the tnFGFR1 transduced cells show a dose dependent suppression of growth, with the BCR-FGFR1m cells only showing slight growth suppression at the highest concentrations. Increased Annexin V staining in this case was only seen in the tnFGFR1 cells treated with AC220 (E). AC220 treatment specifically targets the Flt3 signaling (F). Survival analysis of mice (N = 5) xenografted with tnFGFR1 expressing cells shows a dose-dependent improvement in mouse survival following treatment with AC220, which is reflected in spleen weight and WBC count as well as the percentage of GFP+ leukemia cells in the peripheral blood (G-J). When mice (n = 5) inoculated with primary BCR-FGFR1 expressing leukemia cells and then treated after 7 days with either BGJ398 (30 mg/Kg) or AC220 (10 mg/Kg) alone, ANOVA statistical analysis with Bonferroni correction revealed that there was a significant increase in survival when each cohort was compared individually with the vehicle treated control group (K). A combination of BGJ398 and AC220 shows a further significant improve
留言 (0)