
記住我
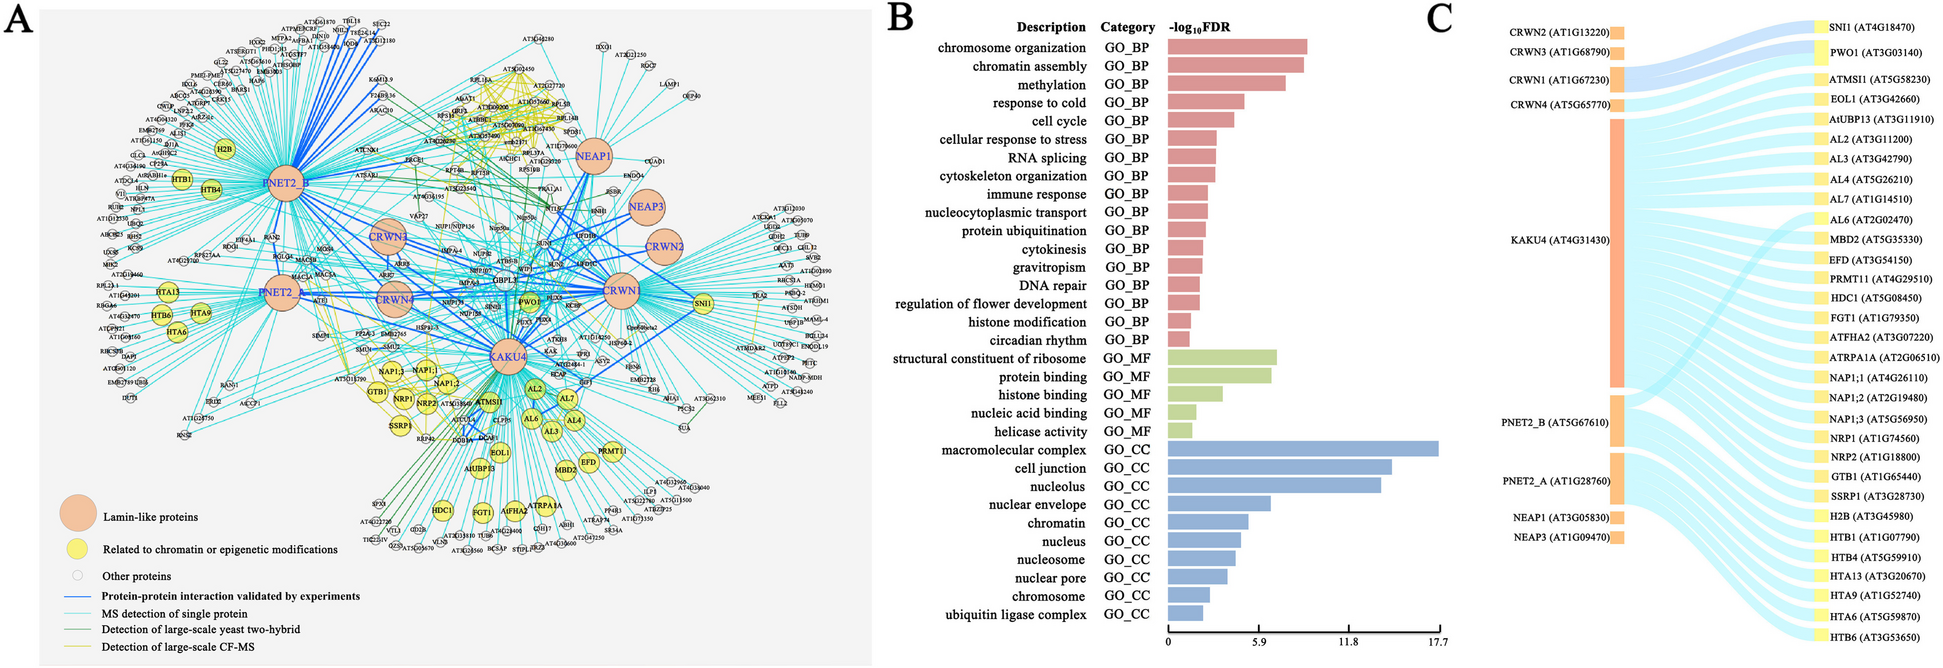
Human mitochondrial RNA is initially expressed as polycistronic transcripts that in most cases cover the whole heavy and light mtDNA strands and extensive post-transcriptional processing follows to produce individual mRNAs. Therefore, it is expected that when RNA is collected from biological samples, there will be assorted forms of precursor, intermediate and fully processed transcripts. Although many library preparation techniques also include the enrichment of polyadenylated (polyA) fragments, due to the abundance of mitochondrial RNA in any given sample, non-polyA mitochondrial RNA is also likely to be present. During the standard RNAseq library preparation protocol, this RNA is thought to be cut predominately at random positions to produce fragments of the appropriate size for sequencing. Compared to this random cleavage at internal RNA positions, we would expect that the true 5′ and 3′ ends of the original transcripts will be over-represented, and thus, more of the ends of RNA sequencing reads generated from these libraries will map to genuine cleavage sites on the mitochondrial chromosome (read stacking). Between any given pair of sites along the mitochondrial genome, there will be reads stacking immediately adjacent on either side, and by counting the number of these and then dividing this by the number of reads that fully overlap the site, we can generate a proxy ‘cleavage ratio’ for that position. Subsequently, any site that represents the start/end of a genuine transcript in the original biological sample should have a higher cleavage ratio, and by identifying these peaks, we can infer both putative RNA cleavage sites and a proxy for the rate of cleavage at these sites (Fig. 1).
Fig. 1
Inferred cleavage rates in mitochondrial RNA. A Starts and ends of original genuine RNA fragments should ‘stack’ at the same positions in the genome. B Cleavage ratio of a site calculated as the number of processed reads (those starting or ending either side of the site) as a proportion of total reads across the site (processed and unprocessed)
Detection and interpretation of mitochondrial RNA cleavage sitesIn order to identify putative mitochondrial RNA cleavage sites, we mapped and filtered RNA sequencing datasets from 799 whole blood samples from the CARTaGENE project using parameters designed to keep as much of the genuine RNA fragment as possible (see the ‘Methods’ section) and calculated cleavage ratios at all sites across all individuals (Additional file 1: Fig. S1). We then identified positions with cleavage ratios greater than 0.1 (the mean average ratio at 100 random sites >50 bp away from known gene boundaries is 0.01, standard deviation 0.01). As many of the obtained cleavage ratios clustered close to each other along the mitochondrial transcriptome, we merged sites that were within 5bp of each other and kept the one with the highest ratio as representative of the ‘peak’ cleavage site in the region. Finally, we kept any peak site that was present in at least 50% of the 799 individuals and had at least 20x read coverage; this left us with 79 putative RNA cleavage sites (Additional file 2: Table S1). In total, 9 of these occur exactly at known gene boundaries (defined as the region between two mitochondrial genes), and a further 11 occur no further than 10bp from these regions. The remaining 59 occur at various positions within coding and non-coding sequences and may represent novel cleavage junctions. As a sanity check, we also calculated the cleavage ratios at the 28 known mRNA or rRNA gene boundaries and find that 17 are significantly higher than the background rate (P < 0.05/28, one-sided t-test, Additional file 1: Fig. S2, see the ‘Methods’ section), showing the validity of our approach.
To test the reproducibility of our cleavage detection method, we applied the approach to 344 additional whole blood RNAseq samples from the GTEx project and repeated the sample detection methods as above (for distribution of cleavage rates, see Additional file 1: Fig. S1). In total, we reproduce 54 of the original peak cleavage sites (~68%, Additional file 2: Table S1). Within these 54 reproducible sites, 8 occur exactly on known gene boundaries, all of which occur between genes that contain interspersed tRNAs, and 9 further sites were detected no more than 10 bp away from a known gene boundary. As such, our approach identifies a large number of known mitochondrial RNA cleavage sites with high accuracy. Interestingly, one reproducible cleavage site was found only 1 bp away from the MT-ATP6 to MT-CO3 gene boundary, which does not contain an interspersed tRNA and is thought to be processed via other mechanisms. Of the 37 reproducible sites that occur more than 10bp away from known gene boundaries, 18 occur within coding genes, 2 within rRNAs, 15 within tRNAs and 2 within the mtDNA control region. These positions are potential candidates for novel mitochondrial RNA cleavage sites.
To test the validity of the 54 reproducible sites, we performed two additional validation steps. First, both CARTaGENE and GTEx data are generated using polyA-enriched RNA fragments. Therefore, to test whether any of the 54 sites could be a result of experiment-specific technical artefacts, we obtained an additional 16 whole blood RNA sequencing datasets from Pineau et al. [29] that were generated from ribosomal RNA-depleted libraries (see the ‘Methods’ section) and tested whether the 54 putative cleavage sites had cleavage ratios >10% in any of the samples. In total, 47/54 sites were validated in these data, making it unlikely that they are a consequence of specific library preparation approaches. Second, since advances in long-read sequencing technologies now allow for the identification of full-length RNA transcripts, we tested for evidence of overlap between the 54 putative RNA cleavage sites and the 5′/3′ ends of RNA fragments generated from high coverage Oxford Nanopore cDNA and native RNA sequencing data from a human B lymphocyte cell line [30]. Within this study, it was shown that technical features of Nanopore direct RNA sequencing led to truncation events in mitochondrial transcripts 10–15bp from the 5′ end of genes, and as such, we removed putative cleavage sites within 3bp of these regions. Of the 44 putative cleavage sites remaining, we find evidence for validation of 29 sites (see the ‘Methods’ section). As such, in total, we validate 52/54 putative cleavage sites across ribosomal RNA-depleted and Nanopore datasets (Additional file 2: Table S1; for flowchart of filtering steps, see Additional file 1: Fig. S3). Although some of the 54 putative RNA cleavage sites may still be false positives or not validated because of technical features specific to each platform, since we are also interested in the molecular mechanisms underpinning these events, as well as the potential downstream consequences of variation in such processes, we continue to focus on these 54 sites for all subsequent analyses.
It has been shown in previous work that reads also tend to terminate and ‘stack’ at sites of RNA modification [31,32,33], and indeed, in our data, five putative RNA cleavage sites occur at known modified sites. These sites include position 5595 (an m1A modification at position 9 of MT-TA), position 7465 (a dihydrouridine modification at position 20 of MT-TS1), position 14699 (a m2G modification at position 26 of MT-TE) and positions 7544 and 8322 (Ψ modifications at positions 27 and 28 of MT-TD and TK, respectively). Furthermore, work by Mercer et al. [11] found evidence of additional RNA cleavage events within the mitochondrial transcriptome that generate short RNAs (sRNAs) that have unknown function, but may play a role in RNA silencing. Three cleavage sites detected in this study occur close to identified sRNA boundaries: one at site 598 within MT-TF (1bp from an sRNA boundary), the second at site 3258 within MT-TL1 (0bp from an sRNA boundary) and the third at site 9157 within MT-ATP6 (1bp from an sRNA boundary). Although stringent criteria were used to identify such sRNA boundaries, these results show that our approach has the potential to identify novel RNA cleavage events with functional relevance.
To test whether RNA cleavage events either influence or co-occur with downstream processes, we compared cleavage ratios to mitochondrial-encoded gene expression levels across individuals, requiring significance (after Bonferroni correction) and the same direction of effect in both discovery (CARTaGENE) and replication (GTEx) datasets. In total, we find 18 significant relationships, involving 6 unique cleavage sites (positions 659, 1682, 9219, 10074, 10479 and 10496) and the expression levels of 9 unique mitochondrial genes (Additional file 2: Table S2 and Additional file 1: Fig. S4). Position 1682 falls 12bp from the 5′ end of MT-RNR2, and putative cleavage ratios at this site are negatively associated with the expression levels of nine different mitochondrial genes (MT-RNR1, RNR2, ND1, ND2, CO2, ATP6, ND4, ND5 and CYB). This may suggest a role for cleavage at position 1682 in modifying the processing and expression of MT-RNR2, which subsequently influences the RNA levels of most other mitochondrial-encoded genes, although this would need to be tested further. The remaining 8 cleavage sites are all associated with the expression levels of four genes (MT-RNR1, RNR2, ND1 and ND2).
Quantitative trait loci mappingPost-transcriptional processing of the mitochondrial transcriptome is carried out exclusively by nuclear-encoded proteins. Therefore, in order to identify common nuclear genetic variants and genes associated with variation in mitochondrial RNA cleavage events across individuals, we used genome-wide genetic data and the cleavage ratio at each of the 54 cleavage sites for 799 individuals in the CARTaGENE dataset to map quantitative trait loci in the nuclear genome.
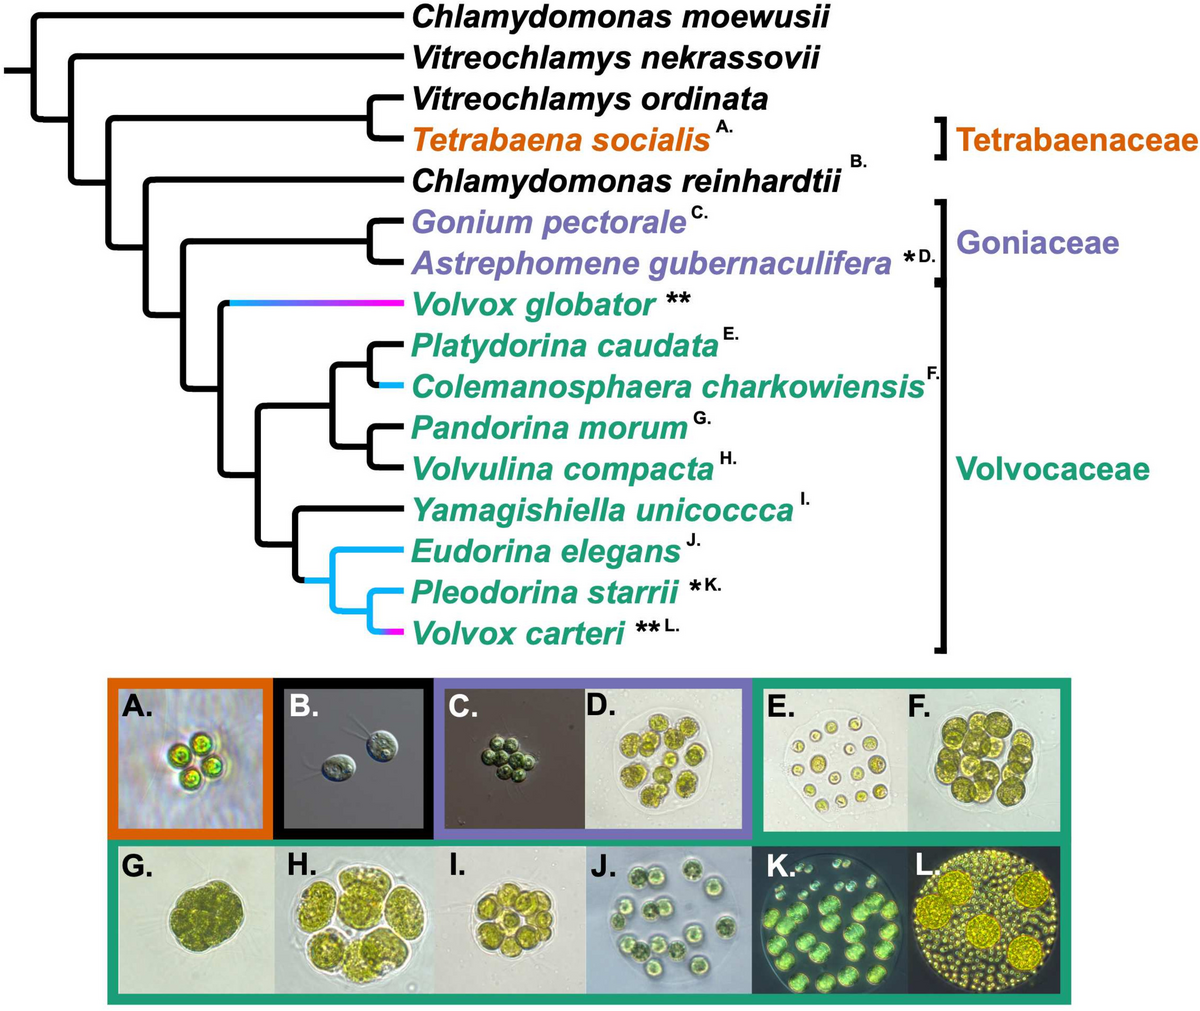
In total, we identify 26 nuclear genetic variants associated with mitochondrial RNA cleavage rates (unique peak nuclear genetic variant and cleavage site pairs) after correcting for multiple tests (Table 1, P < 9.26 × 10⁻¹⁰, correcting for standard genome-wide significance at 5 × 10⁻⁸ at 54 sites, examples shown in Fig. 2, for QQ plots see Additional file 1: Fig. S5). These 26 nuclear-encoded variants are associated with 24 different cleavage sites in the mitochondrial transcriptome; 7 of these fall within 2bp of known gene boundaries (between MTND1-TRNI, MTND2-TRNW, TRNS1-TRND, MTATP6-MTCO3, MTCO3-TRNG, MTND3-TRNR and MTND4-TRNH), 12 fall within a tRNA (ranging from 10 to 31bp from either end) and 5 fall within coding regions (10bp from the 3′ end of MTND1, 8bp from 5′ end of MTCO1, 13bp from 3′ end of MTATP6, 12bp from 5′ end of MTCO3 and 12bp from 5′ end of MTCYB).
Table 1 Nuclear-encoded genetic variation significantly associated with inferred mitochondrial RNA cleavage rates in discovery (CARTaGENE) data and statistics for the same associations in replication (GTEx) data. Variants are linked to genes either through functional (missense) mutations or via eQTL dataFig. 2
Relationship between genotype and inferred cleavage rate at multiple positions on the nuclear genome and mitochondrial transcriptome, respectively. Inferred cleavage positions are represented by red circles along the mitochondrial transcriptome, and inferred cleavage ratios are colour coded using three categories: yellow on known gene boundaries, blue within tRNAs, green on mRNAs within a tRNA flanked boundary and red on mRNA within a non-tRNA flanked boundary. Beta estimates, P-values, cleavage rates and genotypes displayed in boxplots originate from the CARTaGENE dataset (N = 799 for each plot)
To identify the potential nuclear genes that are modulating mitochondrial RNA cleavage rates, we tested whether each significant peak nuclear variant was either functional or associated with the expression of a nearby gene in the eQTLGen consortium database [34] (P < 5 × 10⁻⁸, selecting the nearest gene if multiple associations were found). Applying this approach, we link a number of known and novel proteins involved in mitochondrial RNA cleavage (Table 1). First, a large number of peak nuclear genetic variants are missense and intronic mutations linked with MRPP3, and in all cases, these associations occur for mitochondrial cleavage sites that fall at mRNA-tRNA boundaries, or within a mitochondrial tRNA. MRPP3 is known to cleave the 5′ end of mitochondrial tRNAs at canonical mRNA-tRNA junctions, but results here suggest the gene may also cleave internal tRNA positions that could result in short RNA fragments that are generated from the ends of tRNAs (described above). Second, several peak nuclear genetic variants are intronic mutations linked with FASTKD5 and are associated with mitochondrial RNA cleavage events near to the MTATP6-MTCO3 junction, as well as a site near to the 5′ end of MTCO1. FASTKD5 has been shown to be required for the maturation of precursor mitochondrial RNAs that are not flanked by tRNAs [24] and results here therefore validate this finding. Third, multiple peak nuclear variants are intronic or upstream mutations for TBRG4 (FASTKD4), which are associated with mitochondrial RNA cleavage specifically around the MT-TE-MTCYB junction, but also for a cleavage site close to the MTATP6-MTCO3 junction that is not interspersed by a tRNA. TBRG4 is known to play a role in processing mitochondrial RNA precursors, as well as stabilising several mitochondrial mRNAs, but these results hint that TBRG4 may also be involved in the processing of the non-canonical junction between MTATP6-MTCO3. Fourth, an intronic mutation within SLC25A26 is associated with cleavage rates within MT-TF. SLC25A26 is a mitochondrial carrier protein involved in transporting S-adenosylmethionine into the mitochondria [35, 36]. We have previously implicated genetic variants in this protein with variation in mitochondrial RNA modification levels [26, 37], and thus, the link we observe here may be modulated through this process.
In order to test the robustness of our findings, we attempted to replicate significant associations in an independent whole blood dataset (GTEx, using the same peak variant where present, or the closest variant in high LD, R2 > 0.9, if not). In total, 11 of the 26 peak nuclear genetic variants show the same direction of effect with the same high-confidence cleavage site in GTEx data at nominal significance (P < 0.05), 7 of which are significant after Bonferroni correction (Table 1, P < 0.00192, corrected for 26 tests). Furthermore, association betas show strong correlation between datasets (Pearson’s R = 0.623, P = 0.0002, Additional file 1: Fig. S6). Associations that replicate include a missense mutation in MRPP3 that is linked to a cleavage event that is exactly at the MTND1-MTTI gene boundary, as well as links between intronic FASTKD5 mutations and cleavage rates at sites near the MTATP6-MTCO3 and the MTY-MTCO1 junctions, thus validating the role of FASTKD5 in these processes.
Mitochondrial RNA cleavage events and nuclear-encoded gene expressionGiven the role of nuclear-encoded proteins in mitochondrial RNA processing events, we sought to further explore these complex cross-genome relationships by directly comparing inferred mitochondrial RNA cleavage ratios with nuclear-encoded gene expression in the same individuals. Given the influence of multiple interconnected genetic and environmental factors on variable gene expression, we implemented a stringent set of filtering strategies in order to identify nuclear genes that may be modulating mitochondrial RNA cleavage events.
First, using linear regression, we identified nuclear genes whose expression was associated with inferred mitochondrial RNA cleavage rates at the 54 reproducible sites in both discovery (CARTaGENE) and replication (GTEx) datasets (applying Bonferroni correction for the number of sites and the number of genes, for pairs that were present in both datasets). This approach identified 14,414 gene-site pairs in the discovery dataset (see Additional file 2: Table S3 for all significant associations) and 465 in the replication dataset (see Additional file 2: Table S4 for all significant associations, and Additional file 1: Fig. S7 for P-value distributions from both the discovery and replication data). We then intersected the two lists, keeping only those associations with the same direction of effect, which left 52 gene-site pairs encompassing 43 unique genes (Additional file 2: Table S5). Five of these genes are present in MitoCarta [8] and another five are thought to be RNA binding proteins [38] (non-overlapping sets, except COX5B). To test whether the relationship between each nuclear gene/mitochondrial RNA cleavage site pair is more likely to be driven by the nuclear gene (rather than caused by mitochondrial RNA processes), we performed mediation analysis by identifying significant peak cis-eQTLs in the nuclear genome for each of the 43 unique genes and testing whether these variants are first associated with the cleavage ratio of the corresponding mitochondrial site (P < 0.05) and second whether this relationship is significantly mediated by the expression of the nuclear gene (P < 0.05/52). In total, 12 of the tests show significant evidence for mediation; 3 of these are for site 1682 in the mitochondrial genome, which falls within MTRNR2 close to a tRNA junction; 2 are for site 9157, which is closest to the MTATP6-MTCOX3 junction; and the remaining 7 are for site 10074, which falls within MTND3 near to a tRNA junction. The 10 unique genes identified through this analysis are thus candidates for being involved in mitochondrial RNA cleavage. They include ATP5E and COX17, both of which form part of the electron transport chain, as well as CXCR2P1, ELOVL7, GNAZ, ITGB5, MAP3K7CL, MYLK, SH3BGRL2 and TUBB1.
Finally, to test whether nuclear genes might be operating through mitochondrial RNA cleavage to influence mitochondrial-encoded gene expression levels, we took all mitochondrial RNA cleavage sites that were significantly associated with both the expression of a nuclear-encoded gene and the expression of a mitochondrial-encoded gene (125 unique cases) and performed a further round of mediation analysis. In each of these cases, we first tested whether the expression of the nuclear- and mitochondrial-encoded genes were correlated (P < 0.05) and then tested whether this relationship is significantly mediated by the inferred cleavage rate of the associated site (P < 0.05/125). In total, 16 of the tests show significant evidence for mediation, implicating 9 unique nuclear genes (ACRBP, CTTN, CXCR2P1, GNAZ, ITGB5, MAP3K7CL, SH3BGRL2, SPARC and TMEM40, Additional file 2: Table S6). None of these genes are present in MitoCarta [8], and as such, they may have unidentified roles in mitochondrial processes, either directly or indirectly through interactions with other genes.
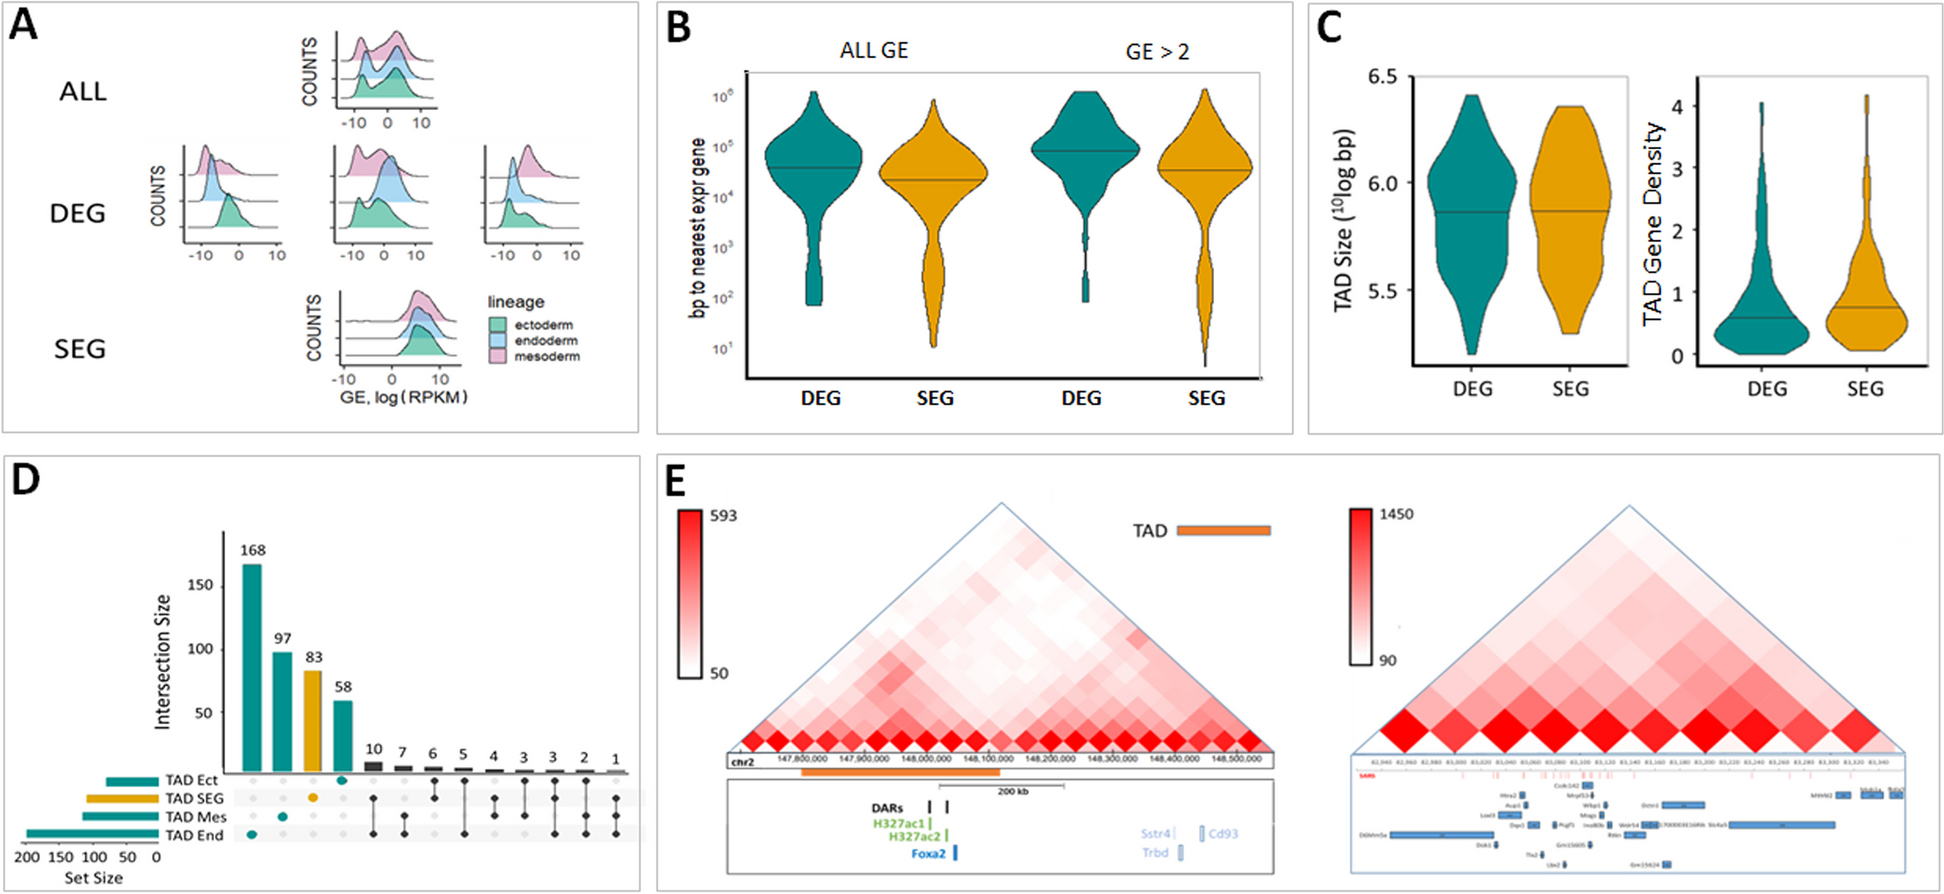
Knock down of candidate novel mitochondrial RNA processing genesIn order to further implicate nuclear-encoded genes in mitochondrial RNA processing, we sought knock down (KD) data for any gene that has been implicated above in quantitative trait loci mapping (four unique genes — MRPP3, FASTKD5, TBRG4 and SLC25A26) and expression correlation analyses (43 unique genes, Supplementary Table 5). In total, two of these genes (TBRG4 and RPS19) have shRNA KD data from the ENCODE project, containing 8 samples in total (4 from KD and 4 from controls) in 2 different cell lines. Using these data, we mapped and filtered samples as above and calculated cleavage ratios at mitochondrial RNA cleavage sites linked to the discovery of each gene. First, TBRG4 (FASTKD4) has been implicated in influencing cleavage ratios around the MTATP6-MTCOX3 junction that is not separated by a tRNA. Using KD data for this gene, we find that there is a decrease in the cleavage ratio in KD samples compared to controls at position 9219 (mean ratio 0.37 for control and 0.29 for KD samples), although this is not significant (P=0.111, one-tailed t-test, Fig. 3). The closest high-confidence site to the exact junction between MTATP6 and MTCOX3 that we detect falls at position 9207, and ratios at this site in KD samples are again lower than in control data, but this difference is also not significant (P = 0.295).
Fig. 3
Comparison of inferred cleavage rates in mitochondrial RNA between control and shRNA knock down data for candidate genes (N = 8 in each plot, 4 from KD and 4 from controls). A Control vs sh knock down cleavage ratio for TBRG4 at position 9219 near the MT-ATP6 to MT-CO3 gene boundary. B Control vs sh knock down cleavage ratio for RPS19 at position 9157 near the MT-ATP6 to MT-CO3 gene boundary
Second, RPS19 is a nuclear-encoded ribosomal gene whose expression is associated with putative cleavage ratios at site 9157, in MTATP6, 49bp from the MTATP6-MTCOX3 junction. Using KD data for this gene, we find that there is a highly significant decrease in the cleavage ratio in KD samples compared to controls (P = 0.00018, one-tailed t-test, mean control ratio = 0.125, mean KD ratio = 0.066, Fig. 3), suggesting that RPS19 may be modulating RNA processing at this site. To test whether RPS19 may be acting more globally across the mitochondrial transcriptome, we tested for differences between control and KD data for all 54 reproducible cleavage sites and find that no other sites are significant after Bonferroni correction, and indeed, the relationship at site 9157 is the only one significant at this level (P < 0.05/54). Collectively, these results implicate a novel gene (RPS19) in modulating mitochondrial RNA cleavage events.
Functional enrichment and potential disease linksIn order to identify whether mitochondrial RNA cleavage events might be linked to disease, we first tested whether any peak nuclear genetic variants associated with mitochondrial RNA cleavage rates (identified above) were in linkage disequilibrium (LD) with variants listed in the GWAS catalogue [39] (R2 > 0.8 in the CEU population from 1000 Genomes data [40], disease associations P < 5 × 10⁻⁸). In doing so, we find that both rs4724362 and rs73109897 (which both appear to act through TBRG4 on sites around the MT-TE and MT-CYB junction) are in LD with rs12672022, which is associated with colorectal cancer.
Second, we tested for functional enrichment in GO and KEGG terms for nuclear genes whose expression correlated with mitochondrial RNA cleavage rates across both discovery and replication cohorts (43 unique genes) using gProfiler [41]. After adjusting for multiple tests, no GO terms were significantly enriched for the gene list; however, several KEGG pathways were enriched including oxidative phosphorylation (4 genes, adjusted P = 0.016), but also amyotrophic lateral sclerosis, (6 genes, adjusted P = 0.012), Parkinson’s disease (5 genes, adjusted P = 0.019), Prion disease (5 genes, adjusted P = 0.028), Huntington’s disease (5 genes, adjusted P = 0.040) and pathways of neurodegeneration — multiple genes (6 genes, adjusted P = 0.039).
留言 (0)