
記住我


This prospective study included 28 patients with G.D. (15 boys, 13 girls, mean age of 6 years). Patients with G.D. type I (n = 20) and type III (n = 8), 28 matched controls (12 boys, 16 girls, mean age of seven years). Patients were classified according to the score into Mild disease (n = 3), moderate disease (n = 3), marked disease (n = 8) and severe disease (n = 14). Data analysis revealed the following results:
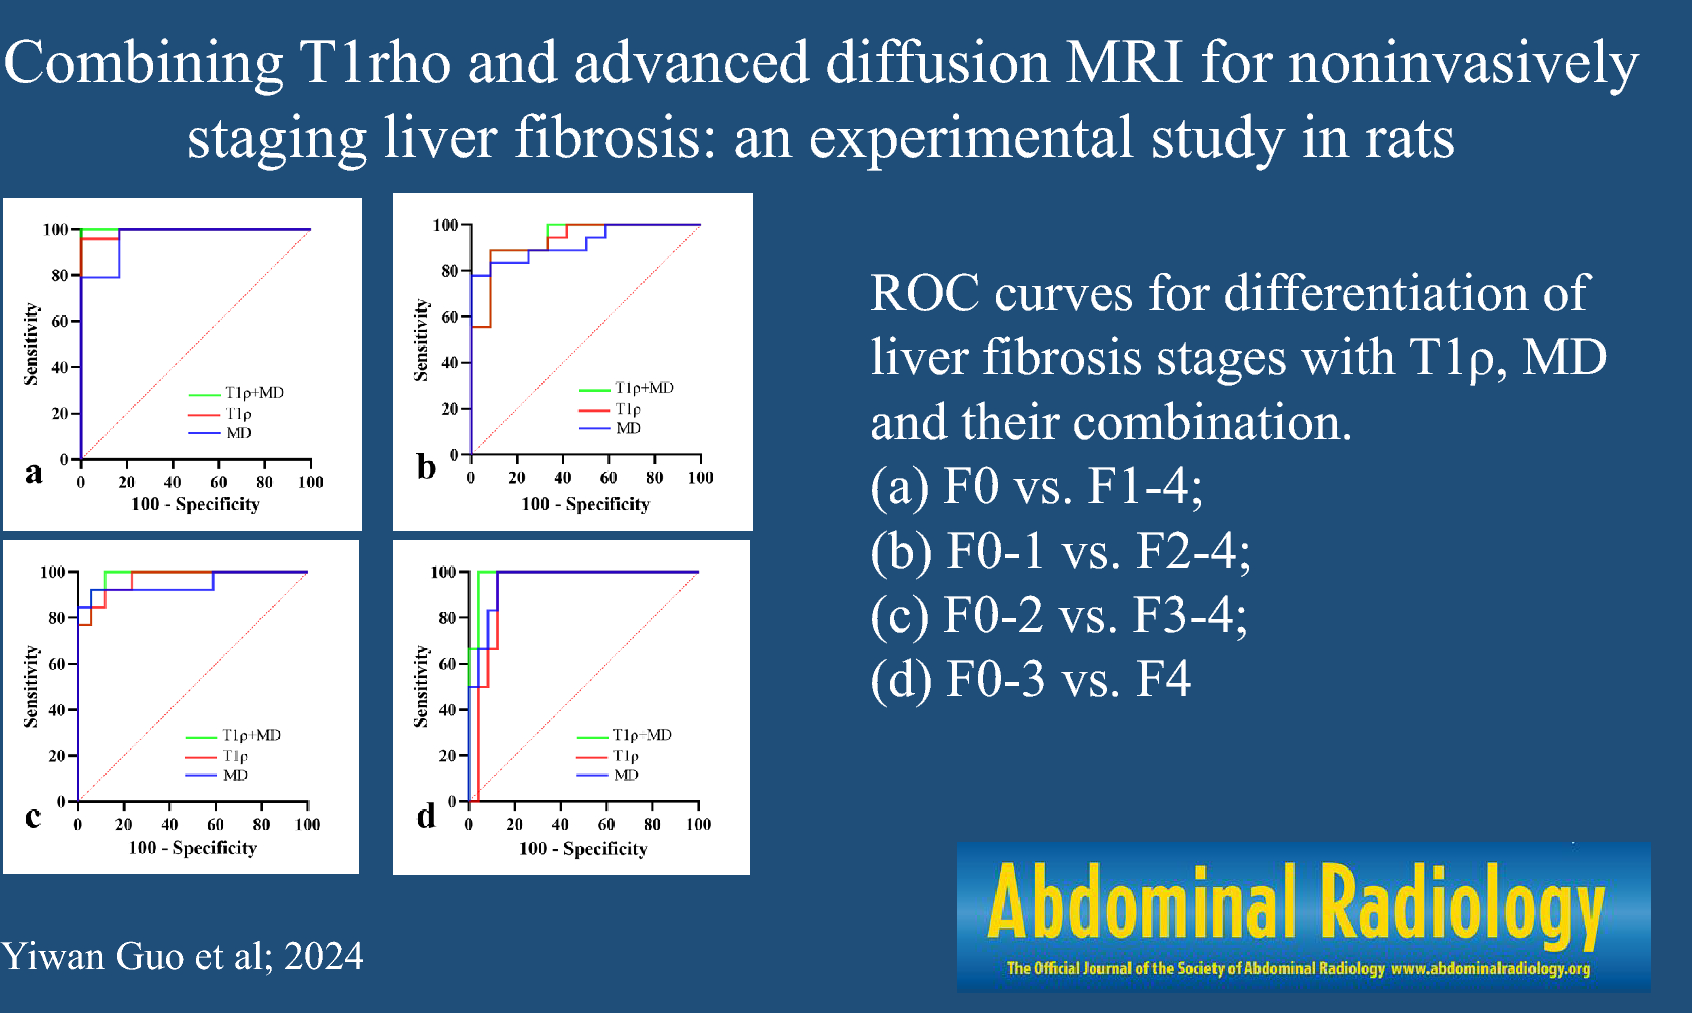
M.D. values (Figs. 3a and 4a)There was a statistically significant difference in the M.D. value of the liver and spleen between untreated patients and controls (p < 0.001) and between control and treated children (Table 2). Statistically, a significant difference was also detected in the M.D. value of the liver and spleen between untreated and treated patients (p < 0.001). The mean M.D. value of the liver and spleen in untreated children with Gaucher's disease was 1.31 ± 0.06 and 0.73 ± 0.09 × 10⁻³ mm2/s, respectively, in control children, it was 1.48 ± 0.07 and 0.98 ± 0.06 × 10⁻³ mm2/s, and intreated children it was 1.4 ± 0.04 and 0.86 ± 0.02 × 10⁻³ mm2/s, respectively. At the ROC curve, the AUC of the M.D. values of the liver and spleen used to differentiate untreated patients from controls was 0.96 and 0.98, respectively, with liver and spleen cutoff points to differentiate both groups being 1.4 and 0.90 × 10⁻³ mm2/s. respectively. Sensitivity, specificity, positive, and negative predictive values for liver and spleen were (96%, 84.6%, 92.3%, and 91.7%) and (92%, 92.3%, 95.8%, and 85.7%) with 92% accuracy for both. At the ROC curve, the AUC of the M.D. values used to differentiate untreated from treated patients was 0.9 and 0.86 for the liver and spleen, respectively, with liver and spleen cutoff points to differentiate both groups being 1.37 and 0.78 × 10⁻³ mm2/s, respectively. Sensitivity, specificity, positive and negative predictive values for liver and spleen were (84%, 84%, 84%, and 84%) and (92%, 92%, 76.7%, and 0.9%) with 84% and 82% accuracy, respectively.
Fig. 3
a Receiver operating characteristic (ROC) curve for M.D. values of the liver and spleen in untreated patients and control. b Receiver operating characteristic (ROC) curve for FA values of the liver and spleen in control and untreated patients
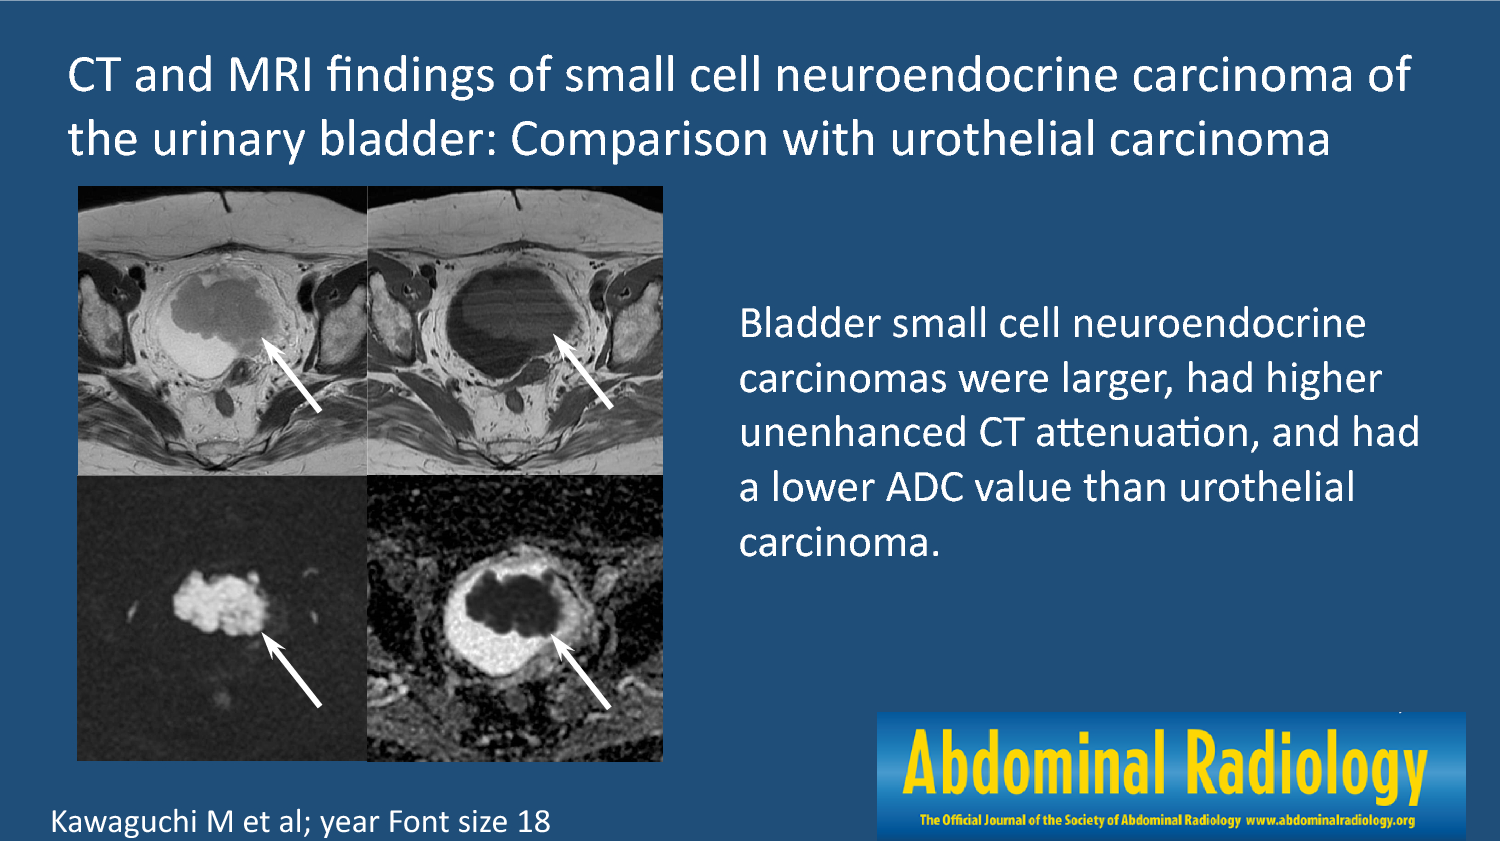
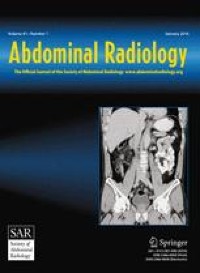
Fig. 4
a ROC curve for M.D. values of the liver and spleen in untreated and treated patients. b ROC curve for F.A. values of the liver and spleen in untreated and treated patients
Table 2 Mean, median, SD, minimum, maximum, p value, of M.D. and F.A. of liver and spleen of untreated, treated patients and controlsF.A. values (Figs. 3b and 4b)There was a statistically significant difference in the F.A. value of the liver and spleen between untreated patients and controls and between control and treated children (p = 0.002 and 0.001, respectively). Statistically, a significant difference was also detected in the F.A. value of the liver and spleen between untreated and treated patients (p = 0.02 and 0.03, respectively). The mean F.A. value of the liver and spleen in untreated children with G.D. was 0.49 ± 0.08 and 0.52 ± 0.08; in control children, it was 0.29 ± 0.04 and 0.28 ± 0.08, and intreated children it was 0.37 ± 0.85 and 0.38 ± 0.1, respectively. At the ROC curve, the AUC of the F.A. values of the liver and spleen used to differentiate untreated patients from controls were 0.96 and 0.97, with 0.33 and 0.38 cutoff points to differentiate both groups for the liver and spleen, respectively. Sensitivity, specificity, positive and negative predictive values for the liver and spleen were (92%, 69.2%, 85.2%, and 81.8%) and (92%, 76.9%, 88.5%, and 83.3%) with 84.2% and 86.8% accuracy, respectively. At the ROC curve (Table 3), the AUC of the F.A. values of the liver and spleen used to differentiate untreated from treated patients were 0.83 and 0.8, respectively, with a cutoff point to differentiate both groups for the liver and spleen of 0.41 and 0.4, respectively. Sensitivity, specificity, positive and negative predictive values for the liver and spleen were (80%, 92%, 90.9%, and 82.1%) and (76%, 92%, 90.5%, and 79.3%) with 86% and 84% accuracy, respectively.
Table 3 The ROC curve results of MD and FA of patients vs controls and untreated vs treatedClinical scoringAccording to the clinical score, patients were classified into Mild disease (n = 3), moderate disease (n = 3), marked disease (n = 8) and severe disease (n = 14).
Laboratory (Table 4) Blood levels of Beta glucosidase, hemoglobin, and platelets were significantly lower in patients with G.D. than in control; Beta glucosidase level was (0.54 ± 0.15 and 3.64 ± 0.6, p < 0.001) for patients and control, respectively. Hemoglobin level was (7.73 ± 0.1 and 11.03 ± 0.6, p < 0.001) for patients and control, respectively. Platelets level was (92.12 ± 06.4 and 207.62 ± 36, p < 0.001) for patients and control, respectively. The chitotriosidase level was significantly higher in patients with G.D. than in control; (5044 ± 2949 and 1673 ± 130, p < 0.001) for patients and control.
Table 4 Mean and SD, min and max of lab: beta glycosidase, chitotriosidase, HB, Platelets Beta glucosidase, Clin: DS3 score, Vol: liver and spleenLiver and spleen volume The mean liver volume in patients with G.D. was 671.6 ± 132, and the mean splenic volume was 387.32 ± 150.
Genotyping There was no statistically significant difference in the M.D. values of the liver between untreated patients with L444P mutation (n = 11) and patients with other mutations (n = 17). M.D. liver values were (1.31 × 10⁻³ mm2/s and 1.3 ± 0.05 × 10⁻³ mm2/s, p = 0.7) for patients with L444P mutation and patients with other mutations, respectively. Spleen MD values were (0.78 ± 0.01 and 0.7 ± 0.08, p = 0.05), respectively. FA values of the liver were (0.48 ± 0.08 and 0.5, p = 0.4), spleen F.A. values were (0.5 ± 0.09 and 0.53, p = 0.5) for patients with L444P mutation and patients with other mutations, respectively.
Correlations Chitotriosidase level was positively correlated with FA values of the liver (r = 0.409, p = 0.042) and spleen (r = 0.39, p = 0.05) in untreated patients. Hemoglobin level was positively correlated with the M.D. value of the spleen (r = 0.5, p = 0.01) and negatively correlated with F.A. values of the spleen (r = 0.46, p = 0.02). Clinical score was negatively correlated with the M.D. value of the spleen (r = 0. 67, p < 0.001) and was positively correlated with F.A. values of the liver (r = 0.5, p = 0.01) and F.A. values of the spleen (r = 0.41, p = 0.02). Spleen volume was negatively correlated with M.D. values of the spleen (r = 0. 40, p = 0.047).
留言 (0)