
記住我

Despite hemodialysis maintenance, patients with end-stage renal disease (ESRD) are often affected by the symptoms of uremic syndrome. The most common uremic impact experienced by patients undergoing maintenance hemodialysis is fatigue, with studies reporting changes in fatigue levels before and after hemodialysis (Brys et al., 2019; Wang et al., 2015). Fatigue in ESRD impacts well-being and may increase mortality risk during hemodialysis (Bossola et al., 2015; Jacobson et al., 2019).
Patients rarely show uremic manifestations when dialysis adequacy is achieved, which may be assessed using the recommended dialysis adequacy (Kt/V) and urea reduction ratio (URR) measures (National Kidney Foundation, 2015). A systematic review reported that when Kt/V and URR are higher than 1.2% and 65%, respectively, patient dialysis adequacy is improved. Several other factors known to contribute to dialysis adequacy include age, gender, duration of dialysis, the use of filters, and dialysis prescription (Barzegar et al., 2016). Dialysis adequacy is one of the most important and modifiable factors for biochemical markers (i.e., creatinine, urea). These biomarkers can alter the mineral metabolism associated with increased mortality risk in patients with ESRD (Duong et al., 2019). Hence, dialysis adequacy may improve disease prognosis and quality of life and reduce mortality in patients with ESRD (El-Sheikh & El-Ghazaly, 2016).
Various methods are used to increase dialysis adequacy to avoid the symptoms of uremic syndrome. A 25% increase in blood flow has been noted to be effective in increasing dialysis adequacy (Aliasgharpour et al., 2018). However, patients often experience negative effects during dialysis such as fatigue, dyspnea, restless leg, and nausea, although vascular access also needs to be considered (El-Sheikh & El-Ghazaly, 2016). Fatigue is a common complaint resulting from uremic syndrome, with a prevalence ranging from 60% to 97% (Bossola et al., 2015). Fatigue, generally described as weakness and lack of energy, is commonly experienced by patients with ESRD undergoing long-term dialysis therapy. One safe and effective way to increase urinary clearance is to increase the rate of blood flow to the dialyzer by having the patient undertake exercise during the hemodialysis session, known as “intradialytic exercise.” Intradialytic exercise can increases muscle blood flow, producing a vasodilating effect on muscle blood vessels. Intradialytic exercise may improve the adequacy of dialysis by increasing Kt/V-urea and decreasing creatinine (Ferreira et al., 2019).
Intradialytic exercise using a static bicycle or intradialytic cycling has been found to be effective in increasing dialysis adequacy. Other forms of physical exercise not requiring equipment, including those involving only the movement of the joints or range of motion (ROM), have not been widely evaluated (Paluchamy & Vaidyanathan, 2018). Mohseni et al. (2013) conducted an intervention study that provided a 15-minute aerobic exercise 3 times a week, which increased Kt/V by 38% and URR by 11% after 8 weeks. However, the intensity of the exercise was not assessed. Similarly, the findings of a systematic review recommended physical exercise be included during hemodialysis; however, the appropriate type, intensity, and duration of exercise require further investigation (Barcellos et al., 2015).
MethodsThe aim of this study was to investigate the effect of intradialytic ROM exercises on dialysis adequacy and fatigue in hemodialysis patients. The study was undertaken in a general hospital in West Sumatra with outpatient dialysis patients receiving dialysis using a low-flux dialyzer for a duration of 270 minutes per session at a blood flow rate of 200–250 ml/minute and a dialysate flow rate of 500 ml/minute. The study was approved by the research ethics committee, Faculty of Medicine, Universitas Andalas (No. 301/KEPK/2018), and data were collected from January to April 2019.
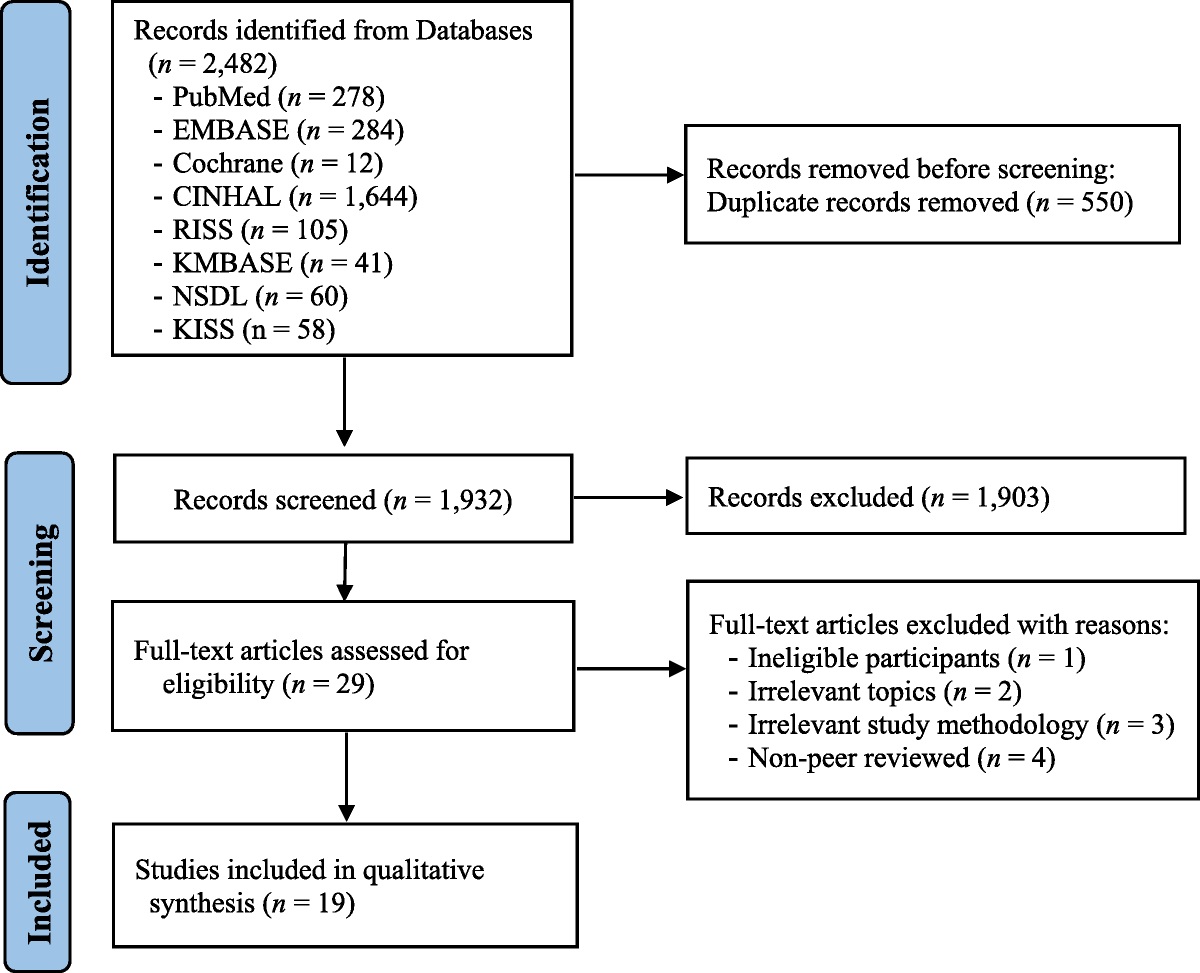
The inclusion criteria were patients aged > 18 years who had undergone routine hemodialysis for at least 3 months and were currently undergoing routine hemodialysis twice per week. Patients were excluded if they had moderate or severe anemia, blood pressure of > 220 mmHg (systolic) or > 110 mmHg (diastolic), or a diagnosis of ischemic heart disease. Patients with contraindications to exercise at baseline, including orthopedic or musculoskeletal issues and a heart rate of ≥ 100 beats/minute before exercise, were also excluded (see Figure 1).
 Figure 1.:
 Consolidated Standards of Reporting Trials Flow Diagram.
All dialysis patients at the target hospital who met the inclusion criteria were invited to participate in this study. The study requirements were explained by the researcher, and patients who were willing to participate provided signed informed consent. Participants meeting the inclusion criteria who provided informed consent were allocated to treatment and control groups using computerized simple random sampling. The sample size for this study was determined using a calculation of comparisons between two means of Kt/V using data from a previous randomized controlled trial (Mohseni et al., 2013). This calculation determined a mean difference of 0.0335 and a standard deviation of 0.163, providing a sample size of 17 in each group. On the basis of an expected attrition rate of 30%, the total sample size for each group was set as 25. Of the 73 dialysis patients in the hospital, 68 patients met the inclusion criteria and agreed to participate. These 68 patients were allocated numbers, of which 50 were selected using computer-generated simple random sampling performed by a member of the research team. A nurse in the hemodialysis unit then randomly assigned the enrolled participants to either the treatment or control group. Because of the nature of the treatment intervention, blinding to allocation was not possible for either the participants or the clinical staff.
InstrumentsDemographic information and patient characteristics were collected at baseline. These included age, gender, length of time since commencement of hemodialysis, hemoglobin levels, dry weight, body mass index, blood flow rate, and systolic and diastolic blood pressure.
Fatigue and dialysis characteristics were assessed at baseline, at the midpoint (end of Week 4), and at the end of Week 8.
FatigueFatigue was assessed using the Fatigue Assessment Scale, which is a self-reported 10-item 5-point Likert-type scale (Shahid et al., 2011). Respondents are asked to report how they typically feel, ranging from never to always, using positive and negative scoring. Fatigue scores range from a minimum of 10 to a maximum of 50.
Dialysis characteristicsThis study assessed characteristics related to dialysis. Dialysis adequacy (Kt/V) was assessed using the second generation of the Daugirdas formula (Daugirdas, 1995):
Kt/V=−LnR−0.008t+4−3.5R×UF/W
K: Dialyser urea clearance rate (liters/minute)
t: Dialysis time (minutes)
V: Volume (liters)
Ln: Natural logarithm
R: Ureum postdialysis/ureum predialysis
UF: ultra filtration volume (liters)
W: Body weight (kilograms)
The URR was assessed in accordance with the Lowrie formula (National Kidney Foundation, 2015) using an online application MedCalc: hemodialysis Kt/V and URR
URR = (C0 − C)/C0C0 = predialysis ureum; C = postdialysis ureum
The findings reported here are part of a study that assessed additional variables, with depression and insomnia results reported elsewhere (Forwaty et al., 2019).
InterventionParticipants in the treatment group received two exercise sessions per week (Monday and Wednesday) for 8 weeks during their scheduled dialysis sessions in addition to standard care, whereas those in the control group received standard care only (Tuesday and Thursday). An assessment of exercise intensity was performed for participants in the treatment group at baseline by a member of the research team, and vital signs were recorded. Nurses in the hemodialysis unit and a physiotherapist showed the exercises to participants and then observed and monitored the patient's condition and measured vital signs using an observation checklist during the intervention. The measurement of exercise intensity was initiated from the start of the bike-riding movement for 20 minutes with heart rate measured using a fingertip pulse assessment. The desired exercise intensity of this assessment was 50%–60% of resting heart rate, calculated using Karvonen's formula for men = 206.9 − (0.67 × Age) and women = 206 − (0.88 × Age; Gulati et al., 2010). To monitor the intensity of the exercise, a member of the research team measured the patient's heart rate using a fingertip pulse to ensure the rate reached 50%–60% of the resting heart rate.
Exercise sessions for the treatment group involved flexibility/stretching and ROM exercises (such as simulated bike riding) for the upper and lower extremities. The hemodialysis process took 4.5 hours (270 minutes). Thirty minutes after the start of the hemodialysis process, the exercise was conducted for 30 minutes (5-minute warm-up, 20-minute main exercise, 5-minute cooldown). After the exercise session, the researcher observed the patient's condition for 30 minutes to ensure no issues, after which the patients completed the hemodialysis process.
The warm-up movements included flexibility/stretching exercises of the upper and lower extremities, which were repeated 8 times. These movements included moving the head to the left, to the right, and to the front followed by head rotation. The exercise continued with hand movements: flexing and stretching of the fingers, rotation of the wrists clockwise and anticlockwise, wrist flexion/extension, elbow flexion/extension, and shoulder rotation. The final warm-up movements focused on the legs: toe flexion/extension, ankle dorsiflexion/plantarflexion and rotation, knee flexion/extension, and hip abduction/adduction. In the 20-minute main exercises, movement flexibility and stretching similar to the warm-up stage were performed with 20 repetitions, after which the patients were asked to continue bike-riding movements or pedaling movements with both legs (as if riding a bicycle) until the 20-minute time point was achieved. The exercise was performed with patients in the semi-Fowler position, from which patients performed the pedaling movement at their own pace and ROM for comfort involving hip and knee flexion/extension. Finally, the 5-minute cooling-down stage repeated the movements of the warm-up with the addition of a final breathing exercise.
Statistical AnalysisThis was a two-arm experimental study with repeated measures, with descriptive statistics presented as frequencies, means, and standard deviations. Normality tests (Shapiro–Wilk's test) and homogeneity tests (Levene's test) were conducted to ensure the assumptions of the analyses were met. Repeated measures analysis of variance were used to assess the effect of exercise for the treatment and control groups, whereas between-group comparisons were assessed using a general linear model. Statistical analysis was performed using IBM SPSS Statistics 20.0 (IBM Inc., Armonk, NY, USA), and the sample size was calculated using Select Statistical Services online software.
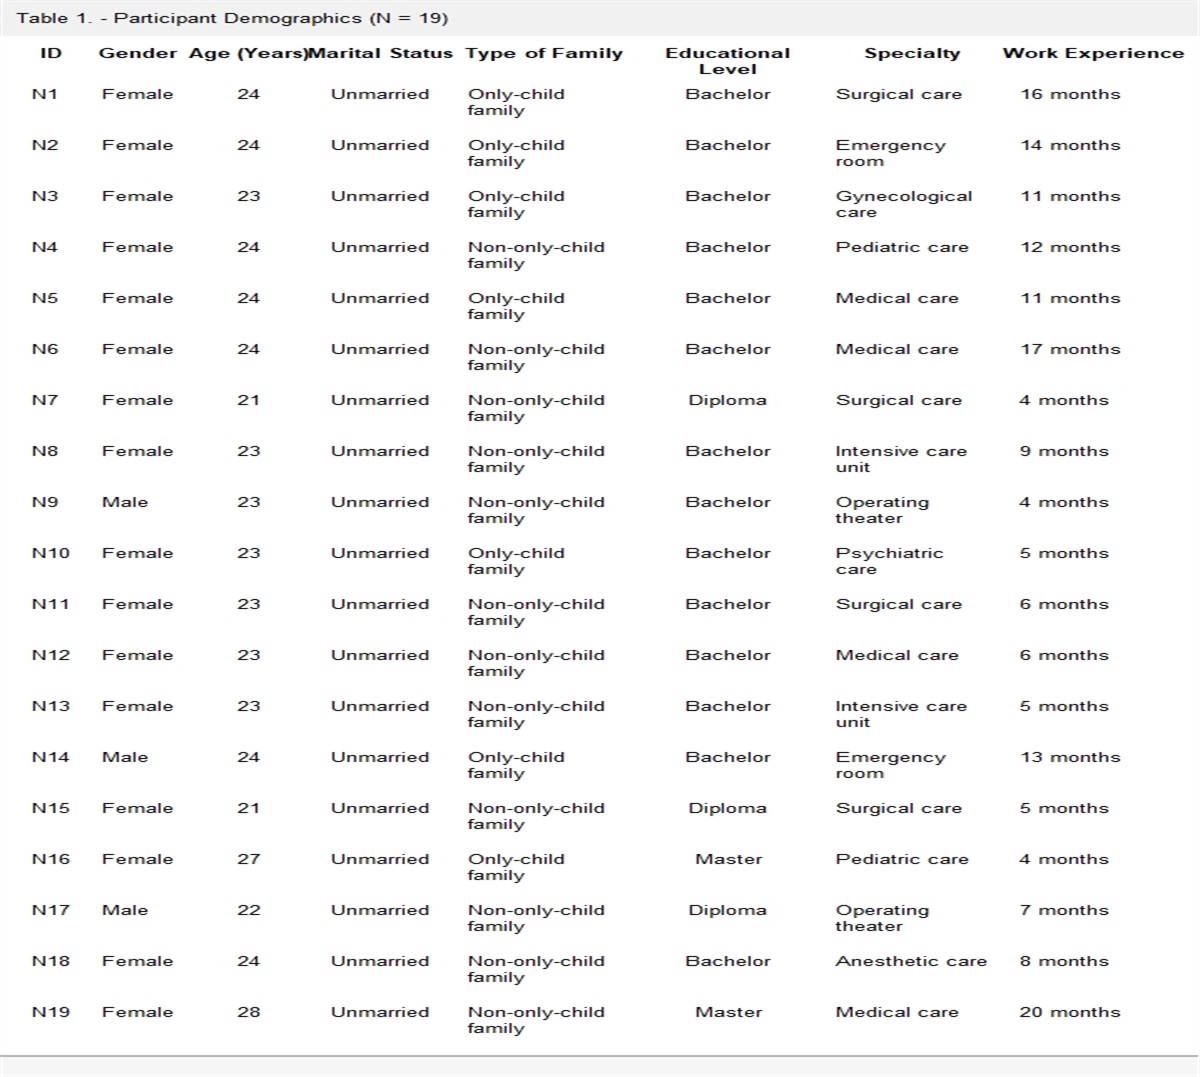
ResultsOf the 50 participants enrolled, three were unable to complete the study because of their health status, two were hospitalized (one with severe anemia and one with bleeding), and one participant experienced a seizure at home. There were no significant differences in the characteristics of the 47 participants between the two groups in terms of demographics or dialysis measures (Table 1).
Table 1. - Participant Characteristics at Baseline Treatment (n = 23) Control (n = 24) Characteristic Mean SD Mean SD p Age (years) 50.8 12.0 53.7 11.8 .650 Time on dialysis (years) 1.7 1.6 2.0 1.9 .693 Hemoglobin (g/dl) 10.2 0.9 9.9 0.6 .061 Dry weight (kg) 60.5 12.6 58.9 10.5 .331 Body mass index (kg/m2) 23.2 4.1 22.4 3.9 .364 Blood flow rate (ml/min) 217.4 18.6 217.5 20.3 .419 Blood pressure (mmHg) Systolic 132.8 13.0 136.1 13.4 .831 Diastolic 80.7 3.8 82.7 4.4 .579 n % n % p Gender .161 Male 15 65.2 18 75.0 Female 8 34.8 6 25.0 Etiology of ESRD .390 Hypertension 9 39.1 10 41.7 Diabetes 8 34.8 6 25.0 Nephrolithiasis 3 13.0 4 16.7 Other causes 3 13.0 4 16.7 Vascular access .194 Cimino 21 91.3 20 83.3 Catheter 2 8.7 4 16.7Note. ESRD = end-stage renal disease.
The results for dialysis adequacy (Kt/V and URR) for the treatment and control groups are compared in Table 2. There were no significant differences in the Kt/V (p = .946) and URR (p = .912) scores between the two groups at baseline. Over the three time points, the treatment group had higher Kt/V (p < .001) and URR (p < .001) scores at the midpoint compared with baseline and higher scores at the end of Week 8 compared with the midpoint. These scores showed significant improvements in dialysis adequacy for the treatment group compared with the control group over time for both measures (p < .001). No improvements for the control group were identified over the study period in terms of either Kt/V score (p = .786) or URR score (p = .907).
Table 2. - Comparison of Dialysis Adequacy (Kt/V and Urea Reduction Ratio) Between the Treatment and Control Groups Treatment (n = 23) Control (n = 24) Measurement Mean SD Mean SD Mean Difference [Lower, Upper CI] p a p b Kt/V < .001 Pretest 1.42 0.25 1.43 0.24 0.01 [−0.14, 0.15] .946 Fourth week 1.55 0.27 1.41 0.20 −0.14 [−0.28, 0.00] .053 Eighth week 1.61 0.22 1.42 0.17 −0.19 [−0.31, −0.07] .002 p Value c < .001 .786 Urea reduction ratio < .001 Pretest 68.90 6.39 68.70 6.21 −0.20 [−3.90, 3.50] .912 Fourth week 71.88 6.14 68.48 5.40 −3.40 [−6.80, −0.01] .049 Eighth week 73.39 5.01 68.74 4.49 −4.65 [−7.44, −1.85] .002 p Value c < .001 .907ap Value for the difference between the treatment group and the control group (the result of the time interaction and the groups). bp Value for the difference between the treatment group and the control group from all evaluations. cp Value for the difference between the three evaluations of each group.
The difference in dialysis adequacy between the treatment and control groups at each time point is also presented in Table 2. The Kt/V scores were higher for the treatment group compared with controls at both midpoint (mean difference = −0.14, p = .053) and the end of Week 8 (mean difference = −0.19, p = .002), although the difference at Week 4 was not significant. Similarly, the URR scores were higher for the treatment group compared with the control group at both the midpoint (mean difference = −3.40, p = .049) and the end of Week 8 (mean difference = −4.65, p = .002).
The average scores difference for Kt/V, URR, and fatigue in the treatment and control groups are presented in Figure 2. The average Kt/V score in the treatment group increased from 1.42 at baseline to 1.55 at the midpoint and 1.61 at the end of Week 8. In the control group, the average Kt/V score was consistent across the three time points (1.43 at baseline, 1.41 at the midpoint, and 1.42 at the end of Week 8). Similar results were found for the average of URR. The URR score for the treatment group also increased from 68.9% at baseline to 71.9% at the midpoint and 73.4% at the end of Week 8. For the control group, the average URR and Kt/V scores did not vary across the three assessment points.
 Figure 2.:
 Changes of Kt/V, URR, and Fatigue in the Treatment and Control Groups With Error Bars.
Differences in fatigue score were also found between the treatment and control groups (Table 3). Fatigue scores decreased across the three time points (p < .001) in the treatment group and increased in the control group across the three time points, resulting in a significant between-group difference at each time point (p < .001). Fatigue scores in the treatment group decreased from 27.7 at baseline to 26.1 at Week 4 and to 25.1 at Week 8. Fatigue scores in the control group increased from 27.5 at baseline to 27.6 at Week 4 and to 28.3 at Week 8. There were no significant between-group differences in fatigue score at baseline (p = .845) or Week 4 (p = .279). At study completion, the treatment group had a lower fatigue score than the control group (p = .031).
Table 3. - Comparison of Fatigue Score Between the Treatment and Control Groups Fatigue Score Treatment (n = 23) Control (n = 24) Mean Difference [95% CI] p a p b Mean SD Mean SD Pretest 27.74 4.73 27.46 5.03 −0.28 [−3.15, 2.59] .845 < .001 Fourth week 26.09 3.60 27.58 5.58 1.50 [−1.28, 4.27] .279 Eighth week 25.08 3.00 28.25 6.17 3.16 [0.29, 6.03] .031 p Value c < .001 .009ap Value for the difference between the treatment group and the control group (the result of the time interaction and the groups). bp Value for the difference between the treatment group and the control group from all evaluations. cp Value for the difference between the three evaluations of each group.
During the 8 weeks of intradialytic exercise, a significant increase in the average Kt/V and URR scores in the treatment group was observed. A 9% increase in Kt/V was observed at Week 4 and a 13% increase was observed at Week 8 for the treatment group, whereas URR increased by 4% at Week 4 and by 6% at the end of Week 8. In similar intervention studies, Parsons et al. (2006) found an 11% increase in Kt/V at Week 4, and Dobsak et al. (2012) found a 6% increase in URR after 6 weeks of treatment. Similarly, Mohseni et al. (2013) reported an 11% increase in URR and a 38% increase in Kt/V after an 8-week intervention.
The above-noted differences in results across studies may be related to variations in the frequency, type, and intensity of the exercises performed. Mohseni et al. (2013) included three sessions a week of aerobic movements, whereas the Parsons et al. (2006) and Dobsak et al. (2012) cohorts performed intradialytic cycling 3 times a week using a static bicycle ergometer set to the desired level of exercise intensity. Parsons et al.'s study used an exercise intensity of 70%, which was greater than that of Dobsak et al., which was set at a maximum intensity of 60%. Despite the differences in intensity, no significant difference was observed in terms of urea clearance.
Intradialytic ROM exercise, used as the intervention in this study, involves joint movements in both the upper and lower extremities that are similar to the movements described by Mohseni et al. (2013). Moreover, the exercise was modified by adding a bike-riding movement and a set exercise intensity. Although the intended intensity range was performed by the study participants, the variation in heart rates across participants may have an effect on the exercise benefit.
The observed differences in dialysis adequacy between the treatment and control groups appeared at Week 4 and continued through the end of Week 8. The effect on dialysis adequacy was observed for both the Kt/V and URR assessments. In addition to considering both predialysis and postdialysis uremic volumes, the volume of ultrafiltration and body weight were also taken into account, as these may influence the obtained results for Kt/V.
The findings of this study show that intradialytic exercises in the form of flexibility and stretching exercises or an ROM exercise regimen targeting the upper and lower extremities without requiring equipment increased dialysis adequacy. The average score of Kt/V and URR increased at the midpoint and the end of Week 8, which echoes Mohseni et al. (2013), who found improvements in both measures of dialysis adequacy after 8 weeks of exercise (p < .05). However, Afshar et al. (2010) found no significant improvement in Kt/V after 8 weeks of exercise (p > .05). However, this study found differences in creatinine and highly sensitive C-reactive protein. The type and intensity of the exercise treatment interventions may explain the variations in outcomes. In Afshar et al., physical exercise involved aerobic movements with an intensity of 12–16 on the Borg Rating of Perceived Exertion Scale and a resistance exercise with an intensity of 15–17 (Borg scale).
The increase in dialysis adequacy in the treatment group indicates that exercise performed during hemodialysis or intradialytic exercise increases muscle blood circulation and enhances the vasodilation of muscle blood vessels. Consequently, this exercise increases the flux of urea and toxins from the tissue to the vascular system for later discarding through the dialyzer (Howden et al., 2015).
There were significant changes in fatigue scores in both the treatment and control groups. In the treatment group, the fatigue score decreased by 9.6% across the study, whereas the fatigue score increased in the control group by 2.8%. This indicates that the fatigue associated with ongoing dialysis may be mitigated by exercise. Routine exercise performed regularly, at an appropriate level of intensity, and without equipment may produce improvements in physical performance characteristics. This finding agrees with Anding et al. (2015), who found a 120% increase in muscle strength in the high-adherence group as compared with a 40%–50% increase in the moderate-adherence group after performing 1 year of an exercise. Moreover, Shemy et al. (2016) found that 83.3% of respondents experienced high levels of fatigue before exercise, which decreased to 5% after 3 months of exercise. Similarly, Soliman (2015) found that fatigue scores for those not receiving an exercise intervention increased by 11.8% over 8 weeks of dialysis. Bossola et al. (2015) explained that physical exercise lowers fatigue by improving the muscle's oxidative phosphorylation and the muscle mitochondrial structure, improving muscle mass, and increasing the formation of myosin heavy chains. Exercise stimulates the growth of small blood vessels in the muscle, which increases the efficiency of oxygen uptake by the muscle, improves circulation, lowers blood pressure, and removes metabolic waste such as lactic acid from the muscle (Matsuzawa et al., 2017).
This study has several limitations. For the exercise intervention, movements/activities were modified so they could be undertaken during dialysis. These modifications, such as using simulating bike-riding movements rather than stationary exercise bikes, may limit the reliability and validity of the intervention. Heart rate intensity was assessed using a fingertip device that measures the radial pulse, which may be less accurate in assessing exercise intensity. Because of the nature of the treatment intervention, it was not possible to blind the participants or researchers supervising the exercise sessions, which may potentially bias the results. Further studies using larger sample sizes, tighter inclusion criteria, and different types, durations, and intensities of exercise may more effectively identify the requirements of exercise as a supplementary therapy for hemodialysis patients.
ConclusionsIn summary, intradialytic exercise in the form of ROM movements designed to achieve 50%–60% intensity of the resting heart rate may significantly increase the effectiveness of dialysis by increasing blood flow in the targeted muscle groups. This 8-week program also had a positive impact on fatigue scores in hemodialysis patients, with the treatment group showing reductions in fatigue over time. Differences in exercise programs in terms of type, duration, intensity, and frequency may affect the outcomes. Intradialytic ROM exercises are economical and easy to implement in the clinical environment and provide benefits to hemodialysis patients.
AcknowledgmentsWe would like to extend our appreciation to the patients, families, and nurses at the study site for their participation and support.
Author ContributionsStudy conception and design: HM, EF, EO
Data collection: HM, EF, EO
Data analysis and interpretation: All authors
Drafting of the article: HM, EF, MC, DV, DPL
Critical revision of the article: HM, EF, MC, DV
References Afshar R., Shegarfy L., Shavandi N., Sanavi S. (2010). Effects of aerobic exercise and resistance training on lipid profiles and inflammation status in patients on maintenance hemodialysis. Indian Journal of Nephrology, 20(4), 185–189. https://doi.org/10.4103/0971-4065.73442 Aliasgharpour M., Zabolypour S., Asadinoghabi A., Haghani H., Lesanpezeshki M. (2018). The effect of increasing blood flow rate on severity of uremic pruritus in hemodialysis patients: A single clinical trial. Journal of the National Medical Association, 110(3), 270–275. https://doi.org/10.1016/j.jnma.2017.04.008 Anding K., Bär T., Trojniak-Hennig J., Kuchinke S., Krause R., Rost J. M., Halle M. (2015). A structured exercise programme during haemodialysis for patients with chronic kidney disease: Clinical benefit and long-term adherence. BMJ Open, 5(8), Article e008709. https://doi.org/10.1136/bmjopen-2015-008709 Barcellos F. C., Santos I. S., Umpierre D., Bohlke M., Hallal P. C. (2015). Effects of exercise in the whole spectrum of chronic kidney disease: A systematic review. Clinical Kidney Journal, 8(6), 753–765. https://doi.org/10.1093/ckj/sfv099 Barzegar H., Moosazadeh M., Esmaeili R. (2016). Evaluation of dialysis adequacy in hemodialysis patients: A systematic review. Urology Journal, 13(4), 2744–2749. Bossola M., Di Stasio E., Antocicco M., Panico L., Pepe G., Tazza L. (2015). Fatigue is associated with increased risk of mortality in patients on chronic hemodialysis. Nephron, 130(2), 113–118. https://doi.org/10.1159/000430827 Brys A. D. H., Lenaert B., Van Heugten C. M., Gambaro G., Bossola M. (2019). Exploring the diurnal course of fatigue in patients on hemodialysis treatment and its relation with depressive symptoms and classical conditioning. Journal of Pain and Symptom Management, 57(5), 890–898.e4. https://doi.org/10.1016/j.jpainsymman.2019.02.010 Daugirdas J. T. (1995). Simplified equations for monitoring Kt/V, PCRn, eKt/V, and ePCRn. Advances in Renal Replacement Therapy, 2(4), 295–304. https://doi.org/ 10.1016/S1073-4449(12)80028-8 Dobsak P., Homolka P., Svojanovsky J., Reichertova A., Soucek M., Novakova M., Dusek L., Vasku J., Eicher J.-C., Siegelova J. (2012). Intra-dialytic electrostimulation of leg extensors may improve exercise tolerance and quality of life in hemodialyzed patients. Artificial Organs, 36(1), 71–78. https://doi.org/10.1111/j.1525-1594.2011.01
留言 (0)