
記住我


Lemborexant (LEM) is a dual orexin receptor antagonist (DORA) approved in multiple countries, including the the United States, Japan, Canada, Australia and several Asian countries, for the treatment of insomnia in adults. The sleep-promoting mechanism of action of DORAs is different from benzodiazepines and “z drugs.” Antagonism of orexin receptors by DORAs suppresses inappropriate wakefulness, in contrast to benzodiazepine hypnotics and z drugs that instead promote sleep through a GABAergic mechanism of action.1,2 As required for US marketing approval for new compounds with central nervous system–sedating effects, the abuse potential of LEM was assessed in a phase 1 human abuse potential study in accordance with US Food and Drug Administration (FDA) guidance.3
In the pivotal phase 3 studies in subjects with insomnia disorder, Study E2006-G000-304 (Study 304; SUNRISE-1; NCT02783729) and Study E2006-G00–303 (Study 303; SUNRISE-2; NCT02952820), LEM provided significant benefits for sleep onset and sleep maintenance compared with placebo (PBO).4,5 At therapeutic doses of LEM 5 mg (LEM5) or 10 mg (LEM10), LEM was well tolerated with low rates of discontinuation. Adverse event (AE) rates were low and mostly mild, with somnolence the most commonly reported AE.4,5 The rate of AEs associated with abuse potential was low (ie, there was no euphoria reported) for subjects receiving LEM in the phase 3 studies.
Although a higher incidence of potential abuse-related treatment-emergent AEs (TEAEs) was observed with LEM compared with PBO in the phase 3 studies,4,6 this effect was driven by somnolence (rates of somnolence were 1.6%, 8.6%, and 13.1% for PBO, LEM5, and LEM10 treatment groups, respectively, during the PBO-controlled period of Study 303).6 When adjusted by duration of exposure, overall incidence and rates (subjects per patient-year) of TEAEs related to abuse potential were 0.2, 0.3, and 0.4 for PBO, LEM5, and LEM10, respectively. When adjusted by duration of exposure, the overall rates (events per patient-year) of TEAEs related to abuse potential were 0.3, 0.5, and 0.6 for PBO, LEM5, and LEM10, respectively, with overall rates higher for LEM5 and LEM10 compared with PBO.7
Lemborexant binds selectively to orexin-1 and orexin-2 receptors with high affinity, with no evidence of off-target activity at receptors known to be associated with abuse such as dopamine or GABAA receptors.2 In addition, LEM tablets are not readily manipulated for the purposes of intravenous administration (data on file) owing to limited solubility in water. In a pooled analysis of the 2 pivotal phase 3 studies, there was no evidence of abuse or diversion of study medication during clinical development.4,6,7
In nonclinical testing, LEM was not associated with physical dependence, reinforcing effects, or cross-generalization to zolpidem (ZOL).7,8 No evidence of physical dependence was observed in Sprague-Dawley rats following 28-day dosing with LEM at doses of up to 600 mg/kg per day. In studies with rhesus monkeys, no active self-administration or gross behavioral changes that suppressed lever pressing were observed during the self-administration period with LEM, and LEM had no reinforcing effect on intravenous self-administration. In a drug discrimination study in rats, LEM, at doses up to 1000 mg/kg, did not cross-generalize to the ZOL (3 mg/kg) training stimulus, whereas SUV demonstrated partial generalization to ZOL as previously reported.2,7,9
Two previous studies have evaluated the abuse potential of the DORAs SUV and almorexant among recreational drug users.10,11 In each of these studies, ZOL differed significantly from PBO on a measure of drug-liking, establishing the validity of each study. SUV (at doses of 40, 80, and 150 mg) and almorexant (200, 400, and 1000 mg) differed significantly from PBO for drug-liking, indicating drug abuse potential. Almorexant 1000 mg and all doses of SUV displayed similar drug-liking to ZOL, but less drug-liking was observed versus ZOL for almorexant 200 and 400 mg.9,10
ZOL and SUV were included in this study as positive controls with known drug-liking, after consultation with the FDA. ZOL was selected as it has been commonly used as a positive control; SUV was added because it shares the same mechanism of pharmacologic action as LEM. Both ZOL and SUV have known abuse potential.10–13
METHODSStudy E2006-A001-103 (Study 103; NCT03158025) was a single-center, single-dose, randomized, double-blind, PBO- and active-controlled, 6-way, crossover study conducted from April 19, 2017, to July 4, 2018, in Toronto, Ontario, Canada. The study design was consistent with guidelines of the US FDA for the assessment of abuse potential in humans.3 The protocol and informed consent form were approved by both Health Canada and an institutional review board, and the study adhered to Good Clinical Practice guidelines and the Declaration of Helsinki.
ObjectivesThe primary objective of this study was to evaluate the abuse potential of single oral daytime doses of LEM compared with PBO in healthy, nondependent, recreational sedative users as determined by mean maximum (peak) effect (Emax) for “at this moment” drug-liking.
Secondary objectives of this study were to confirm the abuse potential of ZOL and SUV versus PBO as determined by the Emax for “at this moment” drug-liking (to establish study validity), to assess the abuse potential of LEM compared with ZOL and SUV as determined by Emax for “at this moment” drug-liking, and to evaluate the safety and tolerability of LEM compared with ZOL, SUV, and PBO.
Key secondary endpoints of cognitive performance of subjects in this study receiving LEM compared with ZOL, SUV, or PBO were also examined as a part of the assessment of the potential for drug abuse for LEM and are described in a separate article.
SubjectsSubjects were healthy men and women 18 to 55 years of age who had body mass index of 18 to 33 kg/m2 and weighed at least 50 kg. Each subject was a current sedative user who had used sedatives (eg, ZOL, benzodiazepines) for recreational (nontherapeutic) purposes (ie, for psychoactive effects) at least 5 times in the past year and at least once in the 12 weeks before screening. Subjects were required to be able to discriminate both SUV 40 mg and ZOL 30 mg from PBO on the drug-liking visual analog scale (VAS), show consistent responses on other subjective drug effect measures, and to tolerate study treatment (eg, no episodes of vomiting within the first 3 hours postdose, no unarousable sedation within 4 hours postdose) during the qualification phase. Subjects were excluded if they met the criteria for substance or alcohol dependence in the past 2 years, had ever been in a substance or alcohol rehabilitation program, or had clinically significant illness or certain medical disorders. A complete list of enrollment criteria is available on clinicaltrials.gov.
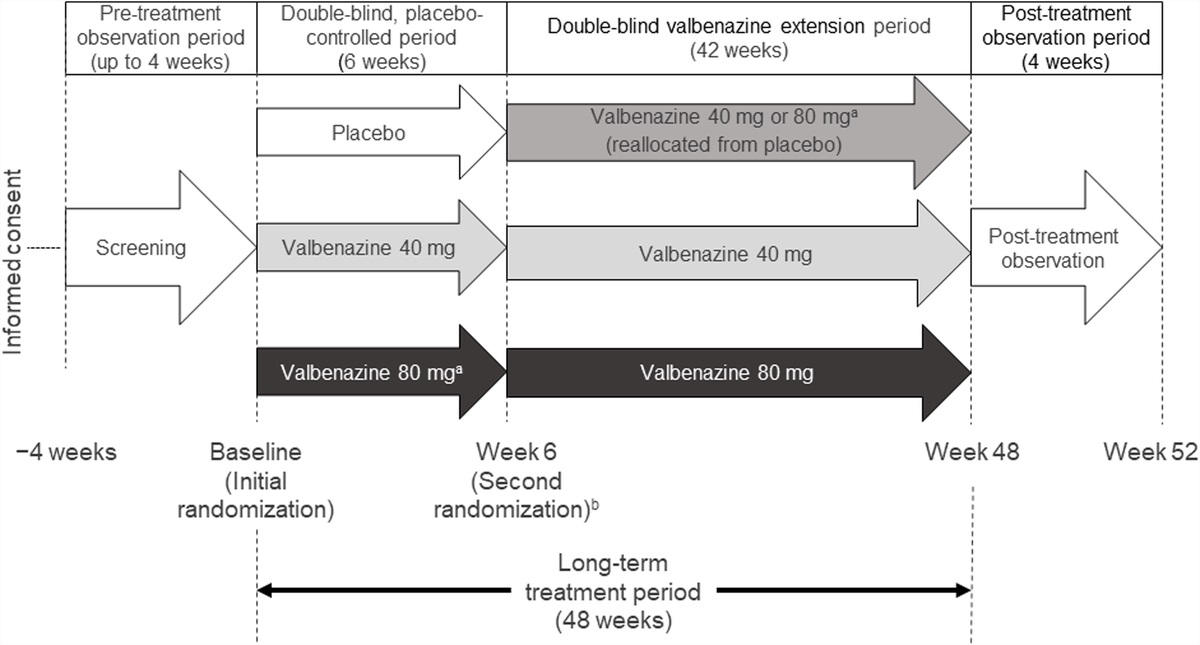
Study Design and TreatmentThis was a single-dose, randomized, double-blind, crossover study with 3 phases: a qualification phase, a treatment phase, and a follow-up phase (Fig. 1). Subjects were assigned to treatment sequences based on a computer-generated randomization scheme according to a Williams' square design. The following treatments were administered orally during both the qualification and treatment phases: PBO, ZOL immediate release 30 mg, SUV 40 mg (SUV); and in the treatment phase, LEM10, LEM 20 mg (LEM20), and LEM 30 mg (LEM30).
 FIGURE 1:
 Study design. PBO, placebo; ZOL, zolpidem 30 mg; SUV, suvorexant 40 mg; LEM10, lemborexant 10 mg; LEM20, lemborexant 20 mg; LEM30, lemborexant 30 mg.
A 40-mg dose of SUV was chosen as the most appropriate to produce adequate abuse-related responses without exposing subjects to unwanted AEs; the 30-mg dose of ZOL was selected for similar reasons.10 The approved starting dose of SUV for insomnia is 10 mg, with a maximum of 20 mg for adults and 5 mg and 16 mg for the elderly.12 Approved doses of ZOL immediate release are 5 mg for women and elderly and 5 mg to 10 mg for adult men.14 The maximum recommended dose of LEM for treatment of insomnia is 10 mg daily.15 A range of LEM doses were evaluated that were known to be well tolerated and included both a therapeutic dose (10 mg) and 2 supratherapeutic doses (20 and 30 mg), as recommended by the FDA guidance.
Study drug was administered in the morning following an overnight fast of at least 8 hours on designated treatment days (days 1, 4, and 7 during the qualification phase and day 1 during the treatment phase). During the qualification phase and treatment phase, subjects and study personnel were blinded to the treatment codes. Unblinding procedures for the treatment phase were initiated after all assessments were completed on day 10 for the last subject.
All nonstudy medications taken by any subject (including over-the-counter) starting from the day of informed consent until the completion of the final visit of the follow-up stage were recorded as concomitant medication, which were prohibited unless prescribed by investigators to treat clinical events. Concomitant medications could be exempted by the investigators and the sponsor, if it was determined that the medication would be unlikely to affect the study results or subject safety (eg, topical medications).
The purpose of the qualification phase was to confirm the subject was able to distinguish ZOL and SUV versus PBO. During this phase, subjects received a single oral dose of ZOL 30 mg, SUV 40 mg, or PBO in a randomized, double-blind, double-dummy, 3-period crossover manner under fasting conditions. Subjects were required to distinguish ZOL 30 mg and SUV 40 mg from PBO on the “at this moment” drug-liking VAS, defined as a ≥15-point peak (Emax) increase for drug-liking in response to ZOL and SUV relative to PBO following drug administration. In addition, on the “at this moment” drug-liking VAS, the subject must have indicated a peak score of ≥65 in response to ZOL and SUV and an acceptable peak PBO response of 40 to 60. Treatments were separated by 3 days, and subjects remained in the clinic for 10 days. Subjects who could successfully discriminate and reported they liked ZOL and SUV versus PBO during the qualification phase, and tolerated study treatment, were eligible for randomization into the treatment phase.
The treatment phase lasted for at least 74 days and consisted of 6 in-clinic treatment periods of 4 days each. Treatments (PBO, ZOL, SUV, LEM10, LEM20, and LEM30) were administered in a triple-dummy fashion, and each treatment period was separated by a washout interval of at least 14 days. The follow-up phase consisted of 1 visit approximately 14 days after the last study drug administration or at the time of early study discontinuation.
Overview of Outcome MeasuresDemographic characteristics evaluated in this study included age, sex, race, and body mass index. The primary drug abuse outcome measure was the VAS for “at this moment” drug-liking. Key secondary endpoints were the overall drug-liking VAS, take-drug-again VAS, high VAS, and good-drug-effects VAS. Additional secondary endpoints included hypothetical subjective drug value (SDV), stoned VAS, bad-effects VAS, and any-effects VAS. Overall drug-liking VAS, take-drug-again VAS, and SDV were measured at least 12 hours after drug administration and were considered global drug effects. Good-effects VAS, stoned VAS, and high VAS were considered to measure positive effects, and the bad-effects VAS was considered to reflect a negative drug effect. Sedation endpoints included alertness/drowsiness VAS, Addiction Research Center Inventory for the pentobarbital-chlorpromazine-alcohol group (ARCI PCAG), and observer's assessment of alertness/sedation (OAA/S).
Key secondary endpoints also included assessments of the cognitive performance of study subjects following treatment with 10-, 20-, and 30-mg doses of LEM compared with PBO, ZOL, and SUV. These assessments comprised psychomotor evaluations (Choice Reaction Time and Diverted Attention Test assessments) following study drug administration that were performed as part of the primary goal of Study 103 to evaluate LEM abuse potential. The details and results of these assessments are described elsewhere.
The following parameters were evaluated for each pharmacodynamic outcome measure, as appropriate: Emax, minimum (peak) effect (Emin), maximum change from baseline, and minimum change from baseline. These parameters were assessed over all observations for each measure (between 3 and 13 observations during the 48 hours after study drug administration).
Safety outcome measures included TEAEs, clinical laboratory evaluations, vital signs, electrocardiograms, and physical examinations. Treatment-emergent AEs related to drug abuse potential, including AEs specific to central nervous system–depressant effects, stimulation and anxiety symptoms, perceptual disturbances/psychomimetic effects, mood disorders and disturbances, and mental and cognitive impairment, were prespecified and analyzed.
Description of Pharmacodynamic Outcome MeasuresNine pharmacodynamic measures were formatted as VASs, which were scored as an integer from 0 to 100. Certain VAS measures (“at this moment” drug-liking, overall drug-liking, take-drug-again, alertness/drowsiness) were administered as bipolar measures, with the neutral point equaling 50 and labeled with an anchor such as “neither like nor dislike.” Bipolar scales also had specific anchors at 0 and 100, that is, “strong disliking” and “strong liking,” respectively, for drug-liking and overall drug-liking, or “very drowsy” and “very alert” for alert/drowsiness. The key wording of the VAS measures was largely similar to measures in previous abuse potential studies of DORAs10,11 (Supplemental Materials, Table S1, https://links.lww.com/JCP/A813). The remaining VASs (good effects, bad effects, any effects, high, and stoned) were administered as unipolar measures, with anchors such as “not at all” (0) and “extremely” (100). The “at this moment” drug-liking, good effects, stoned, high, bad effects, alertness/drowsiness, and any-effects VAS measures were administered at 0, 0.25, 0.5, 1, 1.5, 2, 3, 4, 5, 6, 8, 12, and 24 hours after study drug administration. In addition, the stoned, high, and alertness/drowsiness VASs were administered predose. The overall drug-liking and take-drug-again VAS measures were administered at 12, 24, and 48 hours after study drug administration. Emax or Emin was evaluated for each VAS measure as appropriate (based on the direction of the measure that indicated a stronger effect).
The hypothetical SDV measure16,17 involved a series of independent, theoretical, forced choices between the drug administered and different monetary values. The task started at the geometric mean of the range of possible values from $0.25 to $50.00, rounded up to the nearest 25 cents. Subjects were asked to choose between receiving another dose of the drug to take home or an envelope containing a specified amount of money. (Subjects did not receive either the drug or the money described in the choices.) Depending on the answer to each question, the monetary value in the next question was either higher or lower. At the end of the procedure (generally 6 questions total), the procedure estimated the crossover point at which a subject was indifferent between choosing the drug and choosing money. The SDV measure was administered at 12, 24, and 48 hours after study drug administration. The Emax of the SDV was also evaluated.
The ARCI PCAG scale18–20 measures sedating and intoxicating effects. This scale was originally developed at the Addiction Research Center (Intramural Research Program of the US National Institute on Drug Abuse) based on the differentiating and dose-related sedating and intoxicating effects that were produced by the administration of pentobarbital, chlorpromazine, and alcohol.18,19 The ARCI PCAG measure was administered at 1, 2, 4, and 8 hours after study drug administration. The Emax of the ARCI PCAG score was also evaluated. The OAA/S scale21 measures level of alertness in subjects who are sedated and includes categories for responsiveness, speech, facial expression, and eyes. The scale is scored as a composite score, defined as the lowest score in any 1 of the 4 assessment categories, and a sum score, calculated as the total of the scores in the 4 assessment categories. Lower scores indicate greater sedation. The OAA/S scale was administered predose and at 0.5, 1, 1.5, 2, 3, 4, 6, 12, and 24 hours after study drug administration. The Emin of the OAA/S scale score was also evaluated. Subjects were roused if they fell asleep during a scheduled assessment following instructions included in the OAA/S assessment.
Treatment Phase AnalysisDuring the treatment phase, 3 hypotheses were tested for the primary and key secondary endpoints. A description of the structure of the analyses used with details of the 3 hypotheses is provided in the Supplemental Methods, https://links.lww.com/JCP/A813.
Statistical AnalysesPharmacodynamic analyses were performed in the completers analysis set, defined as subjects who received all study treatments and completed all treatment periods in the treatment phase and had at least 1 “at this moment” drug-liking VAS score within 2 hours of the estimated time to maximum plasma drug concentration for each treatment, regardless of protocol deviations.
Safety analyses were performed in the safety analysis set, defined as subjects who received at least 1 dose of study drug during the treatment phase and had at least 1 postdose safety assessment.
For each endpoint, the mixed-effects model included treatment, period, and treatment sequence as fixed effects and subject nested within treatment sequence as a random effect, in accordance with FDA guidelines.3 As necessary, first-order carryover effects and baseline (predose) measurements were included in the model. Least squares means, 95% confidence intervals, and P values for treatment differences were derived from the mixed-effects models. P values were provided for the effects and the contrasts. Pharmacodynamic endpoints were analyzed using models, if the residuals from the model were normally distributed. If the residuals from the mixed model were not normally distributed, paired t tests were used to assess mean treatment differences, if the distribution of paired differences was normal or symmetric. If paired differences were not normally distributed, the Wilcoxon signed rank test was used to assess median treatment differences. Details of the statistical method used to analyze each outcome measure are provided in the Supplemental Methods, https://links.lww.com/JCP/A813. Multiple comparison adjustments were not made.
In the assessments of the primary and key secondary endpoints, for comparisons of LEM versus PBO, P > 0.05 indicates that LEM and PBO are significantly different. This is a result of the hypothesis testing structure. For all other comparisons of the primary and key secondary endpoints and for all other endpoints, P < 0.05 indicates a statistically significant difference.
RESULTS Qualification Phase: Subject Disposition and FindingsA total of 225 individuals were screened, of which 88 were screen failures, and a further 30 passed screening but were not randomized into the qualification phase. Of the 107 subjects randomized into the qualification phase (Fig. 2), 35 (32.7%) were unable to distinguish SUV 40 mg from PBO with a margin of 15 points on the “at this moment” drug-liking VAS, and 22 (20.6%) were unable to distinguish ZOL 30 mg from PBO (Fig. 2; these figures include 15 subjects who were unable to distinguish either of the positive controls from PBO). In total, 42 subjects (39.3%) were discontinued because they could not distinguish one or both of the positive controls from PBO at the required margin of 15 points on the drug-liking VAS.
 FIGURE 2:
 Subject disposition. PBO, placebo; SUV, suvorexant 40 mg; ZOL, zolpidem 30 mg.
Overall, 68 subjects (63.6%) were discontinued during the qualification phase. Among 32 eventual qualification completers, mean drug-liking VAS Emax values for ZOL 30 mg and SUV 40 mg during the qualification phase were 89.0 (range, 67–100) and 89.8 (range, 68–100), respectively, compared with 50.4 (range, 50–52) for PBO. This resulted in a mean difference from PBO of 38.6 (range, 17–50) and 39.4 (range, 18–50) points for ZOL and SUV, respectively.
During the qualification phase, 13 subjects (12.1%) were discontinued because of AEs, including 10 subjects who experienced nausea, vomiting, or retching. Five subjects (4.7%) were unable to complete pharmacodynamics measures, and 8 subjects (7.5%) discontinued for other reasons.
Treatment Phase: Subject Disposition and CharacteristicsThirty-nine subjects continued from the qualification phase to the treatment phase (safety analysis set; Fig. 2). During the treatment phase, 7 subjects withdrew early (none owing to AEs), and 32 subjects completed the treatment phase (completer analysis set). The 39 subjects in the safety analysis set had a mean age of 36.0 (SD, 8.6) years; 30 (76.9%) were male; 29 (74.4%) were White; and subjects had used sedatives recreationally a mean of 83.5 (SD, 70.5) times in the previous year (Table 1).
TABLE 1 - Baseline Characteristics (Safety Analysis Set) Parameter N = 39 Age, y Mean (SD) 36.0 (8.6) Median (range) 36.0 (18–50) Sex, n (%) Male 30 (76.9) Female 9 (23.1) Race, n (%) White 29 (74.4) Black or African American 4 (10.3) Asian 2 (5.1) American Indian or Alaskan Native 1 (2.6) Other 3 (7.7) BMI, mean (SD), kg/m2 25.5 (2.7) Recreational sedative use in past year, n (%) Depressants 39 (100) Opioids and morphine derivatives 25 (64.1) No. times sedatives* used recreationally in past year, mean (SD) 83.5 (70.5)*Sedatives include “depressants” and “opioids and morphine derivatives.”
BMI, body mass index.
The difference in mean “at this moment” drug-liking VAS Emax values was compared between the positive controls (ZOL 30 mg and SUV 40 mg) and PBO. When applying a validation margin of 15, the differences in mean Emax values for the positive controls and PBO, were not significantly different (Fig. 3; Supplemental Materials, Table S2, https://links.lww.com/JCP/A813). When applying a validation margin of 11, mean Emax values for ZOL and SUV were significantly greater compared with PBO, thereby confirming study validity.
 FIGURE 3:
 “At this moment” drug-liking VAS response to PBO, ZOL, SUV, and LEM. The primary endpoint was maximum (peak) effect (E max). A, LSM (95% CI) differences in E max between treatments. Validation margins of 11 and 15 points for the difference in means between the positive controls (ZOL and SUV) and PBO are indicated. B, Mean (SE) drug-liking VAS score over time for each treatment group. CI, confidence interval; E max, maximum (peak) effect; LEM10, lemborexant 10 mg; LEM20, lemborexant 20 mg; LEM30, lemborexant 30 mg; LSM, least squares mean; PBO, placebo; SE, standard error; SUV, suvorexant 40 mg; VAS, visual analog scale; ZOL, zolpidem 30 mg.
Primary EndpointFor each LEM dose, mean “at this moment” drug-liking Emax values were significantly greater than values for PBO, as shown in Figure 3B (Supplemental Materials, Table S2, https://links.lww.com/JCP/A813). On this measure, LEM was not significantly different from ZOL 30 mg or SUV 40 mg. For all active agents (ZOL, SUV, and LEM), “at this moment” drug-liking values rose rapidly postdose, reached Emax (peak) in the drug-liking range of the scale at 1.5 to 3 hours, and then declined over time to reach a stable level at approximately 8 hours after drug administration (Fig. 3B). Mean scores for PBO remained neutral (close to 50 points) throughout the assessment time course. Overall, the results do not show evidence of a dose response for LEM (higher doses of LEM having a higher potential for abuse) (Fig. 3).
Secondary EndpointsFor each of the key secondary endpoints (overall drug-liking VAS, take-drug-again VAS, high VAS, and good-drug-effects VAS), the mean Emax for each active agent (ZOL 30 mg, SUV 40 mg, and all doses of LEM) was significantly greater than the Emax for PBO (Table 2). For each key secondary endpoint, there were no significant differences between any dose of LEM compared with ZOL 30 mg or SUV 40 mg. Similarly, for the SDV, mean Emax values were significantly greater for all active agents compared with PBO, but there were no significant differences for any dose of LEM compared with ZOL or SUV (Table 2).
TABLE 2 - Summary of Direction of Between-Treatment Differences of Means for Key Secondary, Additional, and Sedation Endpoints (Completer Analysis Set) ZOL–PBO* SUV–PBO* LEM10–PBO † LEM20–PBO † LEM30–PBO † ZOL–LEM10 ‡ ZOL–LEM20 ‡ ZOL–LEM30 ‡ SUV–LEM10 ‡ SUV–LEM20 ‡ SUV–LEM30 ‡ Key secondary endpoints§ Overall drug-liking VAS E max > > > > > NS NS NS NS NS NS Take-drug-again VAS E max > > > > > NS NS NS NS NS NS High VAS E max > > > > > NS NS NS NS NS NS Good effects VAS E max > > > > > NS NS NS NS NS NS Additional endpoints§ SDV E max > > > > > NS NS NS NS NS NS Stoned VAS E max > > > > > NS NS NS < < < Bad effects VAS E max > > > > > > NS NS < < < Any effects VAS E max > > > > > NS NS < < < < Sedation endpoints Alertness/drowsiness VAS∥E min < < < < < > > > > > > ARCI PCAG¶E max > > > > > NS NS NS NS < < OAA/S composite score#E min < < < < < < < < NS > > OAA/S sum score#E min < < < < < < < < NS NS >> Indicates between-treatment difference in means is positive and statistically significant; < indicates between-treatment difference in means is negative and statistically significant; NS indicates difference is not statistically significant.
*For positive control (ZOL and SUV) versus PBO comparisons for key secondary endpoints, hypothesis tests were constructed as follows: H0: μC – μP ≤ 11 vs HA: μC – μP > 11, where C = positive control (ZOL and SUV) and P = PBO. For additional endpoints, comparisons tested the null hypothesis that the difference of the means between treatment groups is zero.
†For LEM versus PBO comparisons for key secondary endpoints, hypothesis tests were constructed as follows: H0: μT − μP ≥ 11 versus HA: μT − μP < 11, where T = test drug (LEM) and P = PBO. For additional endpoints, comparisons tested the null hypothesis that the difference of the means between treatment groups is zero.
‡For LEM versus positive control (ZOL and SUV) comparisons for key secondary endpoints, hypothesis tests were constructed as follows: H0: μC − μT ≤ 0 versus HA: μC − μT > 0, where C = positive control (ZOL and SUV) and T = test drug (LEM). For additional endpoints, comparisons tested the null hypothesis that the difference of the means between treatment groups is zero.
§For the key secondary and additional endpoints, higher scores on each measure indicate a larger effect.
∥For the alertness/drowsiness VAS, lower scores indicate greater drowsiness. For example, peak drowsiness was less (Emin was larger) for PBO versus active treatments.
¶For the ARCI PCAG scale, higher scores indicate greater sedation.
#For the OAA/S composite and sum scales, lower scores indicate greater sedation.
ARCI PCAG, Addiction Research Center Inventory, pentobarbital-chlorpromazine-alcohol group; Emax, maximum (peak) effect; Emin, minimum (peak) effect; LEM, lemborexant; LEM10, lemborexant 10 mg; LEM20, lemborexant 20 mg; LEM30, lemborexant 30 mg; NS, not significant; OAA/S, observer’s assessment of alertness/sedation; PBO, placebo; SUV, suvorexant 40 mg; VAS, visual analog scale; ZOL, zolpidem 30 mg.
For the additional endpoints stoned VAS, bad-effects VAS, and any-effects VAS, each active agent had a significantly higher mean Emax value (stronger effect) than PBO (Table 2). For each of these 3 endpoints, each dose of LEM had a significantly stronger effect than SUV 40 mg. In addition, LEM30 had a significantly stronger effect for any-effects VAS than ZOL 30 mg, and LEM10 had a lower mean Emax value (weaker effect) for bad-effects VAS than ZOL.
For endpoints related to sedation (alertness/drowsiness VAS, ARCI PCAG, and the OAA/S composite and sum scores), each active agent caused significantly greater sedative effects than PBO (Table 2). Each dose of LEM caused significantly stronger sedative effects than ZOL 30 mg based on the alertness/drowsiness VAS, but significantly weaker sedative effects than ZOL based on the OAA/S composite and sum scores. Based on the alertness/drowsiness VAS, ARCI PCAG, and OAA/S composite score, LEM20 and LEM30 caused significantly greater sedative effects than SUV 40 mg (Table 2). Values for findings for secondary endpoint measures are shown in Supplemental Materials, Table S3, https://links.lww.com/JCP/A813.
SafetyIncidence of TEAEs during the treatment phase was greater with ZOL 30 mg, SUV 40 mg, and all doses of LEM compared with PBO (Table 3). The most common TEAE was somnolence, which was experienced by >85% of subjects after receiving each active treatment. This finding was expected, because LEM, SUV, and ZOL are sleep-promoting drugs that were administered in the morning. After receiving ZOL, 14.3% of subjects experienced dizziness, and 28.6% experienced diplopia. Headache was experienced by >14% of subjects receiving ZOL, LEM10, and LEM20. Otherwise, no TEAE was experienced by ≥12% of subjects after receiving any treatment (Table 3).
TABLE 3 - Summary of TEAEs During the Treatment Phase (Safety Analysis Set) PBO (n = 36) ZOL (n = 35)
留言 (0)