
記住我
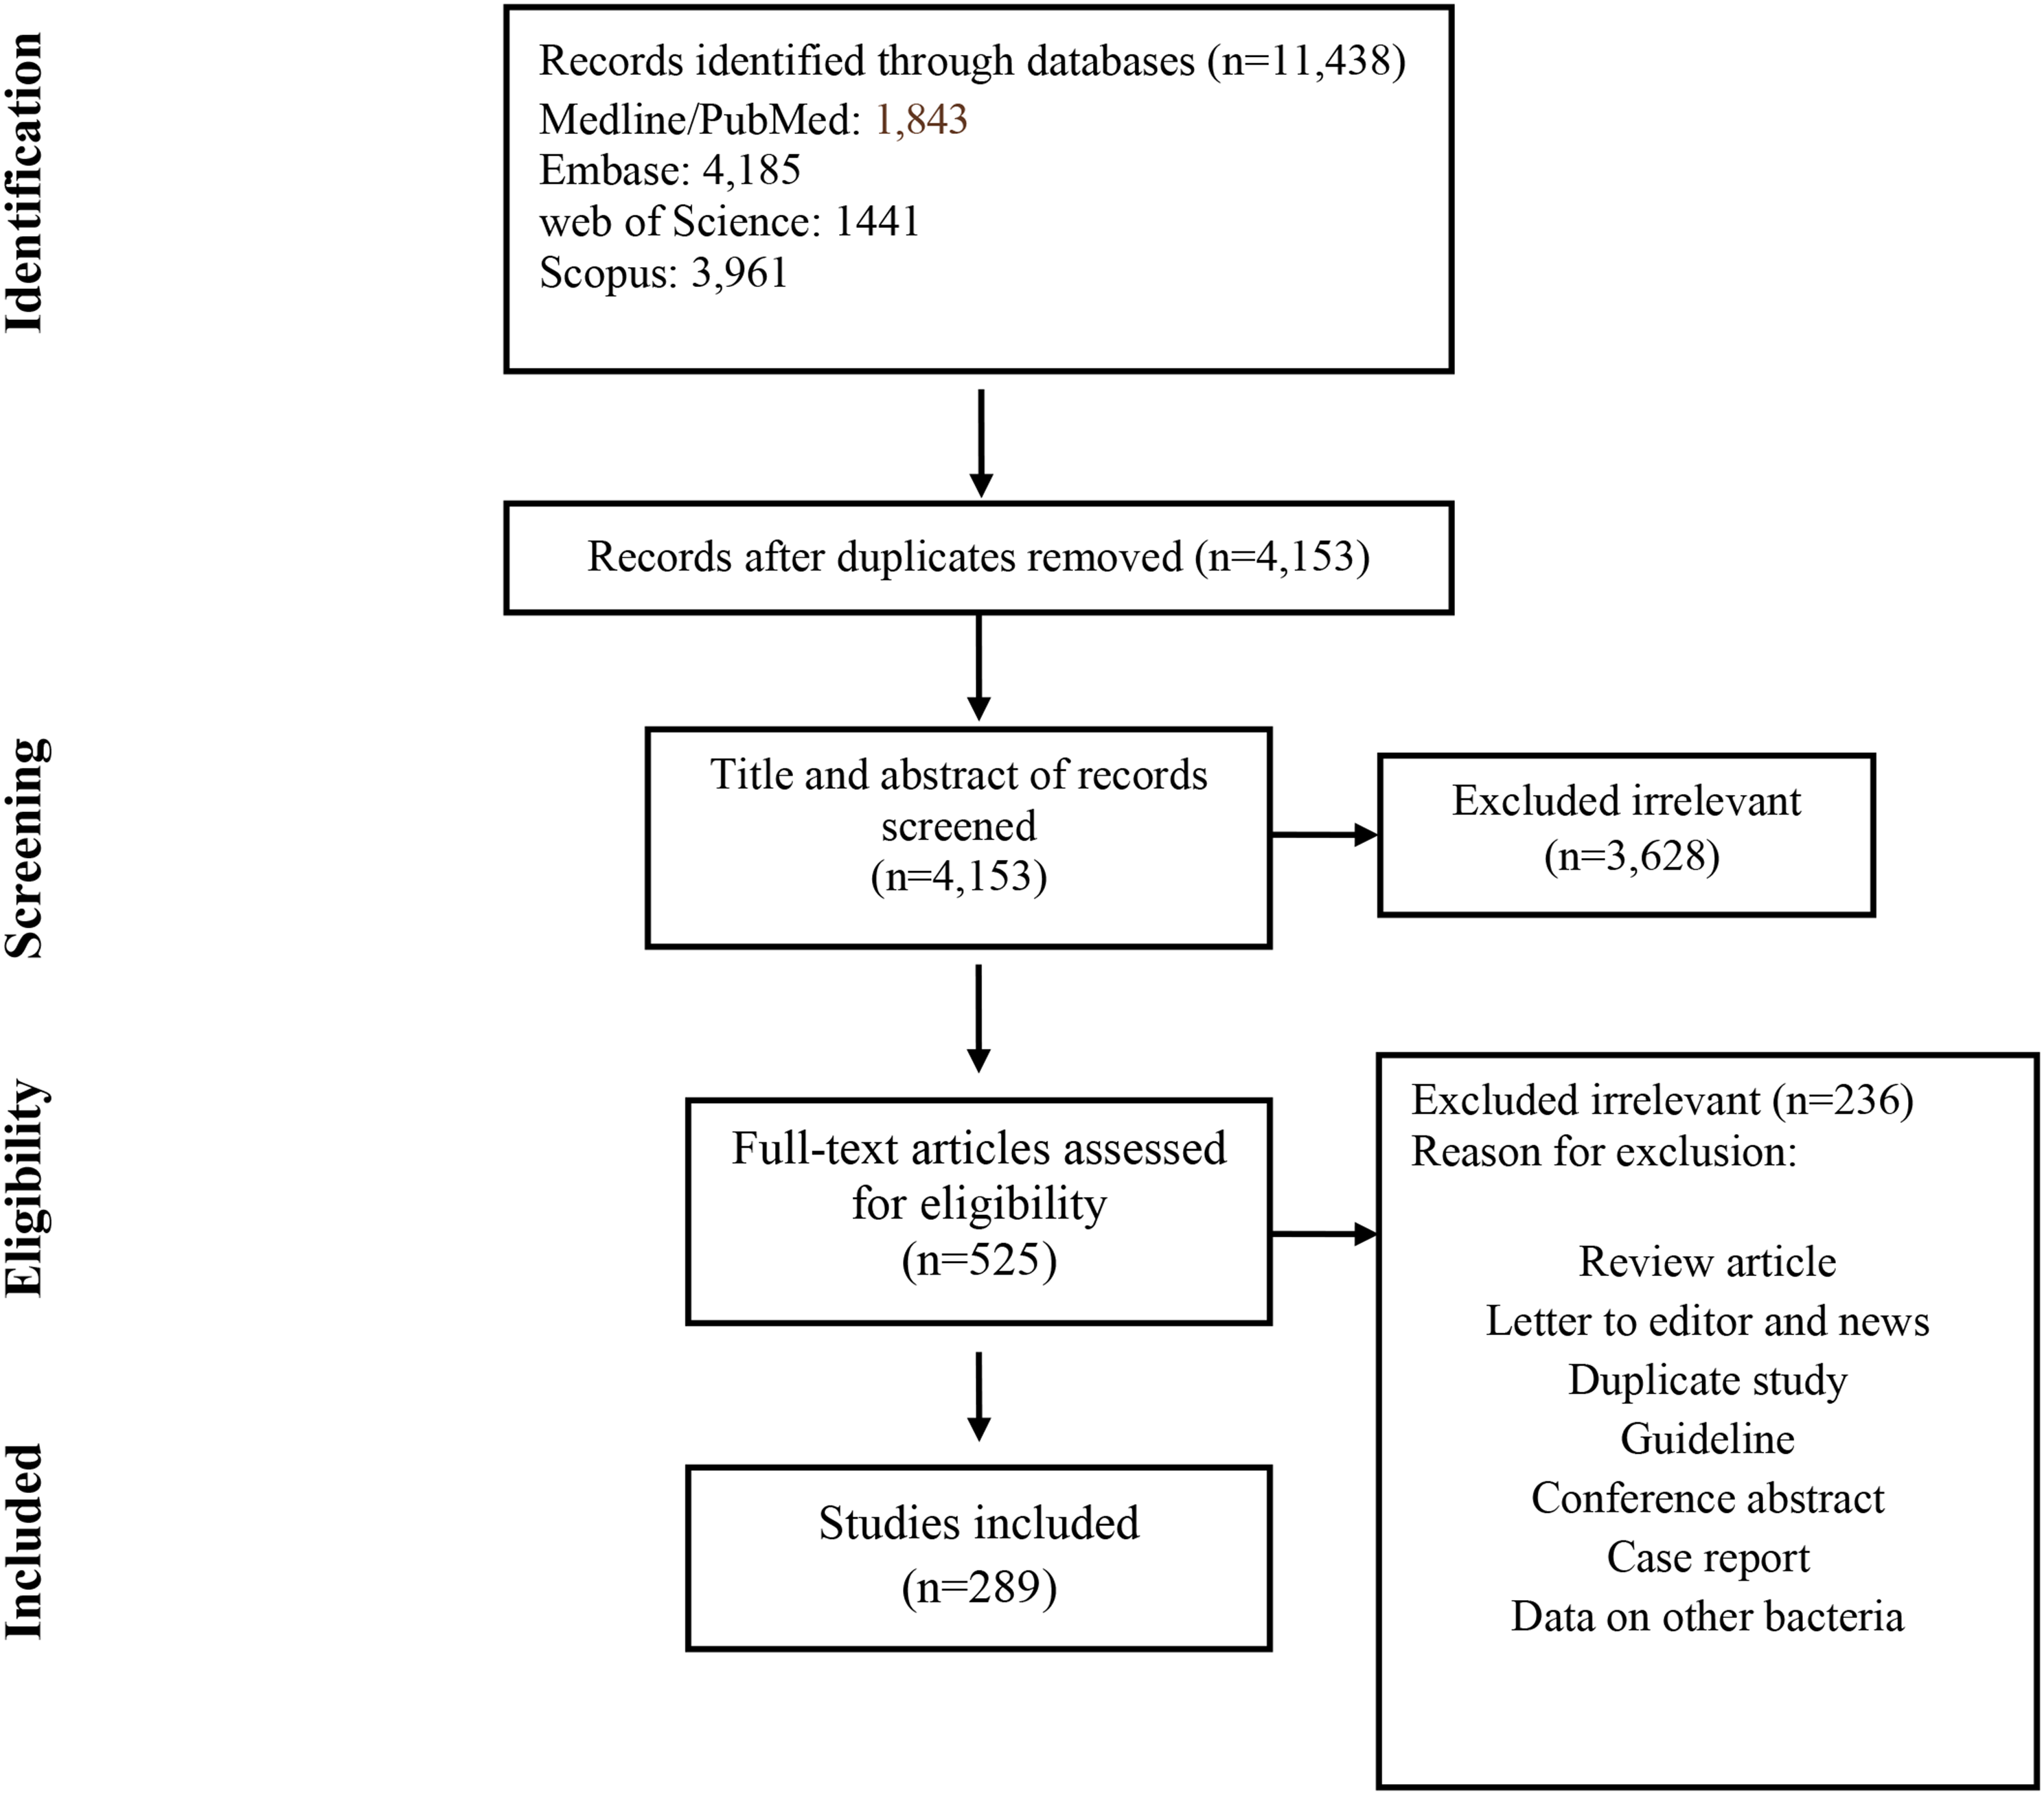
The initial search retrieved 922 studies. After removing duplicates, 594 studies were retained, of which 526 studies were excluded because of the title and abstract. The remaining 68 studies were further read in full text, and finally, a total of 11 studies [3, 4, 6, 12,13,14,15,16,17,18,19] were included in our analysis (Additional file 1: Fig. S1).
Characteristics of included studyWe extracted a total of 19 sets of data from these 11 articles, which were summarized in Table 1.
Table 1 The detailed characteristics of the included studiesQuality evaluationThe quality plots were completed by using Review Manager 5.3.0 and were shown in Figs. 1 and 2. In the aspect of patient selection, 6 studies [3, 4, 6, 13, 15, 16] were considered as high risk of bias which was caused by didn’t avoid setting up a case–control trial. Furthermore, 3 studies [14, 17, 19] were evaluated as unclear risk of bias, because didn't mention whether improper exclusions had been avoided. In the aspect of the index test, 4 studies [4, 13, 16, 19] were considered as high risk of bias. Because the index test results were interpreted in a situation where the results of the gold standard were already known. In addition to this, the risk of bias was unclear for 2 studies [14, 18] because of the indistinct description. 2 studies [3, 6] which judged as having a high risk of bias in the domain of reference standard, known the results of LAMP assay when the index results were interpreted, while 3 studies [14, 15, 18] were unclear about it. Besides, 2 studies [3, 6] were considered as high risk of bias because didn’t have an appropriate interval of time, and only 1 study [15] was considered as unclear risk of bias because of the ambiguous description.
Fig. 1
The summary of the risk of bias and applicability concerns of the included studies
Fig. 2
Quality evaluation of the individual studies
Publication biasAccording to the funnel plot (Fig. 3A), there was an existing significant publication bias in studies we included (P = 0.00).
Fig. 3
Deek’s funnel plot showing a significant publication bias (A), and Bivariate Boxplot indicating low heterogeneity (B)
Bivariate Boxplot showed that there was low heterogeneity in this systematic review (Fig. 3B).
Diagnostic accuracy of the LAMP assayThe sensitivity of LAMP ranged from 83 (95% CI 36–100) to 100%, whereas its pooled sensitivity in detecting S. aureus was 99% (95% CI 99–100), with the I-square value of 31.8% (Fig. 4A). Its specificity was ranged from 75 (95% CI 48–93) to 100%, whereas its pooled sensitivity was 99% (95% CI 99–100), with the I-square value of 48.2% (Fig. 4B). In addition to this, the NLR was 0.02 (95% CI 0.01 to 0.04, I2 = 19.1%; Fig. 5A), the PLR was 51.06 (95% CI 22.65 to 115.06, I2 = 69.0%; Fig. 5B), the DOR was 3277.07 (95% CI 1503.47 to 7142.94, I2 = 0.0%; Fig. 5C), and the AUC was 0.9976 (Fig. 5D).
Fig. 4
Forest plots for the pooled sensitivity (A) and specificity (B)
Fig. 5
Negative LR (A), Positive LR (B), Diagnostic OR (C) and SROC curve (D) of the included studies
The Fagan nomogram showed that with a prior probability of 50%, the post-test probability was 100% if the results were positive, and the post-test probability was 0% if the results were negative (Fig. 6).
Fig. 6
Fagan’s probability plot
Diagnostic performance of subgroupsTwo subgroups were generated in the study. The first subgroup analysis was performed to better distinguish the diagnostic effects of different LAMP types (Figs. 7, 8). In the subgroup, the lamp-FLB and Loopamp DNA Amplification kit have the highest diagnostic accuracy for positive samples (100%, but the latter study only has a four-lattice table). This is followed by eazyplex® MRSA and LAMP (studies that did not indicate LAMP classification were summarized as LAMP groups) (99%) and LAMP-FLD (98%). In terms of diagnostic accuracy for negative samples, from high to low are lamp-FLB, lamp-FLD, and Loopamp DNA Amplification kit (100%), eazyplex® MRSA (99%), and LAMP (98%), respectively.
Fig. 7
The results of subgroup analysis. A, B LAMP-LFB, C, D eazyplex® MRSA
Fig. 8
The results of subgroup analysis. A, B LAMP-LFD, (C, D) conventional LMAP
Another subgroup analysis was performed according to the type of gold standards. In the result, compared with PCR, the sensitivity and specificity were both 100%. The sensitivity and specificity were both 99%, when compared with traditional identification methods.
留言 (0)