
記住我
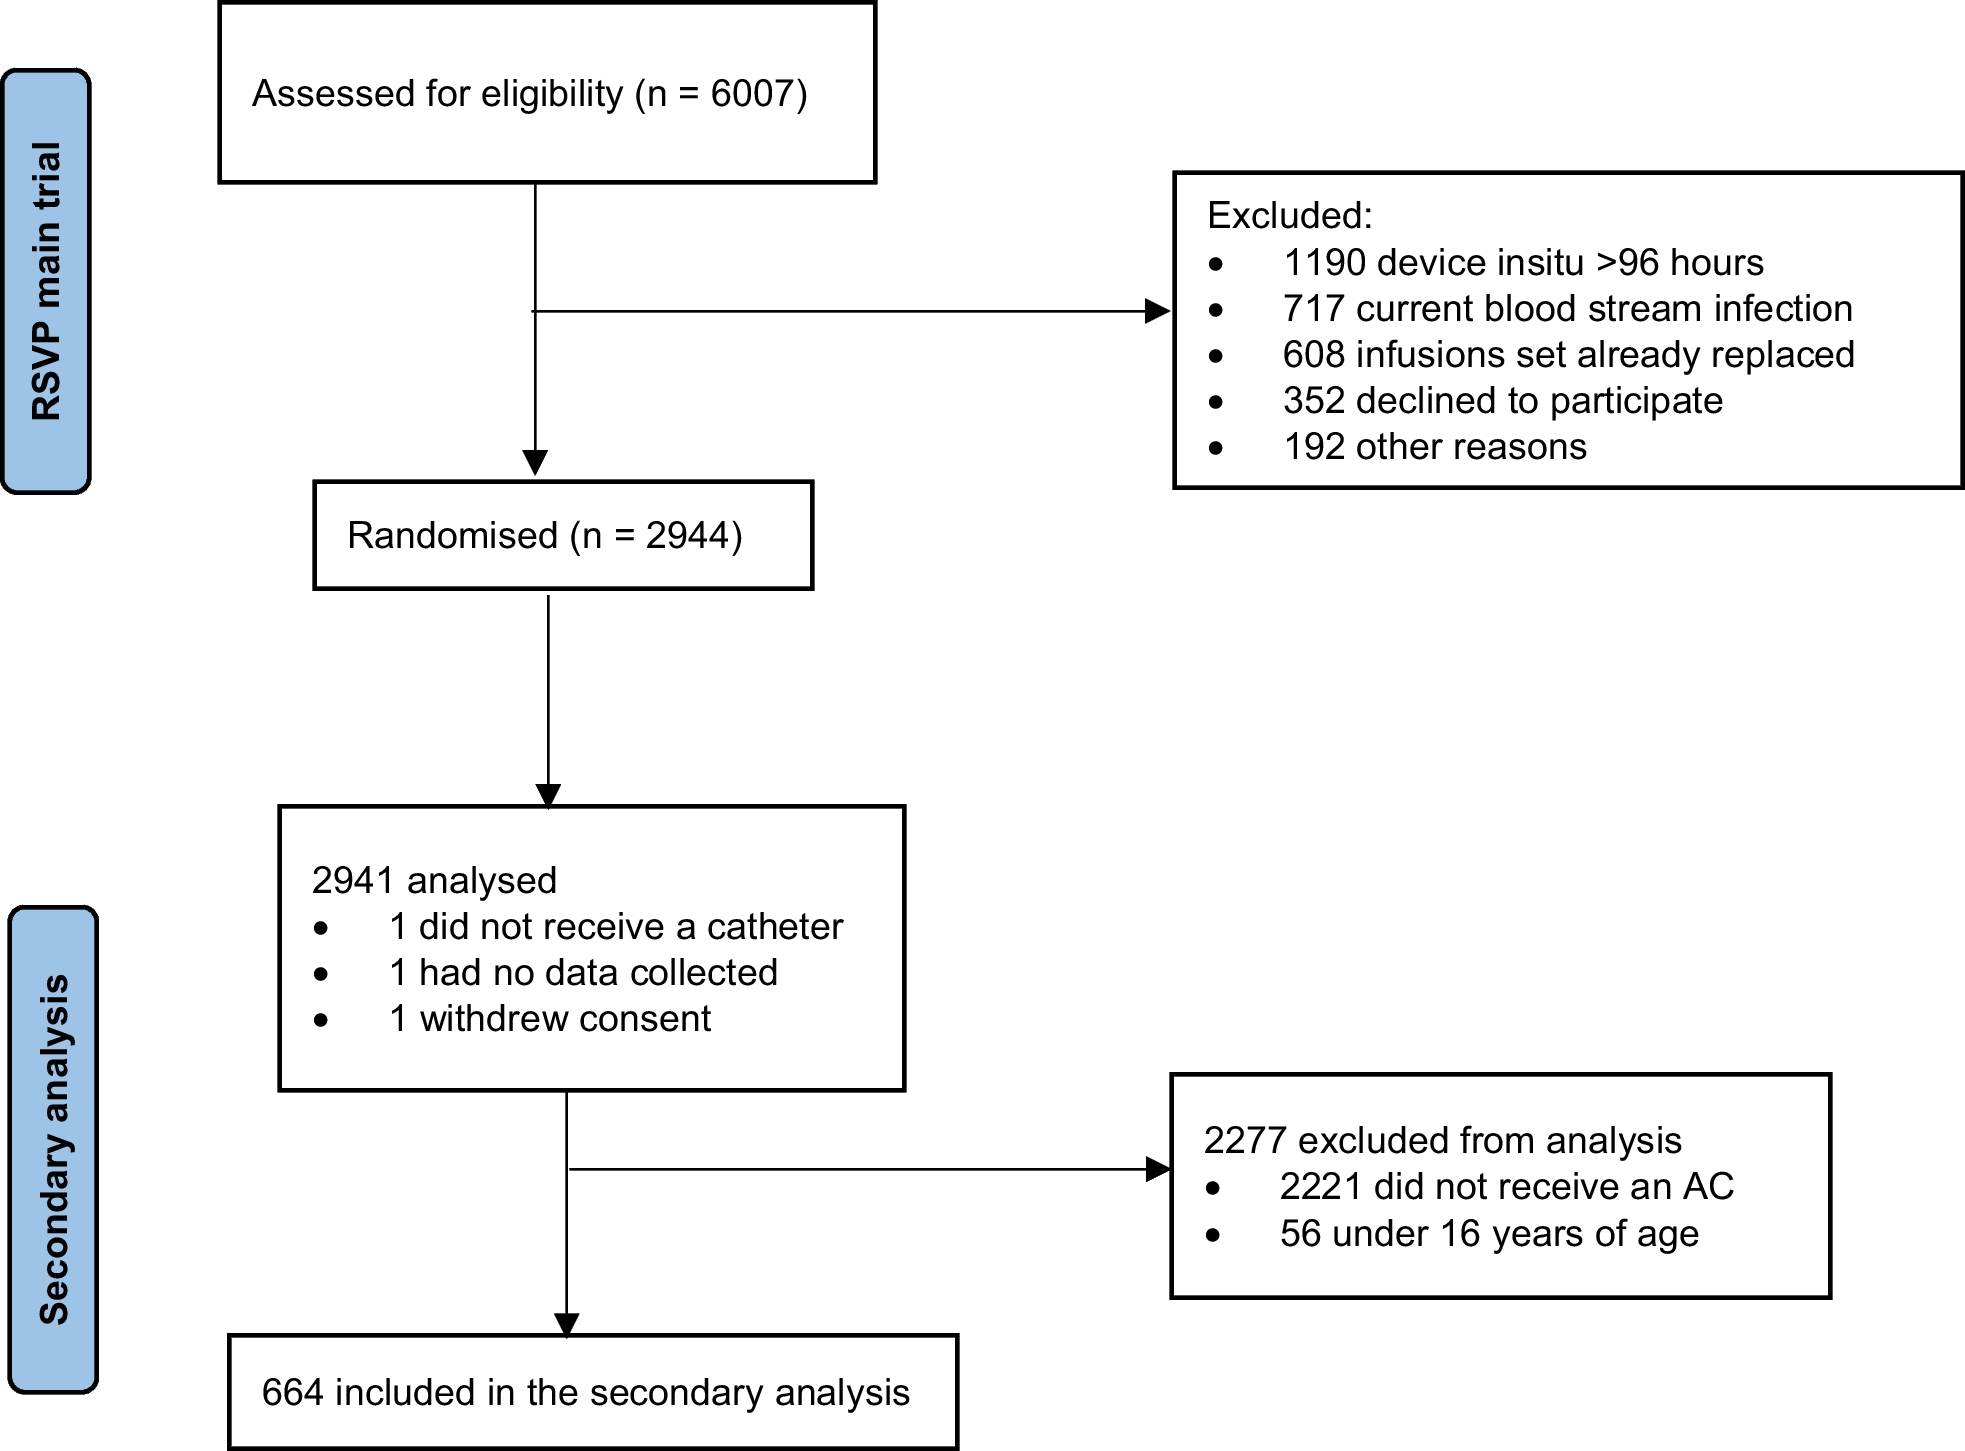
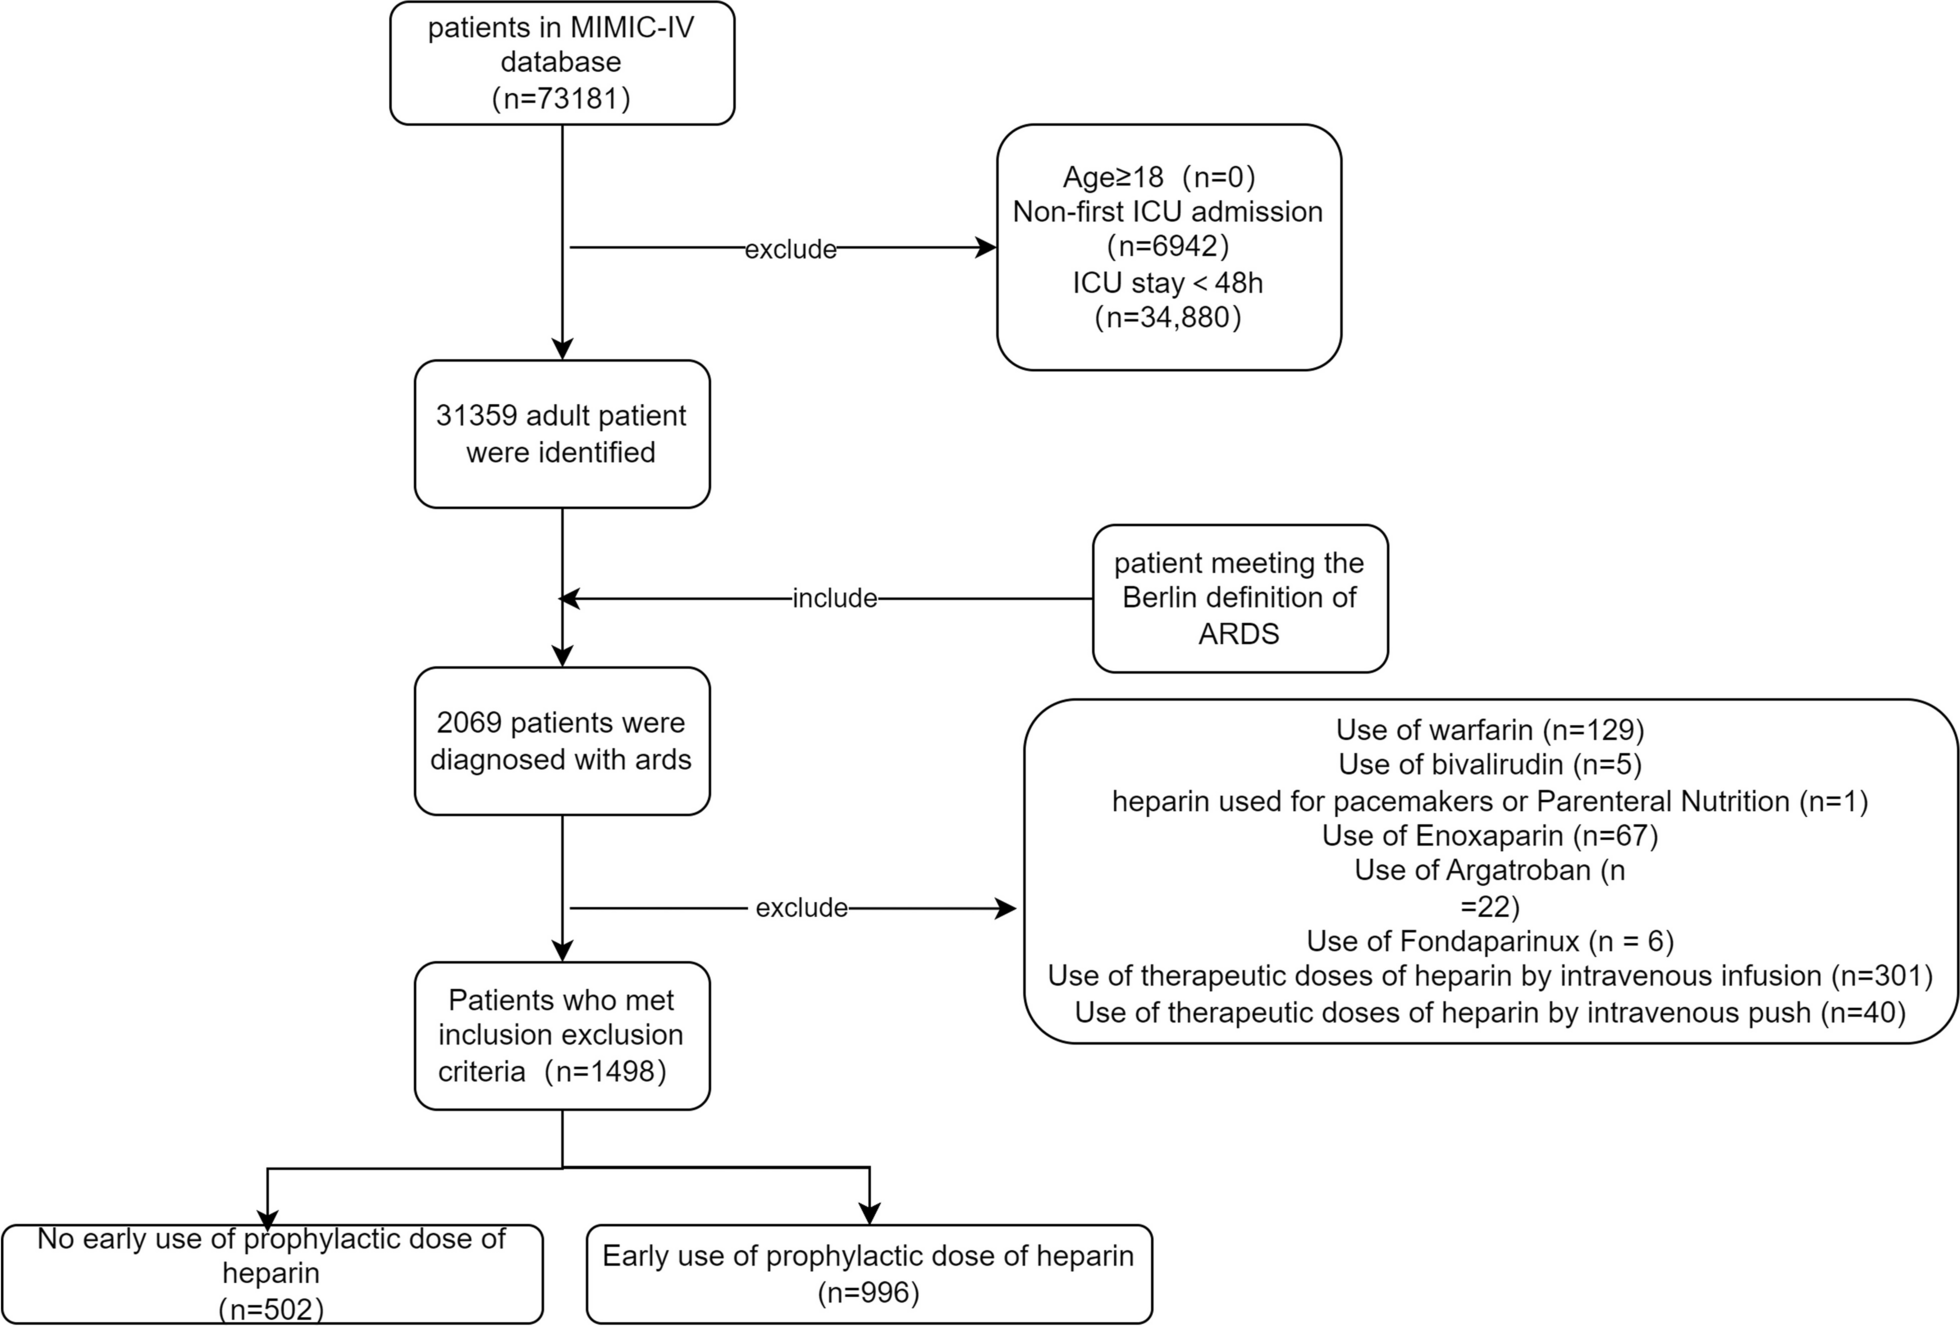
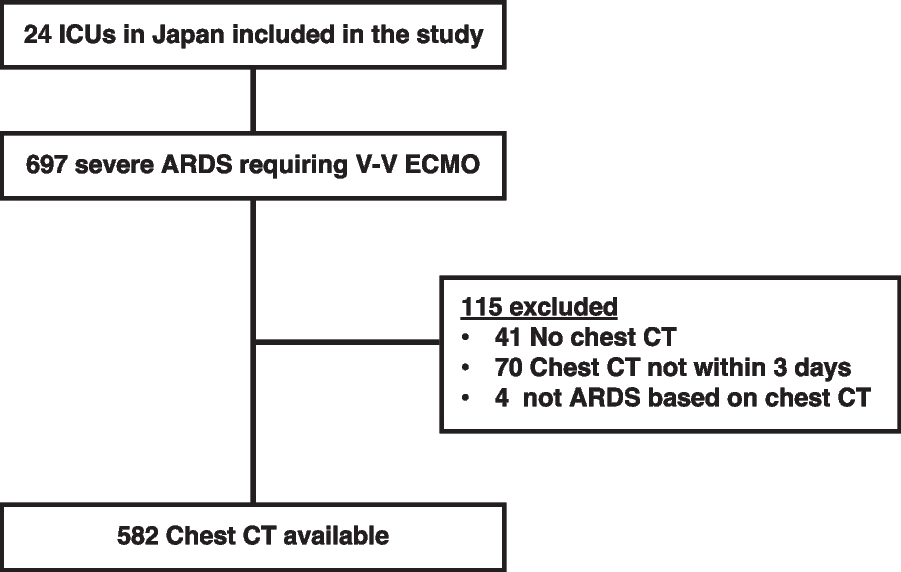
From April 2020 to January 2021, a total of 177 patients were admitted to the department, of which, 41 patients were excluded (9 patients with severe arrhythmia, 1 pregnant patient, 2 patients with congenital heart disease, 5 patients with moderate-to-severe valvular heart disease or history of valve replacement, 5 patients with suspected acute myocardial infarction or myocarditis, 3 patients with end-stage cancer, and 16 patients with chronic heart failure). The remaining 136 patients were included in the study, of which, 12 patients were eliminated (5 patients did not complete echocardiography within 72 h, and the images of 7 patients were unclear and could not be analyzed using the EchoPac workstation). Therefore, data on 124 patients were finally considered for the analyses. The left ventricular systolic dysfunction group (LVSD group, LV GLS > − 17%) included 51 patients (41.1%) and the non-left ventricular systolic dysfunction group (Non-LVSD group, LV GLS ≤ − 17%) included 73 patients (58.9%) (Fig. 1).
Fig. 1 Baseline characteristics and prognosis of the two groups
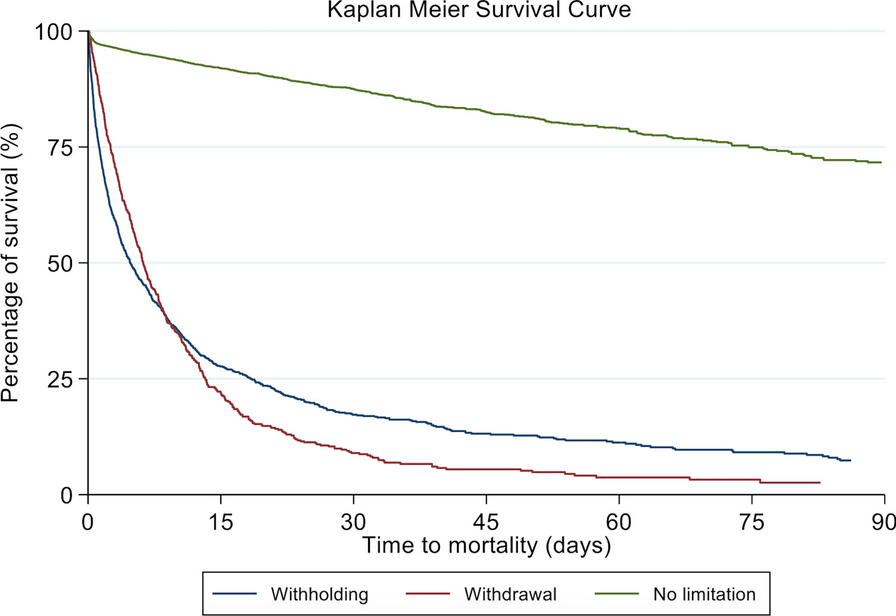
Comparison of baseline characteristics like age, gender, BMI, chronic coexisting conditions (hypertension, diabetes, chronic renal insufficiency, chronic respiratory failure), sites of infection, and proportion of patients with septic shock showed no significant differences between the groups (P > 0.05) (Table 1). There were no significant differences in the clinical parameters of respiratory rate, blood pressure, heart rate, body temperature, CVP, 24-h fluid balance, and APACHE II scores between the 2 groups (P > 0.05). Also, there were no significant differences in the laboratory parameters of hemoglobin, white blood cell count, platelet count, bilirubin level, serum creatinine, pH, and proportion of arteriovenous CO2 gap (P(V-A) CO2 GAP) > 6 mm Hg between the two groups (P > 0.05). However, Hs-TnI, PCT, Lac, NT-probNP, SOFA, and VDI were significantly higher in the LVSD group compared to the Non-LVSD group (P < 0.05) (Table 1). The ICU mortality, hospital mortality, and proportion of atrial fibrillation in the LVSD group were significantly higher than those in the Non-LVSD group (P < 0.05) (Table 2). There were no significant differences in the proportion of tracheal intubation, AKI, and CRRT, length of ICU stay, and length of hospital stay between the two groups (P > 0.05) (Table 2). There was no significant differences in EF between survivors and non-survivors [58% (54%, 60%) vs 55% (50%, 59%), P = 0.060], but non-survivor patients had higher LV GLS [17.6% (16.8%, 18.6%) vs 16.8% (15.4%, 17.8%), P = 0.007]. Kaplan–Meier survival analysis results showed that the 28-day mortality of patients with LVSD was significantly higher than that of Non-LVSD patients (HR = 3.104, 95% CI = 1.617–5.957, P < 0.001) (Fig. 2).
Table 1 Demographic and clinical characteristics of patients with left ventricular systolic dysfunction and non-left ventricular systolic dysfunctionTable 2 Clinical outcomes of patients with left ventricular systolic dysfunction and non-left ventricular systolic dysfunctionFig. 2
Non-LVSD group and LVSD group on 28-day survival. The Kaplan–Meier method was used to estimate the probability of survival. In the adjusted analyses, there was significant difference between the two groups with respect to death at 28 days (hazard ratio was 3.104; 95% confidence interval [CI], 1.617 to 5.957). Results have not been adjusted for multiple comparisons. The shading indicates 95% confidence intervals. LVSD: left ventricular systolic dysfunction
Univariate analysis of risk factors for patients with LVSDThe diagnostic values of PCT, Hs-TnI, NT-probNP, Lac, SOFA, and VDI for LVSD (Fig. 3) were compared. The area under the curve (AUC) of PCT in the diagnosis of LVSD was 0.631, the optimal cut-off value was 40 ng/ mL, the sensitivity was 45.10%, the specificity was 83.56%, and the Youden index was 0.287. The AUC of Hs-TnI in the diagnosis of LVSD was 0.765, the optimal cut-off value was 0.131 ng/ml, the sensitivity was 68.63%, the specificity was 79.45%, and the Youden index was 0.481. The AUC of NT-proBNP in the diagnosis of LVSD was 0.726, the optimal cut-off value was 3270 pg/ mL, the sensitivity was 58.8%, the specificity was 78.1%, and the Youden index was 0.369. The AUC of Lac in the diagnosis of LVSD was 0.641, the optimal cut-off value was 4.2 mmol/L, the sensitivity was 47.1%, the specificity was 84.9%, and the Youden index was 0.320. The AUC of SOFA in the diagnosis of LVSD was 0.643, the optimal cut-off value was 11, the sensitivity was 66.7%, the specificity was 63.0%, and the Youden index was 0.297. The ADI optimal cut-off value was 57 μg/min, the sensitivity was 48.1%, the specificity was 84.9%, and the Youden index was 0.261 (Table 3).
Fig. 3
Receiver operating characteristic curve for diagnosis of left ventricular systolic dysfunction in patients with sepsis. PCT procalcitonin, Hs-TnI high sensitive troponin I, NT-proBNP N-terminal pro-brain natriuretic peptide, Lac actate, SOFA Sequential Organ Failure Assessment, VDI vasopressor dosing intensity
Table 3 Diagnostic performance of PCT, Hs-TnI, NT-proBNP, Lac and SOFA for left ventricular systolic dysfunction in patients with sepsisMultivariate analysis of risk factors for patients with LVSDMultivariate logistic regression analysis showed that Hs-TnI ≥ 0.131 ng/ml (OR = 6.71, 95% CI = 2.67 ~ 16.88, P < 0.001), PCT ≥ 40 ng/ml (OR = 3.08, 95% CI = 1.10 ~ 8.59, P = 0.032), NT-probNP ≥ 3270 pg/mL (OR = 2.67, 95% CI = 1.06 ~ 6.74, P = 0.038), and Lac ≥ 4.2 mmol/L (OR = 2.80, 95% CI = 1.02 ~ 7.69, P = 0.045) were significantly different. Hs-TnI ≥ 0.131 ng/ml, PCT ≥ 40 ng/ mL, NT-probNP ≥ 3270 pg/ mL, and Lac ≥ 4.2 mmol/L were independent risk factors for LVSD (Table 4).
Table 4 Multivariate logistic regression analysis for predictors of patients with left ventricular systolic dysfunctionEstablishment of a predictive model for patients with LVSDHs-TnI ≥ 0.131 ng/ml, PCT ≥ 40 ng/ mL, NT-proBNP ≥ 3270 pg/ mL, and Lac ≥ 4.2 mmol/L were included in the logistic regression model. Logistic regression model of ln[P/(1-P)] = − 2.18 + [1.90Hs-TnI (< 0.131 ng/ml vs ≥ 0.131 ng/ml, < 0.131 ng/ml = 0, ≥ 0.131 ng/ml)] + [1.12PCT (< 40) ng/ml vs ≥ 40 ng/ml, < 40 ng/ml = 0, ≥ 40 ng/ml = 1)] + [1.03Lac (< 4.2 mmol/L vs ≥ 4.2 mmol/L, < 4.2 mmol/L = 0, ≥ 4.2 mmol/L = 1)] + [0.98Nt-proBNP (< 3270 pg/ml vs ≥ 3270 pg/ml, < 3270 pg/ml = 1)]. The Hosmer–Lemeshow test was applied and the test results showed that the model fit well (P = 0.719). The AUC of the predictive model was 0.839 (P < 0.001) (Fig. 4).
Fig. 4
Receiver operating characteristic curves showing the predictions of the model for left ventricular systolic dysfunction in patients with sepsis
Nomogram and verificationAccording to logistic regression results, the four risk factors: PCT ≥ 40 ng/ml, HS-TnI ≥ 0.131 ng/ml, NT-proBNP ≥ 3270 pg/mL, and Lac ≥ 4.2 mmol/L were used to draw the nomogram. The scores of the 4 factors were obtained: Hs-TnI ≥ 0.131 ng/mL, 100 points; PCT ≥ 40 ng/mL, 59 points; Lac ≥ 4.2 mmol/L, 54 points; and NT-proBNP ≥ 3270 pg/mL, 52 points (Fig. 5). The bootstrap test was used for internal verification. It was found that the correction curve was in good consistency with the ideal curve and the degree of calibration of the model was acceptable (Fig. 6). The C-index of the model was 0.822 (95% CI = 0.750–0.894).
Fig. 5
Individualized predictive nomogram model in diagnosing the left ventricular systolic dysfunction in sepsis patients. PCT procalcitonin, Hs-TnI high sensitive troponin I, NT-proBNP N-terminal pro-brain natriuretic peptide, Lac lactate
Fig. 6
Calibration curves for the prediction of left ventricular systolic dysfunction in patients with sepsis by the nomogram
留言 (0)