
記住我
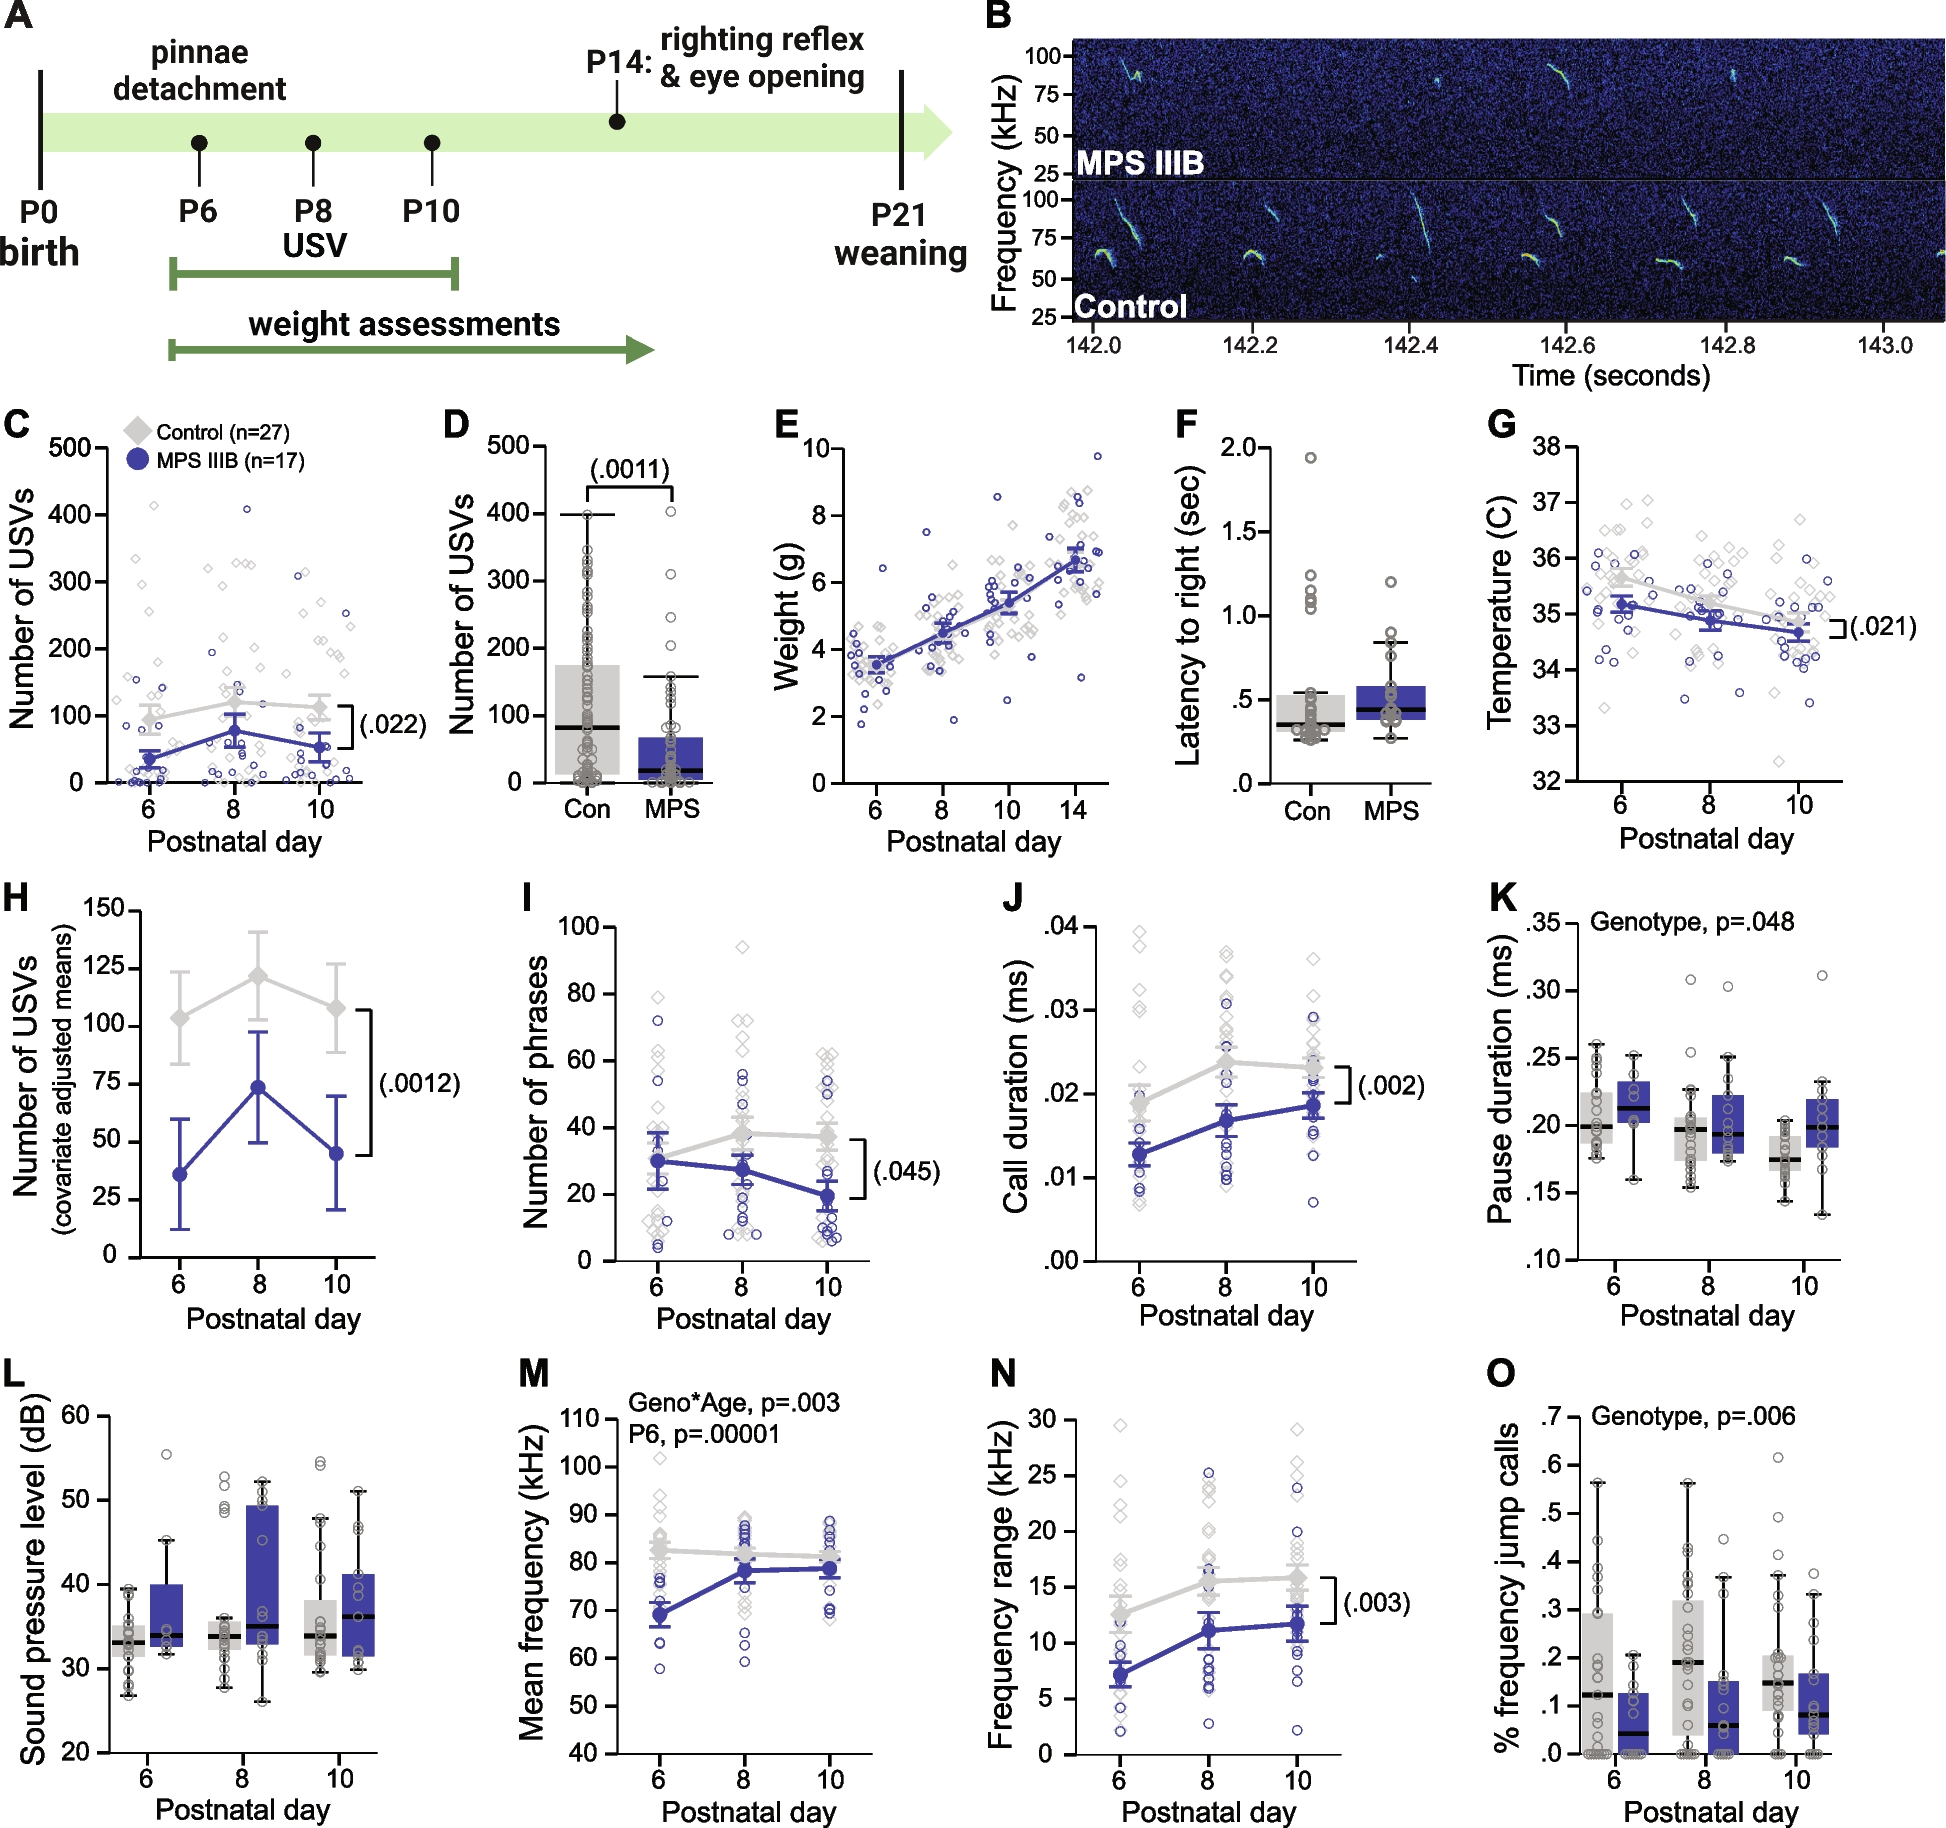
To probe the role of RCAN1 in disruptions of circadian rhythms in DS, AD, and aging, we examined daily locomotor activity rhythms of wheel running behavior in two age groups of Rcan1 KO mice with WT littermates and RCAN1 TG mice with NTG littermates. In the young group, mice were tested at 3–6 months old, equivalent to early adulthood [63] before clinical AD onset. In the aged group, mice were tested at 9–14 months old, corresponding to middle age in humans [63] when aging-related dysfunction and preclinical AD symptoms emerge in the general population while in DS nearly all individuals have developed AD neuropathology [2, 64,65,66]. Given previous studies demonstrating that CaN [50, 52] and the Drosophila RCAN1 ortholog sra [49, 53] regulate the photic entrainment of circadian activity rhythms, we investigated whether RCAN1 similarly modulates light-entrained wheel running in mice. We also monitored free-running wheel activity of Rcan1 KO and RCAN1 TG mice in constant darkness (DD) to assess the integrity of their circadian clock and strength of their circadian rhythm.
Mean actograms of wheel running behavior in Rcan1 WT (Fig. 1A), Rcan1 KO (Fig. 1B), NTG (Fig. 1C), and RCAN1 TG (Fig. 1D) mice under LD12:12 or DD conditions revealed striking RCAN1-dependent differences in locomotor activity profiles. To quantify these differences, we first analyzed the daily periodicity of wheel running in LD12:12 or DD. We found a significant genotype × outcome measure interaction (F6,307 = 2.62; p = 0.017). No main effects of or interactions with age were detected, so group data were collapsed by age for further analysis. All genotypes showed a similar light-entrained period length (Fig. 1E), indicating that RCAN1 levels do not affect photic entrainment of circadian wheel running. By contrast, the endogenous period was lengthened in free-running Rcan1 KO (p = 0.041) and RCAN1 TG (p = 0.027) mice compared with Rcan1 WT and NTG littermate controls, respectively (Fig. 1F). These data suggest that RCAN1 functions to modulate the periodicity of circadian locomotor activity rhythms.
Fig. 1
RCAN1 mediates the circadian periodicity but not the photic entrainment of wheel running. Heatmap-style actograms visualizing mean wheel revolution data for two distinct cohorts of mice tested in either LD12:12 conditions for a minimum of 7 days (days 4−7 displayed) or DD conditions for a minimum of 9 days (days 4−9 displayed) for A Rcan1 WT, B Rcan1 KO, C NTG, and D RCAN1 TG groups. E Light-entrained diurnal period length of wheel running rhythms in LD12:12. There were no group differences in light-entrained period length. F Circadian (free-running) period length of wheel running rhythms in constant darkness. Young Rcan1 KO and RCAN1 TG mice have lengthened endogenous periods (tau) relative to young Rcan1 WT and NTG mice, respectively. Light-entrained N = 55 Rcan1 WT, 54 Rcan1 KO, 35 NTG, 36 RCAN1 TG mice; free-running N = 17 Rcan1 WT, 21 Rcan1 KO, 17 NTG, 18 RCAN1 TG mice. All data are mean ± S.E.M. *p < 0.05
RCAN1 knockout and overexpression alter active and inactive phase wheel running patterns in light-entrained young but not aged miceConsidering the actigraphic alterations observed in Rcan1 KO and RCAN1 TG mice (Fig. 1A–D), we next analyzed the intensity of light-entrained total daily wheel running (Fig. 2A) as well as daily wheel running during the dark (active) (Fig. 2B) and light (inactive) (Fig. 2C) phases. To analyze the distribution of wheel running throughout an average day, we also determined the percentage of daily wheel running during the light phase (Fig. 2D). There were significant interactions of genotype × age (F3,192 = 3.22; p=0.027), age × outcome measure (F2,192=73.09; p < 1.0E−15), and genotype × age × outcome measure (F6,192 = 3.38; p = 0.017). In the young group, daily total wheel running was reduced both in Rcan1 KO mice compared with Rcan1 WT controls (p = 0.031) and in RCAN1 TG mice compared with NTG controls (p = 3.0E−4) (Fig. 2A). Furthermore, RCAN1 TG mice exhibited reduced total daily wheel running relative to Rcan1 KO mice (p = 0.005; Fig. 2A). Across the dark and light phases, however, the wheel running patterns of Rcan1 KO and RCAN1 TG mice diverged. During the dark phase, both young Rcan1 KO and RCAN1 TG mice displayed lower daily wheel running compared with Rcan1 WT (p = 0.002) and NTG (p = 0.003) controls, respectively (Fig. 2B), indicating active phase hypoactivity. During the light phase, on the other hand, young Rcan1 KO mice were hyperactive compared with young Rcan1 WT (p = 0.023) and RCAN1 TG (p = 0.003) mice, whereas young RCAN1 TG mice were hypoactive relative to NTG littermates (p = 0.031) (Fig. 2C). Additionally, young Rcan1 KO mice exhibited an increased percentage of total daily activity during the light phase compared with young Rcan1 WT (p = 0.011) and RCAN1 TG (p = 0.017) mice (Fig. 2D). Together, these results indicate that total wheel running in an average day was reduced in both young Rcan1 KO and RCAN1 TG mice on the LD12:12 schedule, while young Rcan1 KO mice alone shifted wheel running normally occurring in the dark phase to the light phase.
Fig. 2
RCAN1 knockout and overexpression alter active and inactive phase wheel running patterns in light-entrained young but not aged mice. A Mean total daily wheel running of light-entrained young (left) and aged (right) mice. Young Rcan1 KO and RCAN1 TG mice exhibit reduced total daily wheel running relative to young RCAN1 WT and NTG controls, respectively. Compared with young mice, aged mice showed decreased total daily wheel running. B Mean daily dark phase (ZT12-ZT24) wheel running of light-entrained young (left) and aged (right) mice. Young Rcan1 KO and RCAN1 TG mice are hypoactive during the dark phase compared with young Rcan1 WT and NTG controls, respectively. Compared with young mice, aged mice showed decreased daily wheel running during the dark phase. C Mean daily light phase (ZT0-ZT12) wheel running of light-entrained young (left) and aged (right) mice. Young Rcan1 KO mice are hyperactive during the light phase compared with both young Rcan1 WT and RCAN1 TG mice as well as with aged Rcan1 KO mice. By contrast, young RCAN1 TG mice are hypoactive compared with young NTG controls. D Mean percentage of total daily wheel running during the light phase for light-entrained young (left) and aged (right) mice. Young Rcan1 KO mice have an increased percentage of total daily activity occurring during the light phase compared with young Rcan1 WT and RCAN1 TG mice. Young N = 25 Rcan1 WT, 26 Rcan1 KO, 15 NTG, 17 RCAN1 TG mice; aged N = 7 Rcan1 WT, 10 Rcan1 KO, 7 NTG, 8 RCAN1 TG mice. All data are mean ± S.E.M. *p < 0.05; **p < 0.01; ***p < 0.001
No differences in the intensity and distribution of light-entrained wheel running were detected among the aged groups. However, consistent with the known decline in locomotor activity with age [24], aged Rcan1 WT and NTG mice showed reduced total daily wheel running compared with young Rcan1 WT (p = 3.7E−15) and NTG (p = 1.2E−10) mice, respectively (Fig. 2A). Similarly, dark phase wheel running was decreased in aged Rcan1 WT (p = 2.6E−8) and NTG (p = 5.0E−6) mice compared with their respective young counterparts (Fig. 2B). Young Rcan1 KO and RCAN1 TG mice both showed reduced daily total wheel running (Fig. 2A) and dark phase wheel running (Fig. 2B) in the direction of aged groups, implying that abnormal RCAN1 levels may facilitate premature aging-like phenotypes.
RCAN1 knockout and overexpression similarly attenuate the light-entrained diurnal rhythmicity of wheel running in young but not aged miceBased on prior reports of reduced diurnal activity rhythm amplitudes in DS, AD, aging individuals, and animal models thereof [24, 31, 36, 56, 57], each of which exhibit RCAN1 upregulation, and in sra KO flies, which lack the Drosophila homolog of RCAN1 [49], we hypothesized that RCAN1 also regulates the rhythmicity of wheel running. Therefore, we examined the impact of RCAN1 knockout and overexpression on rhythmic characteristics of light-entrained wheel running with age. To estimate parameters of rhythm, cosinor analysis was used to curve-fit daily wheel running of young (Fig. 3A) and aged (Fig. 3B) Rcan1 KO and RCAN1 TG mice in LD12:12. The oscillatory mean (MESOR; Fig. 3C), range (amplitude; Fig. 3D), and phase (acrophase; Fig. 3E) of the fitted curves were estimated as measures of wheel running rhythmicity.
Fig. 3
RCAN1 knockout and overexpression similarly attenuate the light-entrained diurnal rhythmicity of wheel running in young but not aged mice. Plots of average daily wheel revolutions collapsed into hourly bins (floating points depicting mean ± S.E.M) with superimposed single-harmonic regression curve fits (mean ± 95% CI bands) for A young and B aged mice. C Mean daily MESOR estimates for wheel running rhythms of light-entrained young (left) and aged (right) mice. Young Rcan1 KO and RCAN1 TG mice have decreased MESOR estimates versus young Rcan1 WT and NTG mice, respectively. Aged Rcan1 WT and NTG mice showed reduced MESOR estimates relative to young Rcan1 WT and NTG mice, respectively. D Mean daily amplitude estimates for wheel running rhythms of light-entrained young (left) and aged (right) mice. Young Rcan1 KO and RCAN1 TG mice have reduced amplitude estimates compared with young Rcan1 WT and NTG mice, respectively. Aged Rcan1 WT and NTG mice showed decreased amplitude estimates relative to young Rcan1 WT and NTG mice, respectively. E Mean daily acrophase estimates for wheel running rhythms of light-entrained young adult (left) and aged (right) mice. There were no group differences in acrophase estimates. Young N = 25 Rcan1 WT, 26 Rcan1 KO, 15 NTG, 17 RCAN1 TG mice; aged N = 7 Rcan1 WT, 10 Rcan1 KO, 7 NTG, 8 RCAN1 TG mice. All data are mean ± S.E.M. **p < 0.01; ***p < 0.001
There were significant interactions of genotype × outcome measure (F6,192 = 2.46; p = 0.032), age × outcome measure (F2,192 = 64.38; p = 1.0E−15), and genotype × age × outcome measure (F6,192 = 3.60; p = 0.016) in light-entrained circadian rhythms of wheel running. Compared with their corresponding littermate controls, young Rcan1 KO and RCAN1 TG mice displayed reduced MESOR (p = 0.026 and p = 0.010, respectively; Fig. 3C) and amplitude (p = 0.047 and p = 0.028, respectively; Fig. 3D) estimates, indicating flattened circadian rhythmicity of wheel running. There were no differences among the young groups for acrophase estimates (Fig. 3E), suggesting RCAN1 does not play a role in the phasing of peak daily wheel running. No parameters of rhythm differed among aged groups (Fig. 3C–E), indicating that RCAN1 depletion and overexpression attenuate the strength of circadian locomotor rhythms in young, but not aged, mice. However, as expected, aged mice displayed dampened wheel running rhythmicity relative to young mice, indicated by the decreased MESOR and amplitude estimates in aged versus young Rcan1 WT (p = 4.9E−11 and p = 7.5E−7, respectively) and aged versus young NTG (p = 1.1E−6 and p = 0.004, respectively) mice. Since both MESOR and amplitude estimates were reduced in young Rcan1 KO and RCAN1 TG mice toward aged levels, these data further suggest that abnormal RCAN1 levels may accelerate senescence phenotypes.
RCAN1 knockout and overexpression bidirectionally perturb wheel running patterns in free-running young miceWe also assessed wheel running profiles in the absence of light entrainment using DD (free-running) conditions. Given the altered free-running locomotor activity reported in RCAN1-overexpressing DS models [55, 57] and sra KO flies [49, 53], we posited that RCAN1 additionally modulates circadian wheel running rhythms. In support of this theory, we found RCAN1-dependent effects on the circadian period of wheel running rhythms (Fig. 1F). To determine if RCAN1 knockout and overexpression also affect the intensity and distribution of daily free-running wheel activity, we next examined total wheel running (Fig. 4A), wheel running during the alpha (active) (Fig. 4B) and rho (inactive) (Fig. 4C) phases, and the percentage of total daily wheel running during the rho phase (Fig. 4D) in free-running young Rcan1 KO and RCAN1 TG mice.
Fig. 4
RCAN1 knockout and overexpression bidirectionally perturb wheel running patterns of free-running young mice. A Mean total (CT0-CT24) daily wheel running of free-running young mice. Rcan1 KO mice exhibit increased total daily wheel running compared with Rcan1 WT and RCAN1 TG mice, while RCAN1 TG mice displayed decreased total daily wheel running compared with NTG mice. B Mean daily alpha (active) phase wheel running of free-running young mice in DD. Rcan1 KO mice show increased daily wheel running in the alpha phase compared with Rcan1 WT and RCAN1 TG mice, while RCAN1 TG mice show decreased daily wheel running in the alpha phase relative to NTG mice. C Mean daily rho (inactive) phase wheel running of free-running young mice in DD. Rcan1 KO mice exhibit elevated daily wheel running during the rho phase compared with Rcan1 WT and RCAN1 TG mice. D Mean percentage of total daily wheel running during the rho phase for free-running young mice. Rcan1 KO mice display an increased percentage of total daily wheel running in the rho phase compared with Rcan1 WT mice, while RCAN1 TG mice trended toward an increased percentage of total daily activity in the rho phase compared to NTG mice. N = 17 Rcan1 WT, 21 Rcan1 KO, 17 NTG, 18 RCAN1 TG mice. All data are mean ± S.E.M. *p < 0.05; **p < 0.01; ****p < 0.0001
There was a significant genotype × outcome measure interaction (F9,174 = 8.14; p = 4.8E−9) for daily wheel running profiles among free-running mice. Relative to Rcan1 WT and RCAN1 TG mice, Rcan1 KO mice exhibited higher total daily free-running wheel activity (p = 0.008 and p = 5.0E−6, respectively; Fig. 4A), resulting from increased wheel running during both the alpha (p = 0.048 and p = 4.0E−5, respectively; Fig. 4B) and rho (p = 0.003 and p = 0.009, respectively; Fig. 4C) phases. Rcan1 KO mice also exhibited an increased percentage of total daily wheel running in the rho phase (p = 0.047) compared with Rcan1 WT controls (Fig. 4D), indicating a shift toward an increased proportion of total daily wheel running during the inactive phase. By contrast, total daily wheel activity of free-running RCAN1 TG mice was decreased (p = 0.030, Fig. 4A), largely stemming from decreased wheel running during the alpha phase (p = 0.039; Fig. 4B) compared with NTG controls. Therefore, abolition of RCAN1 led to hyperactivity whereas upregulation of RCAN1 led to hypoactivity in free-running mice, suggesting that RCAN1 levels titrate circadian locomotor activity patterns in the absence of light entrainment. RCAN1 TG mice displayed no difference in rho phase activity versus NTG controls (Fig. 4C) but trended (p = 0.17) toward an increased percentage of total daily wheel running in the rho phase (Fig. 4D) like Rcan1 KO mice. Together, these results demonstrate that RCAN1 knockout and overexpression disrupt free-running rest-activity profiles.
RCAN1 knockout and overexpression elicit divergent alterations in the circadian rhythmicity of wheel running in young miceConsidering the opposing consequences of RCAN1 deficiency and overexpression on the daily wheel running patterns of free-running young mice (Fig. 4) coupled with the RCAN1-mediated effects on diurnal rhythmicity of wheel running in light-entrained mice (Fig. 3), we postulated that RCAN1 may bidirectionally regulate the circadian rhythmicity of wheel running in young mice. To test this idea, we performed rhythmometric analysis of the wheel activity of free-running young Rcan1 KO and RCAN1 TG mice (Fig. 5A) to estimate the MESOR (Fig. 5B), amplitude (Fig. 5C), and acrophase (Fig. 5D) of their circadian wheel running rhythms. There was a significant genotype × outcome measure interaction (F6,131 = 8.52; p = 1.0E−7). Relative to Rcan1 WT and RCAN1 TG mice, Rcan1 KO mice exhibited increased MESOR (p = 0.008 and p = 2.0E−5, respectively; Fig. 5B) and amplitude (p = 0.004 and p = 1.0E−6, respectively; Fig. 5C) estimates, indicating increased oscillatory means and intra-daily variability of endogenous circadian wheel running rhythms. By contrast, RCAN1 TG mice displayed decreased MESOR (p = 0.043; Fig. 5B) and amplitude (p = 0.039; Fig. 5C) estimates compared with NTG controls, indicating that RCAN1 overexpression dampens the endogenous rhythmicity of daily wheel running. There were no differences in acrophase estimates among any groups (Fig. 5D), suggesting that RCAN1 levels regulate the strength and variability but not the phasing of endogenous locomotor activity rhythms. These data provide further evidence of disrupted circadian activity rhythms in young Rcan1 KO and RCAN1 TG mice.
Fig. 5
RCAN1 knockout and overexpression elicit divergent alterations in the circadian rhythmicity of wheel running in young mice. A Plot of average daily wheel revolutions collapsed into hourly bins (floating points depicting mean ± S.E.M) with superimposed single-harmonic regression curve fits (mean ± 95% CI bands) for free-running young mice. B Mean daily MESOR estimates for wheel running rhythms of free-running young mice. Rcan1 KO mice exhibit increased daily MESOR estimates compared with Rcan1 WT and RCAN1 TG mice, while RCAN1 TG mice display decreased daily MESOR estimates relative to NTG mice. C Mean daily amplitude estimates for wheel running rhythms of free-running young mice. Rcan1 KO mice exhibit increased daily amplitude estimates compared with Rcan1 WT and RCAN1 TG mice, while RCAN1 TG mice display decreased daily amplitude estimates compared with NTG mice. D Mean daily acrophase estimates for wheel running rhythms of free-running young mice. There were no group differences in acrophase estimates. N = 17 Rcan1 WT, 21 Rcan1 KO, 17 NTG, 18 RCAN1 TG mice. All data are mean ± S.E.M. *p < 0.05; **p < 0.01; ****p < 0.0001
Circadian periodicity and photic entrainment of wheel running are unaltered in young Dp16 miceGiven our findings of altered wheel running in young RCAN1-overexpressing mice and that RCAN1 is triplicated in DS, we next characterized wheel running phenotypes in the Dp16 mouse model for DS, which carries three Rcan1 copies. To examine the specific role of RCAN1 in the DS mouse model, we also generated Dp16 mice with Rcan1 restored to two copies (Dp16/Rcan12N) and assessed whether any wheel running alterations that Dp16 mice exhibit could be normalized by Rcan1 dosage correction. Because we observed that RCAN1 knockout and overexpression impacted wheel running in young mice, we compared the light-entrained (diurnal) and free-running (circadian) periodicity, patterning, and rhythmicity of wheel running among young WT, Dp16 and Dp16/Rcan12N littermates. The mice underwent testing in LD12:12 conditions for 2 weeks, followed by constant darkness (DD) for two more weeks.
Mean actograms of wheel running behavior revealed clear distinctions in locomotor activity profiles for WT (Fig. 6A), Dp16 (Fig. 6B), and Dp16/Rcan12N (Fig. 6C) mice across LD12:12 and DD conditions. However, no main effects of or interactions among genotype, condition, or outcome measure were detected for the periodicity of wheel running. Both light-entrained diurnal and circadian period lengths (Fig. 6D) were comparable across groups. These data show that an extra copy of mouse homologs to HSA21 genes and correcting Rcan1 dosage do not affect the periodicity of light-entrained diurnal or circadian locomotor activity rhythms in young Dp16 mice.
Fig. 6
Photic entrainment and circadian periodicity of wheel running are unaltered in young Dp16 mice independent of Rcan1 copy number. Heatmap-style actograms visualizing mean wheel revolution data for A WT, B Dp16, and C Dp16/Rcan12N mice tested in LD12:12 conditions for 14 days (days 8–14 displayed) and immediately transferred to and tested in DD conditions for 14 days (days 1–14 displayed). D Mean wheel running period lengths for light-entrained (left) and free-running (right) young mice. No group differences in either light-entrained or free-running (endogenous) period length were detected. N = 12 WT, 17 Dp16, 13 Dp16/Rcan12N mice. All data are mean ± S.E.M.
Altered wheel running patterns in light-entrained and free-running young Dp16 mice are partially rescued by restoring Rcan1 to disomic levelsWe next measured the intensity of total daily wheel running in young Dp16 mice under light-entrained or free-running conditions (Fig. 7A). To analyze the distribution of wheel running throughout an average day in LD12:12 or DD, we also measured daily wheel running of young Dp16 mice during the active (Fig. 7B) and inactive (Fig. 7C) phases separately and determined the percentage of daily wheel running occurring in the inactive phase (Fig. 7D). In contrast to the periodicity, we found interaction effects of genotype × condition (F2,37 = 3.5; p = 0.042), genotype × outcome measure (F6,72 = 4.4; p = 0.001), and condition × outcome measure (F3,37 = 12.8; p = 7.0E−6) on daily wheel running patterns.
Fig. 7
Altered wheel running patterns in light-entrained and free-running young Dp16 mice are partially normalized by restoration of Rcan1 to two copies. A Mean total daily wheel running of light-entrained (left) and free-running (right) young mice. Light-entrained young Dp16 mice exhibited decreased total daily wheel running compared with WT and Dp16/Rcan12N mice. Free-running young Dp16 mice displayed reduced total daily wheel running relative to both WT and Dp16/Rcan12N mice, and free-running young Dp16/Rcan12N mice exhibited decreased total daily wheel running versus WT mice. B Mean daily active phase wheel running of light-entrained (left) and free-running (right) young mice. Light-entrained young Dp16 mice exhibited decreased active phase wheel running compared with WT and Dp16/Rcan12N mice. Free-running young Dp16 mice displayed reduced active phase wheel running relative to both WT and Dp16/Rcan12N mice, and free-running young Dp16/Rcan12N mice exhibited decreased active phase wheel running versus WT mice. C Mean daily inactive phase wheel running of light-entrained (left) and free-running (right) young mice. No group differences were detected for inactive phase wheel running among light-entrained mice. However, free-running young Dp16 mice displayed reduced inactive phase wheel running relative to WT mice. D Mean percentage of total daily wheel running during the inactive phase for light-entrained (left) and free-running (right) young mice. Light-entrained young Dp16 mice exhibited increased percent inactive phase wheel running compared with WT and Dp16/Rcan12N mice. No group differences were detected for percent inactive phase wheel running among free-running mice. N = 12 WT, 17 Dp16, 13 Dp16/Rcan12N mice. All data are mean ± S.E.M. *p < 0.05; **p < 0.01; ***p < 0.001; ****p < 0.0001
Post hoc testing revealed reduced total daily wheel running in Dp16 mice under both LD12:12 (p = 5.0E−4) and DD (p = 1.0E−7) conditions compared with WT mice (Fig. 7A). Critically, total daily wheel running under LD12:12 also was reduced in Dp16 mice compared with Dp16/Rcan12N mice (p = 0.044) while no significant difference was observed between Dp16/Rcan12N and WT mice (Fig. 7A). Under DD, Dp16/Rcan12N mice displayed total daily wheel running that was lower than in WT mice (p = 0.005) but greater than in Dp16 mice (p = 0.018) (Fig. 7A). These results suggest that Rcan1 dosage correction restores total wheel running in young Dp16 mice at least partially to WT levels.
Similarly, during the active phases under both LD12:12 and DD conditions, Dp16 mice showed less wheel running than WT (p = 1.0E−4 and p = 2.0E−7, respectively) and Dp16/Rcan12N (p = 0.014 and p = 0.015, respectively) mice (Fig. 7B). Compared with WT mice, active phase wheel running in Dp16/Rcan12N mice was not significantly different under LD12:12 but was reduced under DD conditions (p = 0.009) (Fig. 7B). These data indicate active phase hypoactivity in both light-entrained and free-running young Dp16 mice that are mostly rescued by restoring Rcan1 to disomic levels. No wheel running differences were detected during the inactive phase among light-entrained groups (Fig. 7C). However, during the inactive phase under DD, Dp16 mice again showed decreased wheel running relative to WT mice (p = 0.047) while no differences were detected between Dp16/Rcan12N and Dp16 or WT mice (Fig. 7C). When we examined the percentage of total daily wheel running in the inactive phase, Dp16 mice showed an increase compared with WT (p = 0.041) and Dp16/Rcan12N (p = 0.047) mice under LD12:12 but no group differences were detected under DD conditions (Fig. 7D). Together, these results indicate that diurnal and circadian wheel running are reduced in Dp16 mice, with more prominent effects during the active phase. These phenotypes were also largely dependent on Rcan1 dosage because restoring Rcan1 to two copies in Dp16 mice reduced or eliminated them.
Light-entrained diurnal and circadian wheel running rhythms are diminished in young Dp16 mice and are partially normalized by restoring Rcan1 to two copiesBased on our RCAN1 TG results (Figs. 3 and 5), we hypothesized that Rcan1 triplication in young Dp16 mice may also impact wheel running rhythms. Therefore, we compared the characteristics of light-entrained diurnal and circadian wheel running rhythms in young WT, Dp16, and Dp16/Rcan12N mice. To this end, we used cosinor analysis as performed earlier to curve-fit their daily wheel running under LD12:12 (Fig. 8A) and DD (Fig. 8B) conditions. The oscillatory mean (MESOR; Fig. 8C), range (amplitude; Fig. 8D), and phase (acrophase; Fig. 8E) of the fitted curves were estimated as measures of wheel running rhythmicity. Significant group × condition (F2,37 = 5.0; p=0.012), group × outcome measure (F4,72 = 8.9; p = 7.0E−5), and condition × outcome measure (F2,37 = 4.7; p = 0.016) interactions were detected for daily wheel running rhythms.
Fig. 8
Light-entrained diurnal and circadian wheel running rhythms are diminished in young Dp16 mice and are partially normalized by restoration of Rcan1 to two copies. Plots of average daily wheel revolutions collapsed into hourly bins (floating points depicting mean ± S.E.M) with superimposed single-harmonic regression curve fits (mean ± 95% CI bands) for A light-entrained and B free-running young mice. C Mean daily MESOR estimates for wheel running rhythms of light-entrained (left) and free-running (right) young mice. Light-entrained young Dp16 mice exhibited decreased MESOR estimates compared with WT and Dp16/Rcan12N mice. Free-running young Dp16 mice displayed reduced MESOR estimates relative to both WT and Dp16/Rcan12N mice, and free-running young Dp16/Rcan12N mice exhibited decreased MESOR estimates versus WT mice. D Mean daily amplitude estimates for wheel running rhythms of light-entrained (left) and free-running (right) young mice. Light-entrained young Dp16 mice exhibited decreased amplitude estimates compared to WT and Dp16/Rcan12N mice. Free-running young Dp16 mice displayed reduced amplitude estimates relative to both WT and Dp16/Rcan12N mice, and free-running young Dp16/Rcan12N mice exhibited decreased amplitude estimates versus WT mice. E Mean daily acrophase estimates for wheel running rhythms of light-entrained (left) and free-running (right) young mice. There were no group differences in acrophase estimates. N = 12 WT, 17 Dp16, 13 Dp16/Rcan12N mice. All data are mean ± S.E.M. *p < 0.05; **p < 0.01; ****p < 0.0001
Under both light entrainment and free-running conditions, Dp16 mice exhibited decreased MESOR (p = 0.003 and p = 1.0E−7, respectively; Fig. 8C) and amplitude (p = 7.0E−5 and p = 2.0E−10, respectively; Fig. 8D) estimates compared with WT controls. These results indicate dampened whee
留言 (0)