
記住我
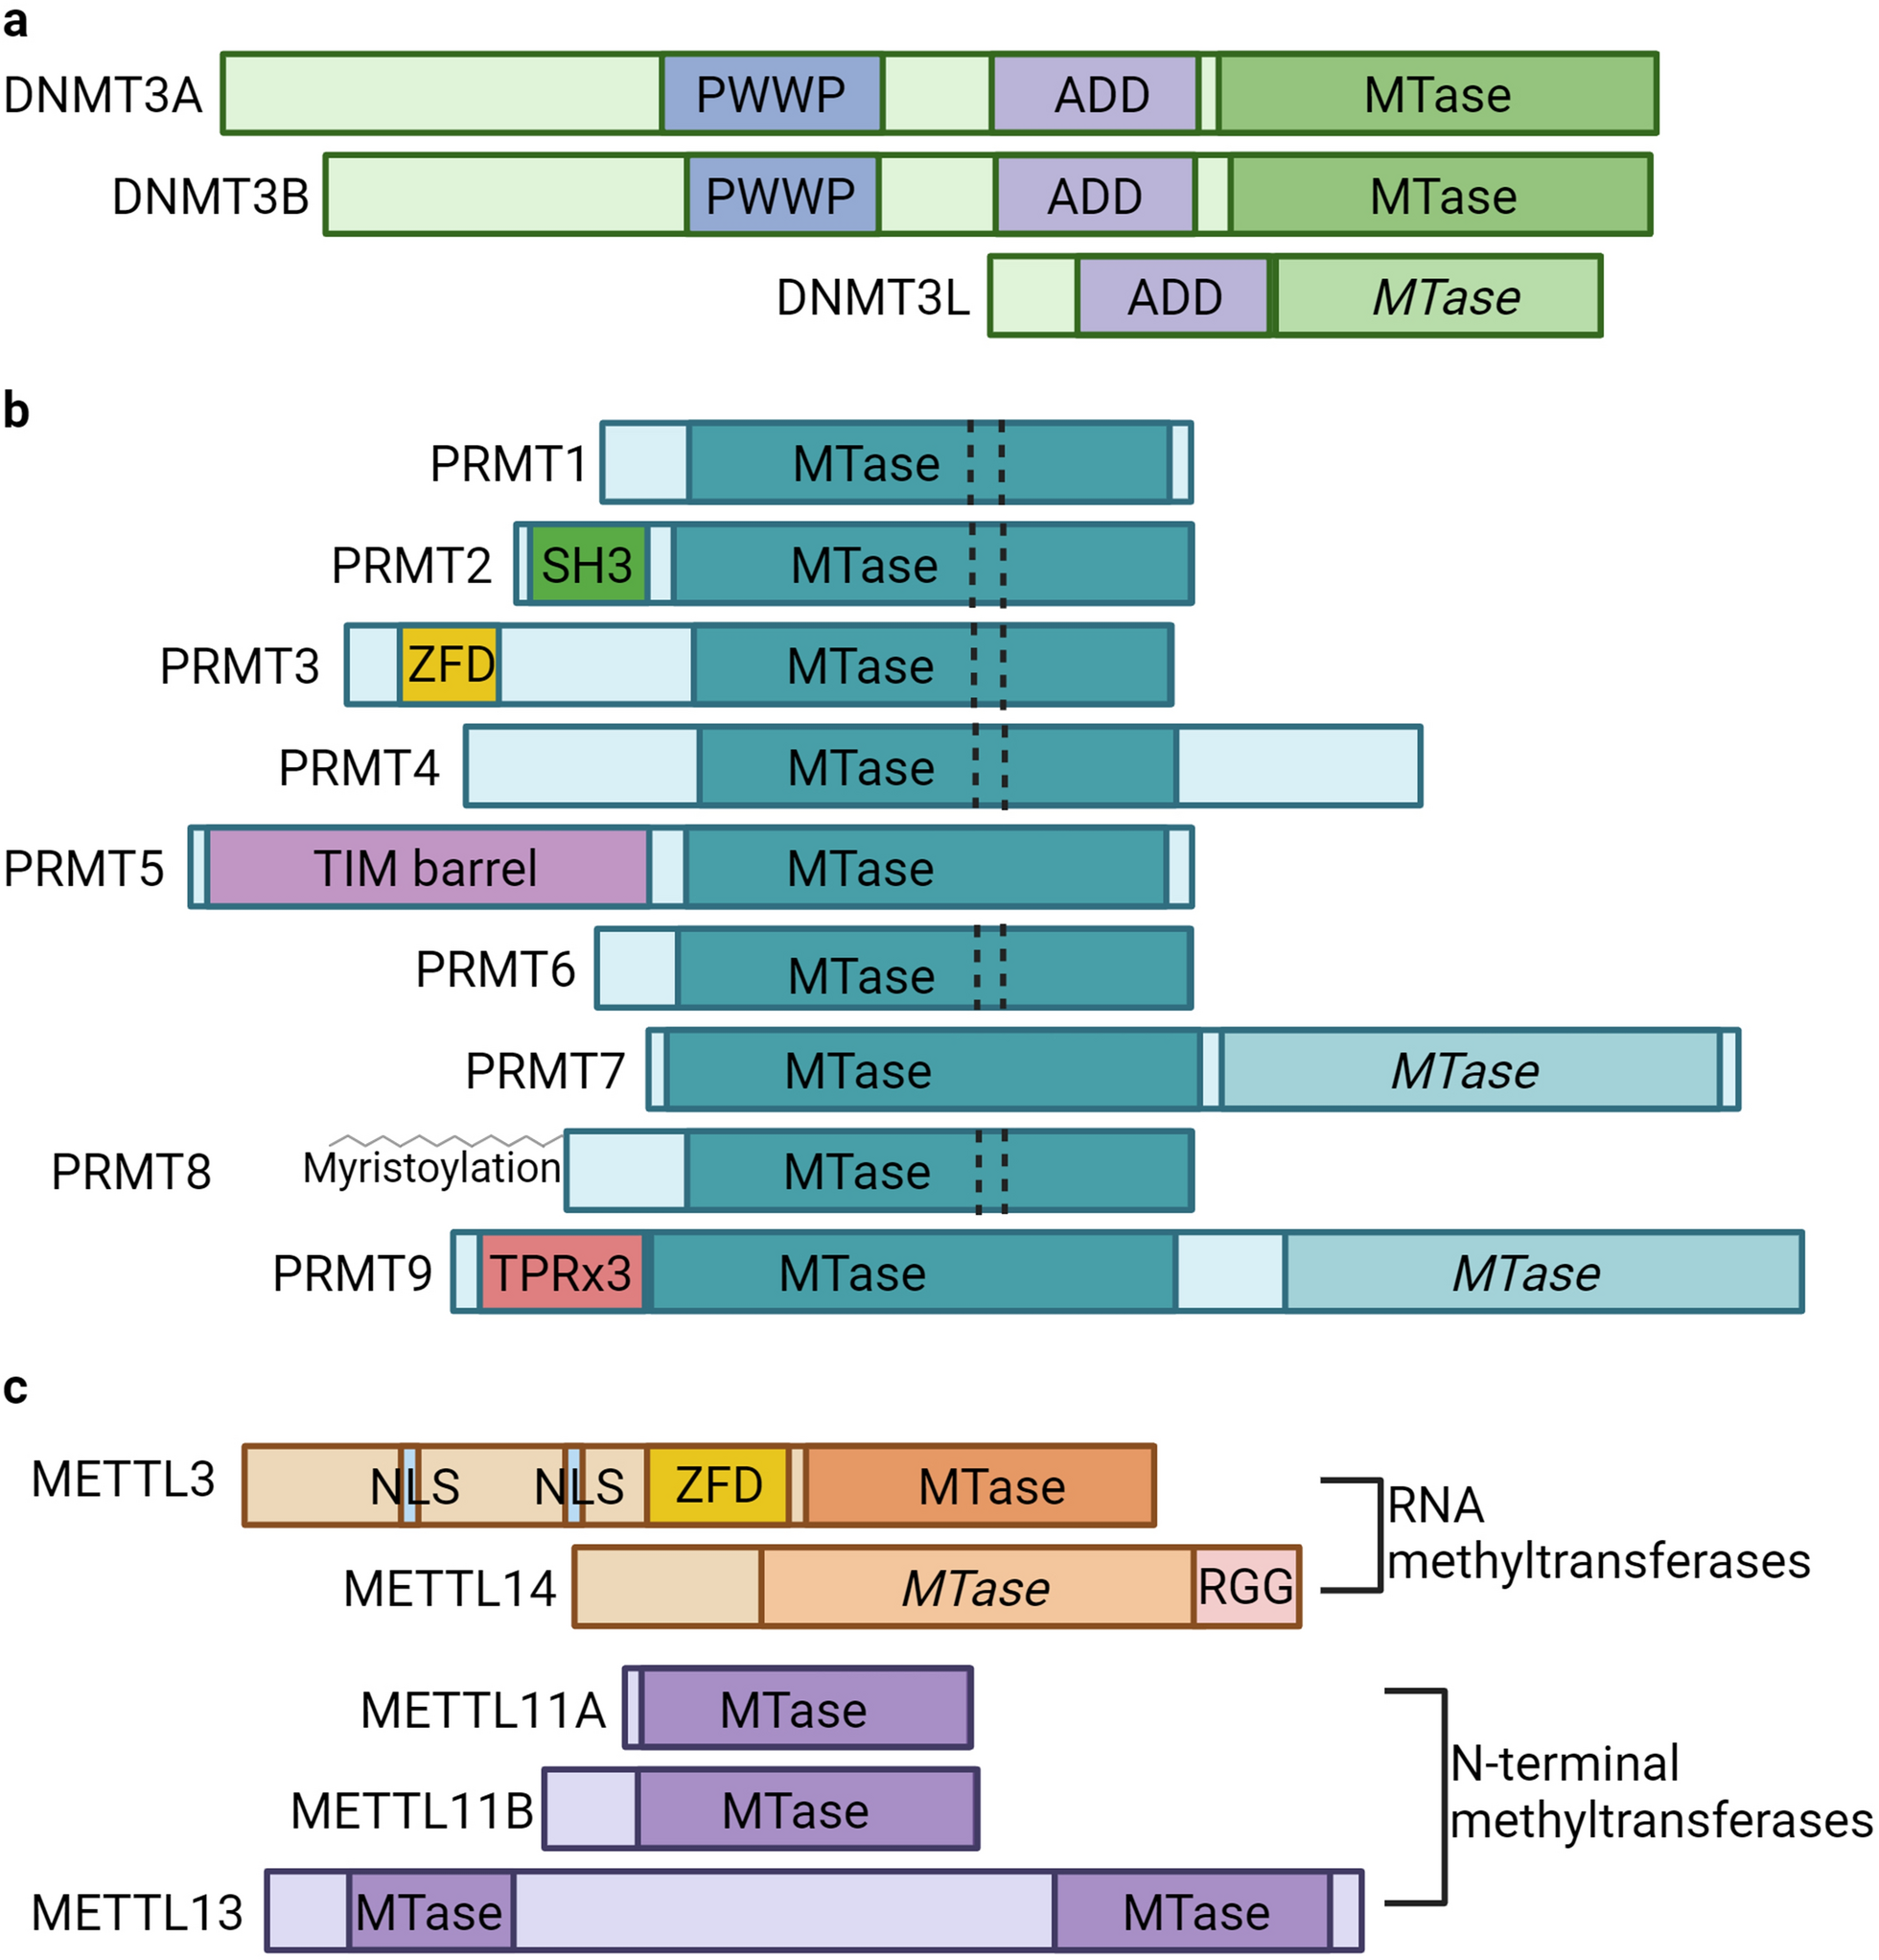
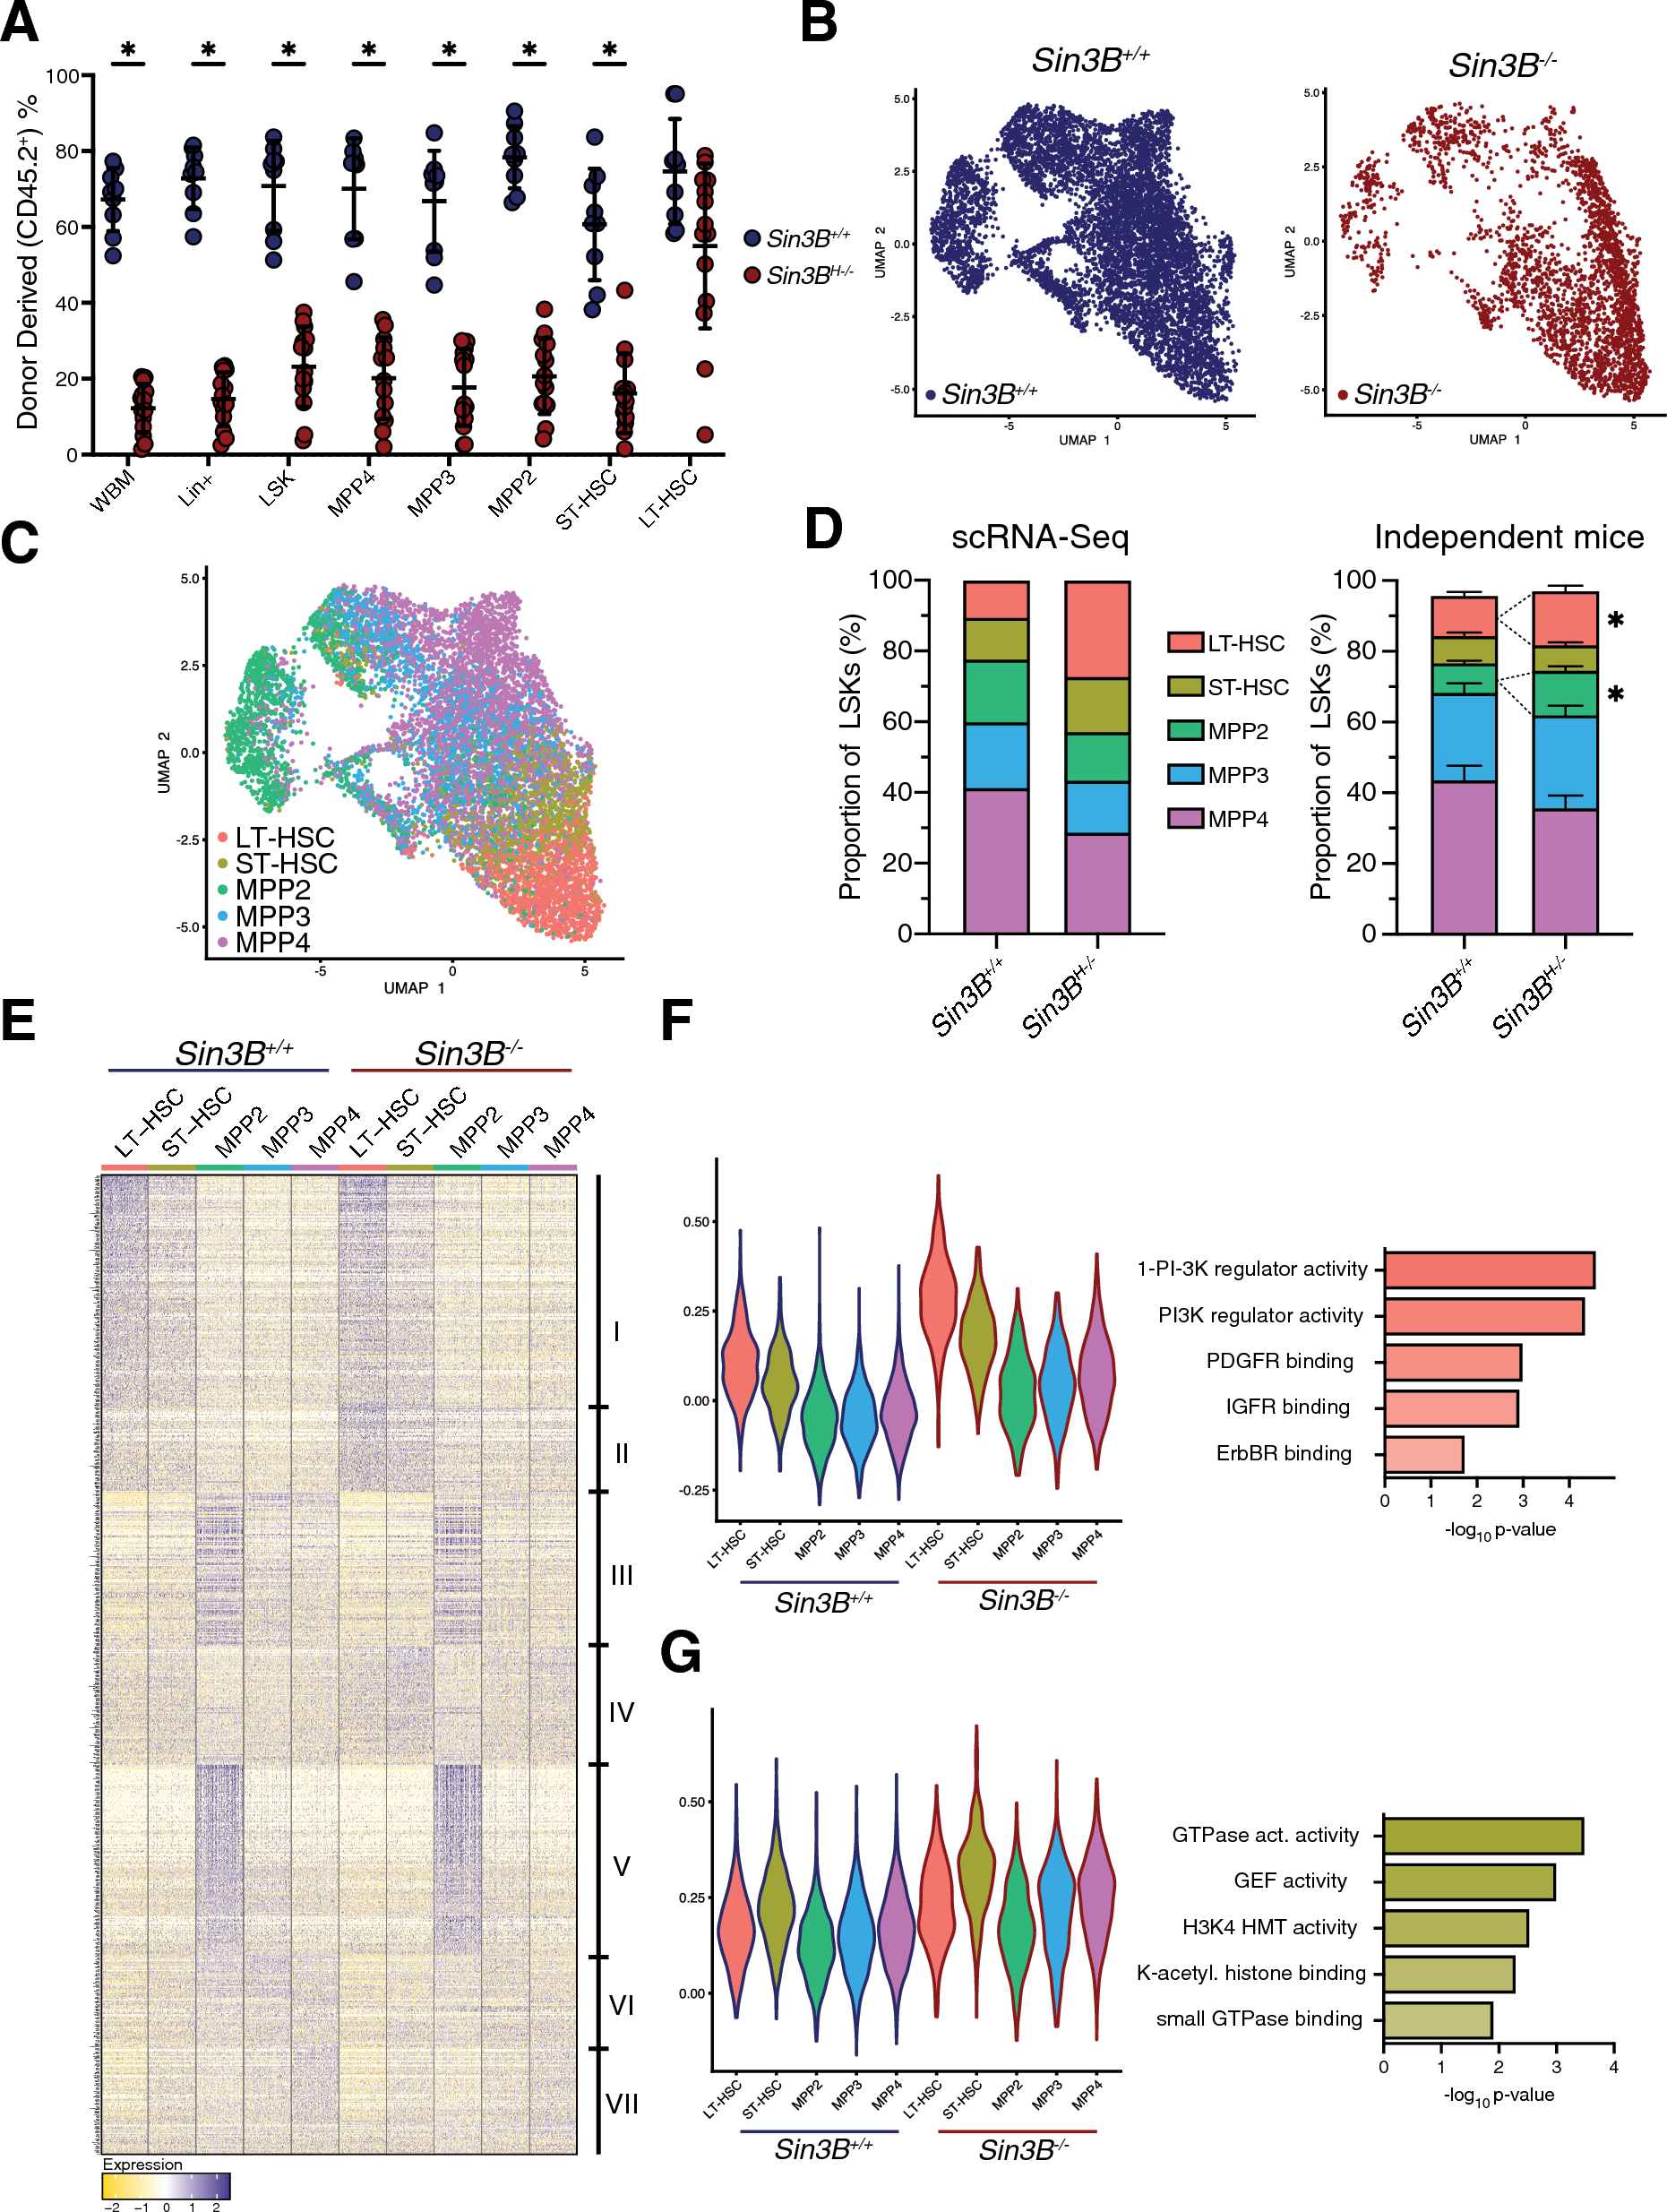
In our studies, the two triploids (3nR2C and 3nRC2) were obtained by backcrossing female allotetraploids of C. auratus red var. and C. carpio L. (4nR2C2) with male C. auratus red var. (2nRR) and C. carpio L. (2nCC), respectively (Fig. 1A) [7, 9]. Eight months after hatching, some growth traits, including body length (BL), body height (BH), height of back muscle (HBM), and body weight (BW), showed higher growth rates in the two triploids (3nR2C and 3nRC2) than in the diploid inbred parents (2nRR and 2nCC) (Fig. 1). Among these traits, similar values in HBM were observed between the two triploids (Fig. 1). Moreover, the ratios of BL vs. BH in the two triploids exhibited intermediate characteristics between the inbred parents (Fig. 1). Specifically, the two triploids exhibited a predilection for their maternal parents for their distinct growth phenotypes involving HBM and ratios of BL vs. BH (Fig. 1A, B). These differences may be related to their genotypes and play a key role in heterosis.
Fig. 1
Heterosis of growth traits in the two triploid fish (8 months after hatching). A The procedure for the two allotriploids (3nR2C and 3nRC2). B The appearance of the two triploids and their inbred parents. The ratio of average body height and body length (H/L) is marked. C The height of the back muscle. D The genotypes and weights of the four fish
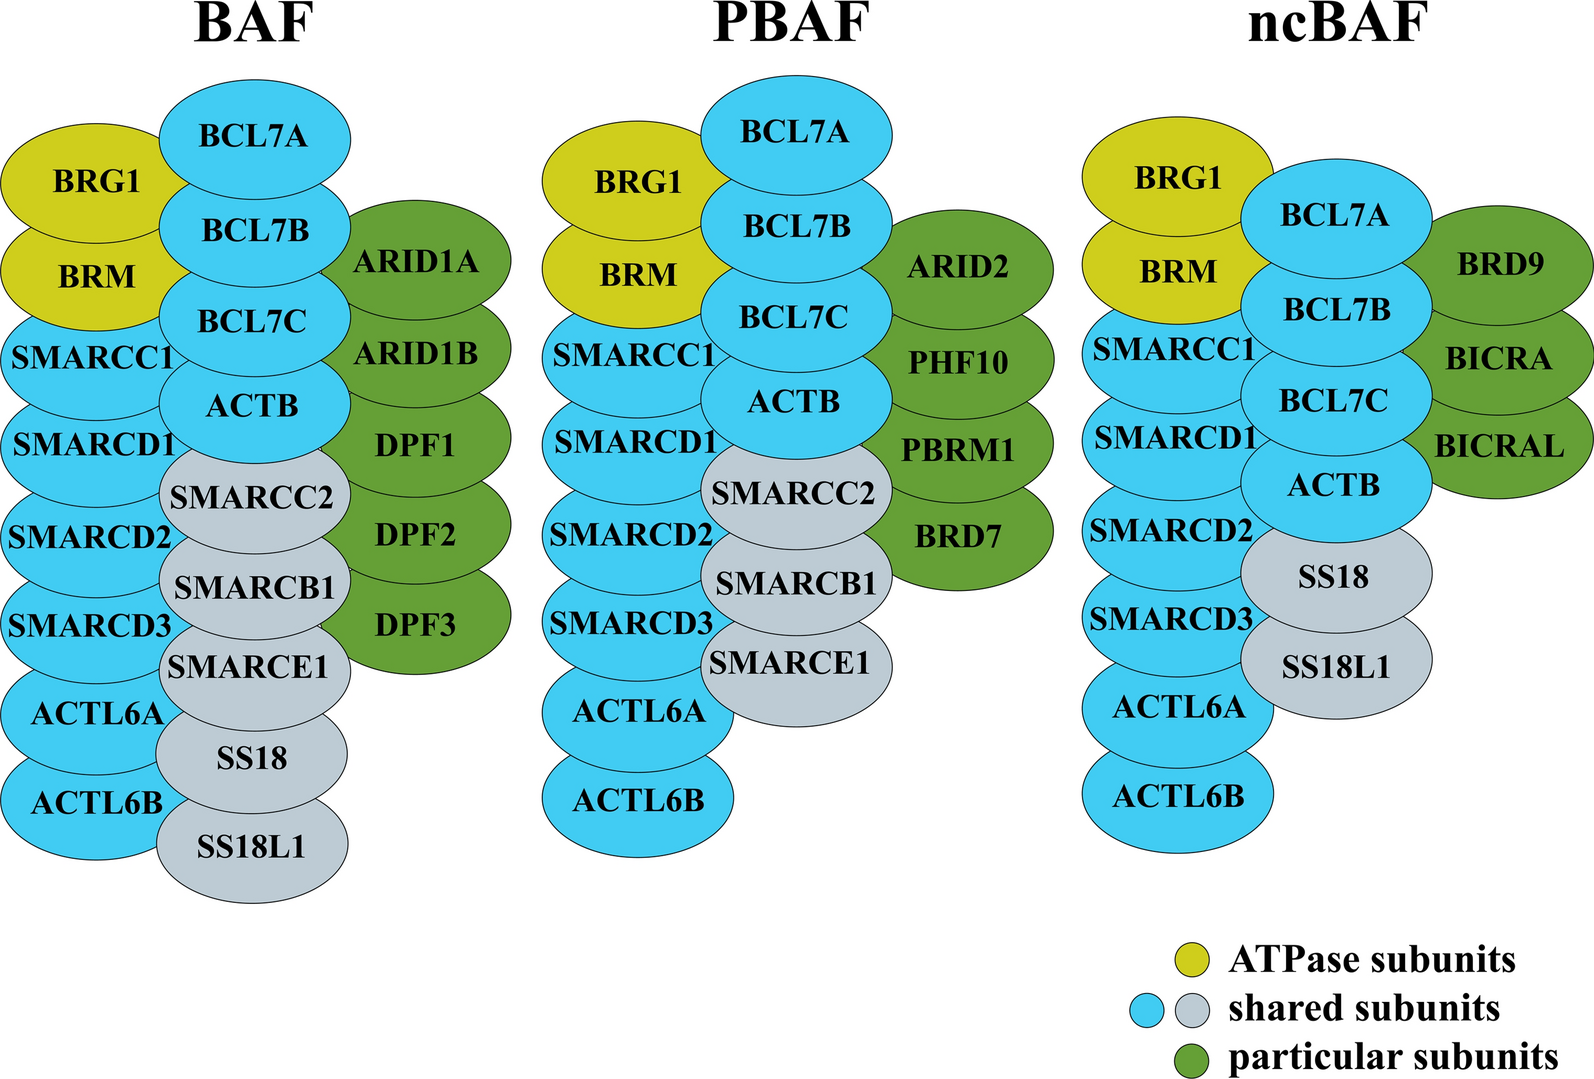
Cis- and trans-regulation models of DNA methylation modification and miRNA regulationTo investigate potential genetic mechanisms and their roles in the heterosis of growth trait heterosis, methyl-seq, miRNA-seq, and mRNA-seq data were obtained from 3nR2C, 3nRC2, and the two inbred parents. The complex regulation of gene expression in the two allotriploid fish led us to establish a model for investigating cis- and trans-regulation in DNA methylation modification and trans-regulation in miRNA regulation. In the allotriploid system, the expression of homoeologs R (originating from 2nRR) and C (originating from 2nCC) was not just regulated by their respective methylation modifications but also by similar miRNA systems in the two subgenomes (Fig. 2). The development of diagrammatic regulatory systems aided us in better understanding cis- and trans-regulation in allotriploids, as well as their effects on phenotype. Cis- and trans-regulation in hybrids was assessed as described by Wang et al. [22, 23]. The changes in DNA methylation levels and the expression of their regulated genes from the inbred parents to their triploids are used to assess DNA methylation-mediated cis-regulation. MicroRNA-mediated trans-regulation in hybrids is then regulated by trans-acting factors involving microRNA, which was assessed by comparing the change trends in microRNA expression and targeted gene expression between inbred parents and their triploids. The combined genomes of 2nRR and 2nCC were used as a reference genome for the two triploid fish in our subsequent analyses for three reasons: (1) the lack of an assembly genome for the triploids; (2) completed sets of original chromosomes from the two inbred parents [9]; and (3) research on conserved homoeologous genes in subgenomes. Therefore, analyses of orthologous gene pairs between 2nRR and 2nCC, and homoeologous gene pairs between subgenomes R and C in the two triploids (3nR2C and 3nRC2), were performed to study the interactions between DNA methylation and miRNA and mRNA expression in the triploids.
Fig. 2
A model for gene expression mediated by DNA methylation and miRNA in the allotriploid complex of red crucian carp (2nRR) and common carp (2nCC). In the hybrid system, the small RNAs originating from subgenomes R and C regulated the expression of homoeologous genes in the triploids. A similar regulatory model was described in Arabidopsis allotetraploid [22, 23]
Methylation divergence between subgenomes R and CTo uncover DNA methylation differences from diploids to allotriploids, we performed whole-genome bisulfite sequencing (WGBS) in the muscles of 2nRR, 2nCC, 3nR2C, and 3nRC2 fish. After mapping the reads of the DNA methylation data to the 2nRR and 2nCC combined genome, 270.85 Gb (48.91%) of data uniquely mapped in the two triploids (Additional file 1: Table S1). Based on the mapped results, 138.39 Gb uniquely mapped data (49.33% of all methylation data) were detected in the three 2nCC samples, while 150.85 Gb data (54.73%) were found in 2nRR (Additional file 1: Table S1). Focusing on cytosines, the methylation levels in CpG islands (70.72%) were higher than those in CHH (0.30%) and CHG (0.30%) across all samples. However, the levels of methylation divergence at CpG and nonCpG sites were conserved among the two triploids and the inbred parents (Additional file 1: Table S2).
Although similar genome sizes were detected between the 2nRR (1.42 Gb) and 2nCC (1.49 Gb) genomes, different distributions of transposable elements (TEs) between them reflected that TEs had contributed to the diversified species divergence after a common allotetraploidization in their ancestors [11, 24] (Additional file 1: Table S3 and Fig. S1A). More TEs were found in 2nRR (38.99%) than in 2nCC (34.76%). The top three TE difference ratios between 2nRR and 2nCC were observed in orthologous chromosome pair (OCP) 43 (16.75%), 2 (10.04%), and 5 (10.06%). Meanwhile, high DNA methylation was observed in the region of the TEs (Additional file 1: Fig. S1B and C). We first identified global TE methylation levels and found that the TE methylation levels in 3nR2C trended toward 2nRR, while those in 3nRC2 trended toward 2nCC (Additional file 1: Fig. S1B). Then, we further detected the TE methylation levels in different subgenomes in the triploids and the respective ones in the inbred parents. Higher TE DNA methylation was observed in both subgenomes of 3nR2C than in 3nRC2 (Additional file 1: Fig. S1B).
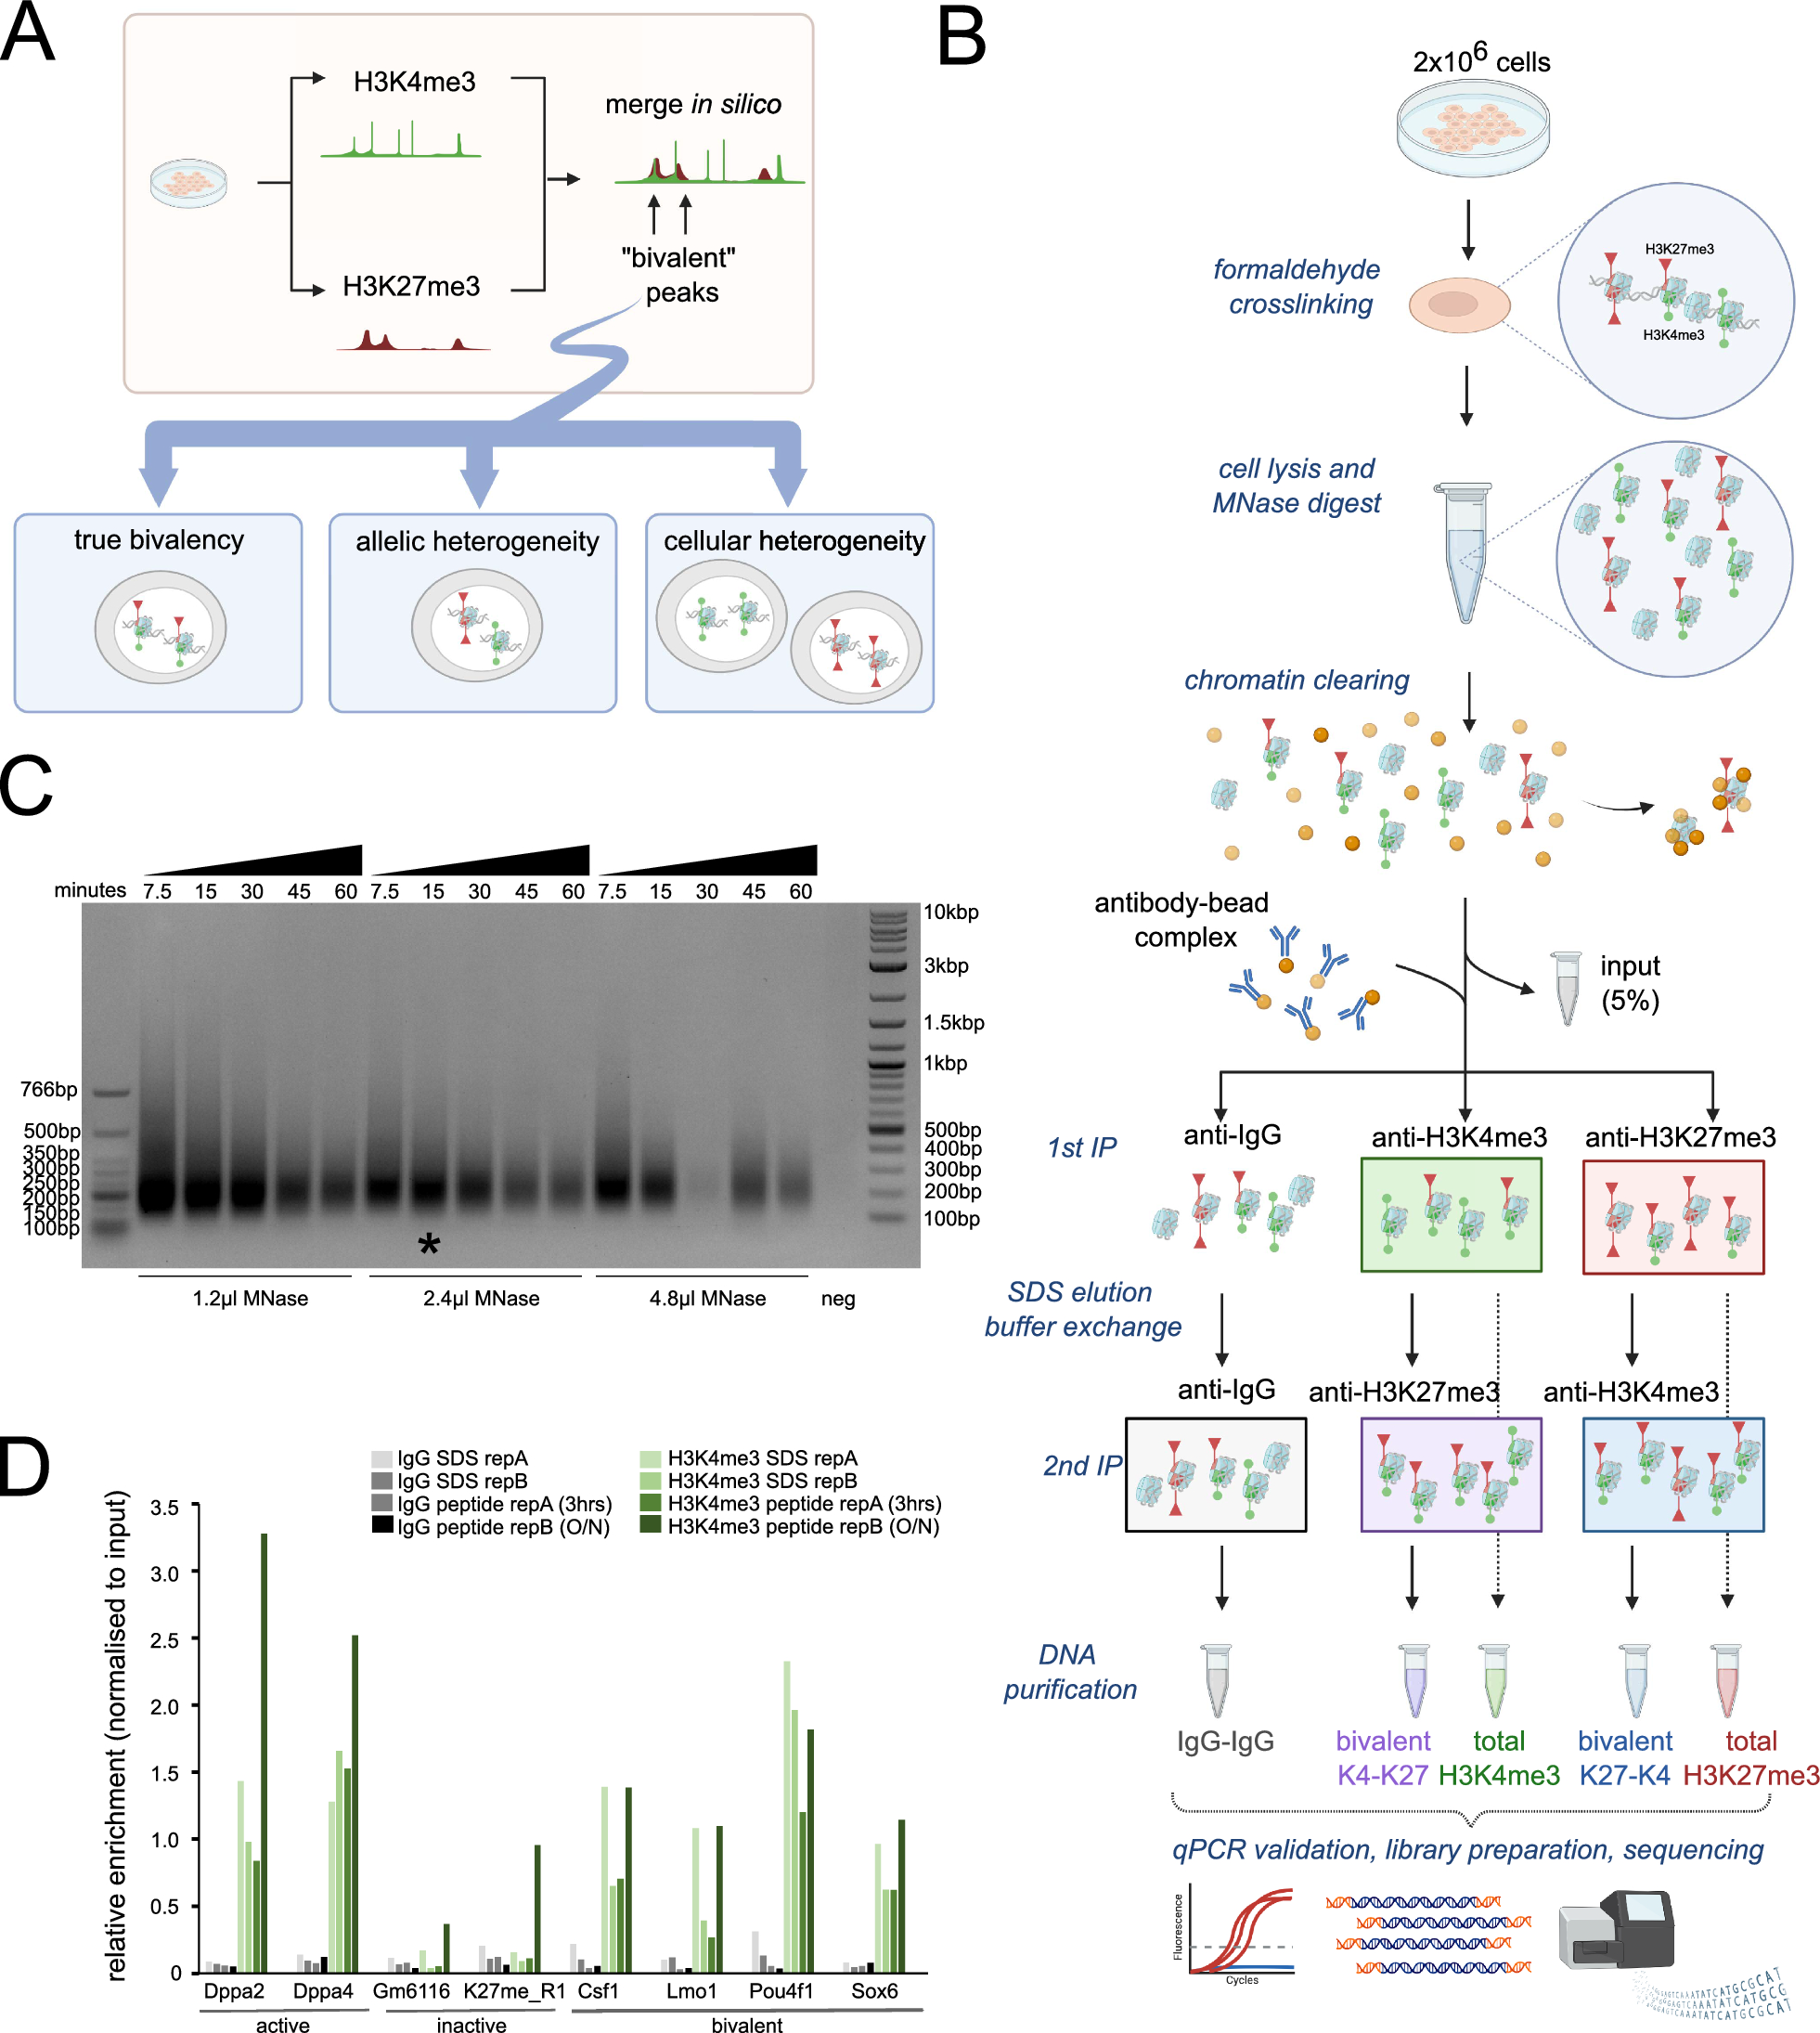
Genome-wide analyses showed that methylation levels were higher in 2nRR than in 2nCC (p < 0.01 in t-test, Fig. 3A and Additional file 1: Table S4). These results showed that DNA methylation divergence occurred between 2nRR and 2nCC after their shared ancestral allotetraploidization [11, 24]. Meanwhile, these DNA methylation divergences in the inbred parents were also observed between subgenomes R and C in the two triploids (Fig. 3A and Additional file 1: Table S4). These results suggest high heritability for DNA methylation. Then, the DNA methylation differences between the four fish were mainly enriched in the first exon coding region, 2 kb upstream of the transcription start site (TSS), and 2 kb downstream of the transcription termination site (TTS) (Additional file 1: Fig. S2). Moreover, clustering analysis in the subgenome showed that subgenome R in the two triploids clustered with 2nRR, yet subgenome C clustered with 2nCC (Additional file 1: Fig. S2). Similar to the TE methylation levels, the methylation levels of 2 kb upstream of TSS (Up 2 k) and 2 kb downstream of TTS (Down 2 k) were higher in the two triploids than in the inbred parents (p < 0.01), except those in subgenome C of 3nRC2, in which the DNA methylation levels were close to those of the parental 2nCC (Fig. 3A). These results shed light on high DNA methylation and low transcriptional efficiency in triploids.
Fig. 3
Incomplete dosage compensation regulated by DNA methylation levels. A DNA methylation levels of different gene elements in the subgenome of the two triploids and the inbred parents. Each region was divided into twenty bins based on total lengths. B Assessments of dosage compensation based on the different in silico values of homoeolog expression of the two triploids compared with those of their inbred parents. The actual values of two homoeolog expression in the triploids are marked as “ × 1.” Duplicated values of two homoeolog expression are marked as “ × 2.” Fourfold values of two homoeolog expression are marked as “ × 4.” C Differentially methylated regions (DMRs) in the two triploids and their inbred parents. D The distribution of differentially methylated genes (DMGs), for which the DMRs were located in the region of “Up in 2 k.” Crimson and dark blue represent higher methylation levels in the former comparison, while light red and light blue represent higher methylation levels in the latter comparison. The symbol “*” represents unequal numbers of gene copies between subgenomes R and C, while the symbol “**” represents equal numbers. E The potential homoeologous recombinant genes (HRGs), led by the exchange of subgenomes R and C, were predicted by the decrease of the difference in the methylation ratio between two homoeologs in both the triploids in comparison to the inbred parents. F Recombination events between the 2nRR and 2nCC subgenomes were observed in HRGs of 3nR2C and 3nRC2 based on whole-genome resequencing data. Red solid line represents in silico values of the ratio of 2nRR vs. 2nCC (log10(2) = 0.30103 in 3nR2C, log10(0.5) = − 0.30103 in 3nRC2), which were calculated based on the gene copy number of 2nRR and 2nCC in each homoeologous gene pair of the two triploids. Green dashed line represents the values of the significant ratio of 2nRR vs. 2nCC (log10(1) = 0 and log10(4) = 0.60206 in 3nR2C; log10(0.25) = − 0.60206 and log10(1) = 0 in 3nRC2), which were calculated based on the gene copy number of 2nRR and 2nCC in each homoeologous gene pair of the two triploids. Dots represent the values of the ratio of 2nRR vs. 2nCC (log10(x)), which were obtained from the read number (the average number in a 1 kb region) of 2nRR and 2nCC in each homoeologous gene pair of the two triploids. The blue solid line is obtained from the treatment of values (black dots) with method “loess” in ggplot2. Black dots are distributed between the two green lines, while the red dots (51 in 3nR2C and 50 in 3nRC2) are allocated outside of the two green lines
Incomplete dosage compensation led by DNA methylationRecent studies have reported incomplete dosage compensation [9]. To investigate whether DNA methylation is a potential cause of this, we performed integrated analyses of differential methylation and gene expression. First, genotype analysis showed two sets of 2nRR chromosomes and one set of 2nCC chromosomes in 3nR2C (genotype type: AAB), and two sets of 2nCC chromosomes and one set of 2nRR chromosomes in 3nRC2 (genotype type: ABB) [9]. The two sets of R genomes/subgenomes were in 2nRR and 3nR2C, whereas the two sets of C genomes/subgenomes were in 2nCC and 3nRC2. However, the gene expression of R homoeologs in 3nR2C (× 1 in 3nR2C) was significantly lower than that in 2nRR (× 1) (p < 0.01 in t-test, Fig. 3B). Based on the same regulatory systems, we doubled the gene expression values of the R and C subgenomes in the two allotriploids (3nR2C and 3nRC2) (× 2). Then, we found that the doubled values of the R subgenome in 3nR2C (× 2 in 3nR2C) were equal to those in 2nRR (× 1) (p > 0.05, Fig. 3B). A similar phenomenon was observed between the doubled values of the C subgenome in 3nR2C (× 2 in 3nRC2) and those in 2nCC (× 1) (p > 0.05, Fig. 3B). So, we inferred that the four sets of R and C subgenomes in 3nR2C and 3nRC2 can transcribe the same dosage of mRNAs as the parental 2nRR and 2nCC based on the regulatory models in the two triploids.
In analyses of differentially methylated regions (DMRs) between the two triploids and their inbred parents, most DMRs in subgenome R were detected in the comparison “3nRC2 vs. 2nRR” (11,152), while the fewest DMRs were observed in the comparison “3nR2C vs. 2nRR” (Fig. 3C). In subgenome C, most DMRs were observed in the comparison “3nR2C vs. 3nRC2” (3,999), while the fewest DMRs were observed in the comparison “3nRC2 vs. CC” (Fig. 3C). Obviously, many DMRs were distributed between the unequal subgenomes of R and C. In the comparison “3nR2C vs. 3nRC2,” we observed that more gene copies always led to higher methylation levels in the triploids (Fig. 3C, D). Specifically, these effects were more obvious in subgenome R than in subgenome C (Fig. 3C). In the comparisons of triploids and diploids, higher methylation levels and a greater number of DMGs reflected that whole genome-wide methylation modification inhibited transcription of both homoeologs R and C and led to the triploid expression levels being close to the diploid states.
DNA methylation changes accompanied by homoeologous recombinationWe identified 165 hypermethylated (DMGsA–B > 0.6) and 740 hypomethylated genes (0.4 < DMGsA–B < 0.6) based on the methylation differences between 2nRR and 2nCC. Among these genes, 15 hyper-DMGs and 114 hypo-DMGs were shared in both the triploids, suggesting that the potential DNA methylation changes may have originated from the parental 4nR2C2 (Fig. 3E). These DMGs were considered potential homoeologous recombinant genes (HRGs) because homoeologous recombination (HR) always leads to a decrease in DNA methylation divergence between homoeologs R and C in promoter regions (Fig. 3E). For assessing the accuracy of HRGs predicted by DNA methylation, the mapped read number of homoeologs R and C was obtained from whole-genome resequencing, and unequal HRs were detected in some genes (52 in 3nR2C, 50 in 3nRC2, red dots, Fig. 3F) based on the ratios of the homoeologs R vs. C [25]. Meanwhile, a similar shape (blue line, Fig. 3F) between 3nR2C and 3nRC2 indicated a similar distribution of HRs in these genes, suggesting that the prediction that the HRs were inherited from paternal 4nR2C2 was highly accurate.
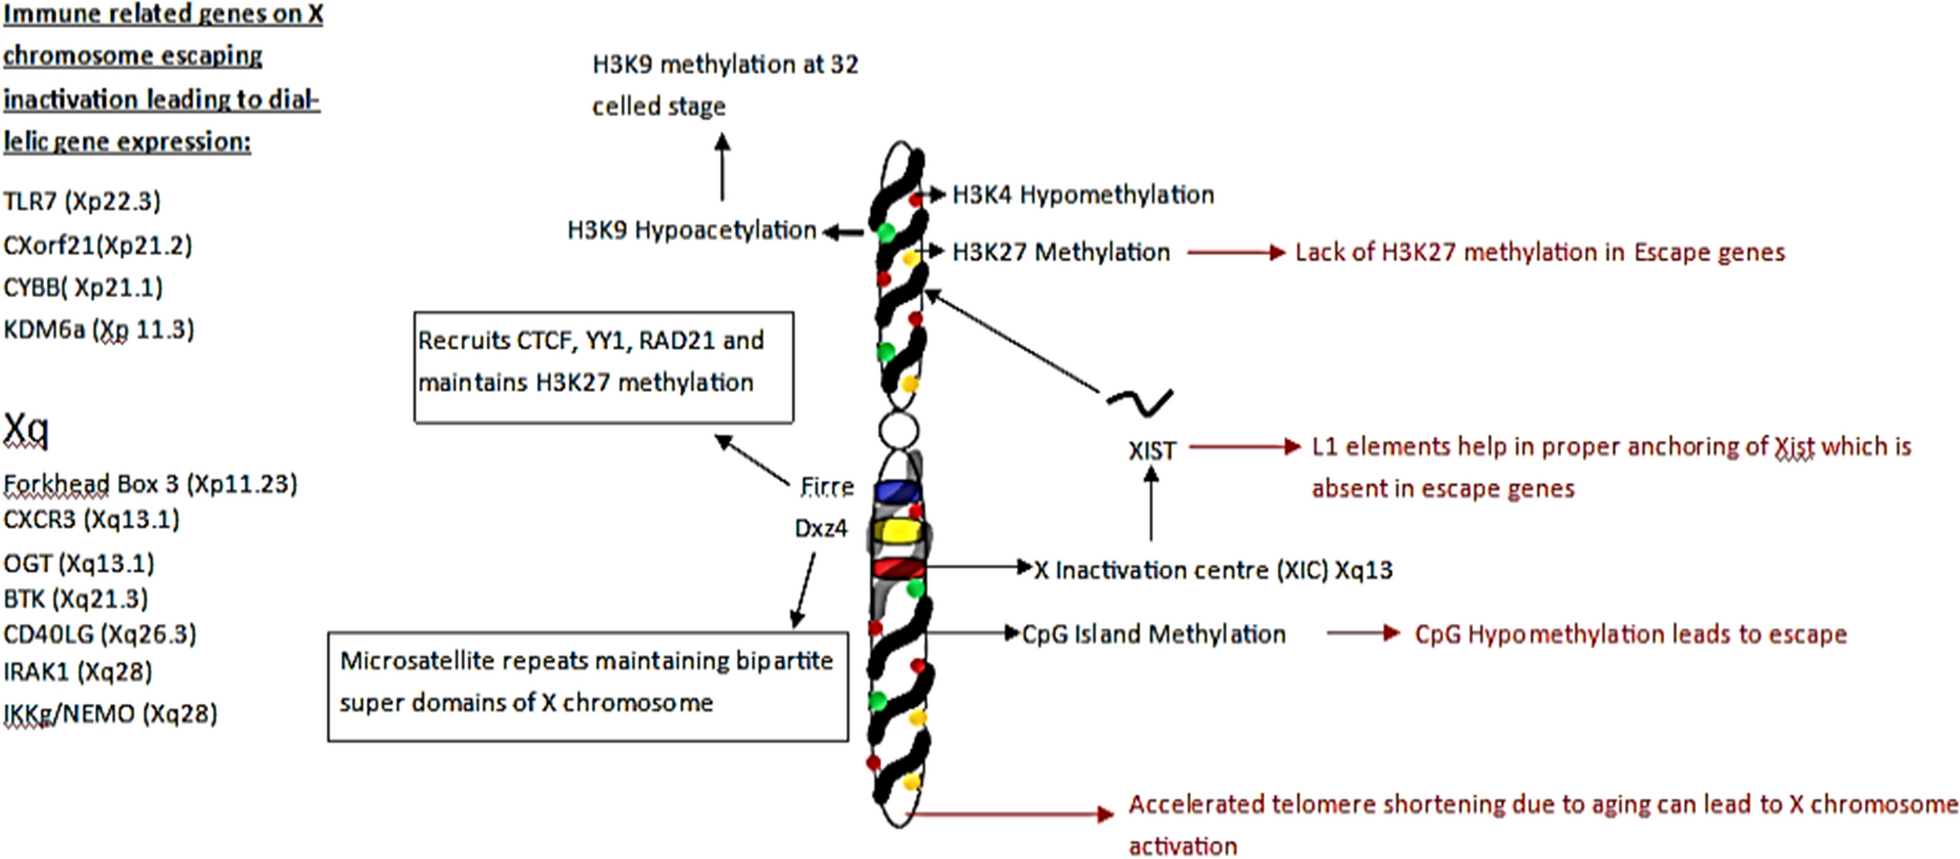
Gene expression regulated by DNA methylationDNA methylation in the promoter region is a major epigenetic modification and is always negatively correlated with gene expression. In the hybrid system of the two triploids, 17 and 14 genes showed negative correlation between differential expression (DE) and differential methylation (DM) in subgenomes R and C, respectively (Fig. 4A–B). These genes contributed to multiple functions, including regulation of response to stimulus and cellular metabolic process (Additional file 1: Fig. S3). Moreover, comparing the two triploids with their inbred diploid parents, various genes were identified with negative correlations between the DE and DM values (red dots, Additional file 1: Fig. S4), while other genes showed a positive correlation (black dots, Additional file 1: Fig. S4). Integrated analyses of methylation and gene expression changes demonstrated that only a few genes were regulated by DNA methylation, while most of the expressed genes might be regulated by trans-regulation in the hybrid systems.
Fig. 4
Gene expression regulated by DNA methylation. A Negative correlation between values of differential expression (DE) and differential methylation (DM) in subgenome R of the two triploids and 2nRR. B Negative correlation between DE and DM values in subgenome C of the two triploids and 2nCC. C The expression of CREB1. D The expression of STAT5A. E The methylation level of CREB1 was higher in homoeologs of the two triploids than in their inbred parents. F The methylation level of STAT5A was higher in homoeologs of the two triploids than in their inbred parents
Patterns of miRNA regulationIn a hybrid system, miRNA regulation is a key trans-regulatory mechanism that may play a dominant role in gene expression regulation. We obtained 129.09 million clean reads (2.91 Gb) from small RNA-seq from the four fish with three biological replicates (Additional file 1: Table S5). Among these data, 121.10 million reads mapped to the combined genomes of the inbred parents, and 258 miRNAs were detected in 2nRR, 2nCC, and the two triploids using the zebrafish miRNA. The multiple transcription sites of some miRNAs were not just detected in 2nRR and/or 2nCC but also in the subgenomes of R and C in the two triploids. Under these conditions, we established six patterns for classifying these conserved miRNAs, which might result from random duplication of chromosome regions or whole-genome duplication (Fig. 5A). For the allotriploids, miRNAs in Pattern 1 (114) and Pattern 4 (51) possessed four and two copies, respectively, that were evenly distributed in subgenomes R and C (Fig. 5A). In addition, three copies were observed in 65 (Pattern 2) and 34 (Pattern 3) miRNAs, in which two miRNA copies were distributed in subgenome C or R, respectively, and the other copy was distributed in the other subgenome (Fig. 5A). The miRNAs in Pattern 5 had two copies distributed in only subgenome R (26) or subgenome C (6) (Fig. 5A). Pattern 6 describes miRNAs with only a single copy in subgenome R (133) or C (69) (Fig. 5A). The evolutionarily conserved class of miRNAs sheds light on the relationship between miRNA copy number and their expression.
Fig. 5
miRNA expression in allotriploids. A Schematic diagrams of miRNA patterns in the triploids. “Pattern 1” represents the same miRNA allocated to two locations in both subgenomes R and C. “Pattern 2” represents the same miRNA detected in one location in subgenome R and two locations in subgenome C. “Pattern 3” represents the same miRNA detected in two locations in subgenome R and one location in subgenome C. “Pattern 4” represents the same miRNA allocated to one location in both subgenomes R and C. “Pattern 5” represents the same miRNA allocated to two locations in subgenome R or C. “Pattern 6” represents the miRNA specifically detected in one location in subgenome R or C. The number of miRNAs in each pattern is marked in the figure. B–E DE of miRNAs among the four fish
Because of the evolutionarily conserved miRNAs, the expression of each miRNA was calculated by combining the expression values of subgenomes R and C based on the mapped files and annotation results. The analysis of differential expression (DE) was performed on 256 miRNAs, of which 33 miRNAs were detected between 3nRC2 and 2nCC, and 62 miRNAs were detected between 3nR2C and 2nCC (Fig. 5B, C and Additional file 1: Fig. S5A). DE was detected in 28 miRNAs between 3nRC2 and 2nRR, and for only two miRNAs between 3nR2C and 2nRR (Fig. 5D and Additional file 1: Fig. S5A). Meanwhile, 26 miRNAs showed DE between 3nRC2 and 3nR2C (Fig. 5E). Among these miRNAs, dre-mir-182 and dre-mir-183 showed DE in the three comparisons (Additional file 1: Fig. S5B).
Contribution of DNA methylation modification and miRNA regulation to heterosis of growth traitsOur aims were to investigate the genetic mechanisms of DNA methylation and miRNA in triploids and to further understand their potential effects on heterosis of growth traits. The functional distribution of the hyper-/hypo-DMGs was performed and annotated with Gene Ontology databases and 97 pathways (Additional file 1: Table S6 and Fig. S6). Among these genes, six genes were enriched for the growth hormone synthesis, secretion, and action pathway (map04935), while nine genes were distributed in the insulin secretion pathway (map04911) (Additional file 1: Figs. S7, 8). Meanwhile, high methylation levels led to the expression silencing of homoeolog C in ATF4 and SNAP25 of the two triploids, while low methylation levels and expression of homoeolog R were detected (Fig. 4E). On the contrary, low methylation levels of homoeolog R were observed in CREB1 and STAT5A, while high methylation levels were detected in homoeolog C (Fig. 4E). Some growth-regulated genes were regulated by miRNA regulation, especially in the growth hormone synthesis, secretion, and action pathway (map04935). Among these growth-regulated genes, the expression levels of P85B and EP300 were regulated by mir-205, which showed DE between the two triploids (Fig. 5E). However, no DE of the two genes between the two triploids indicated a complex regulation system in the triploids. The heterosis of growth traits in the triploids might involve cooperative changes to a series of growth-regulated genes.
留言 (0)