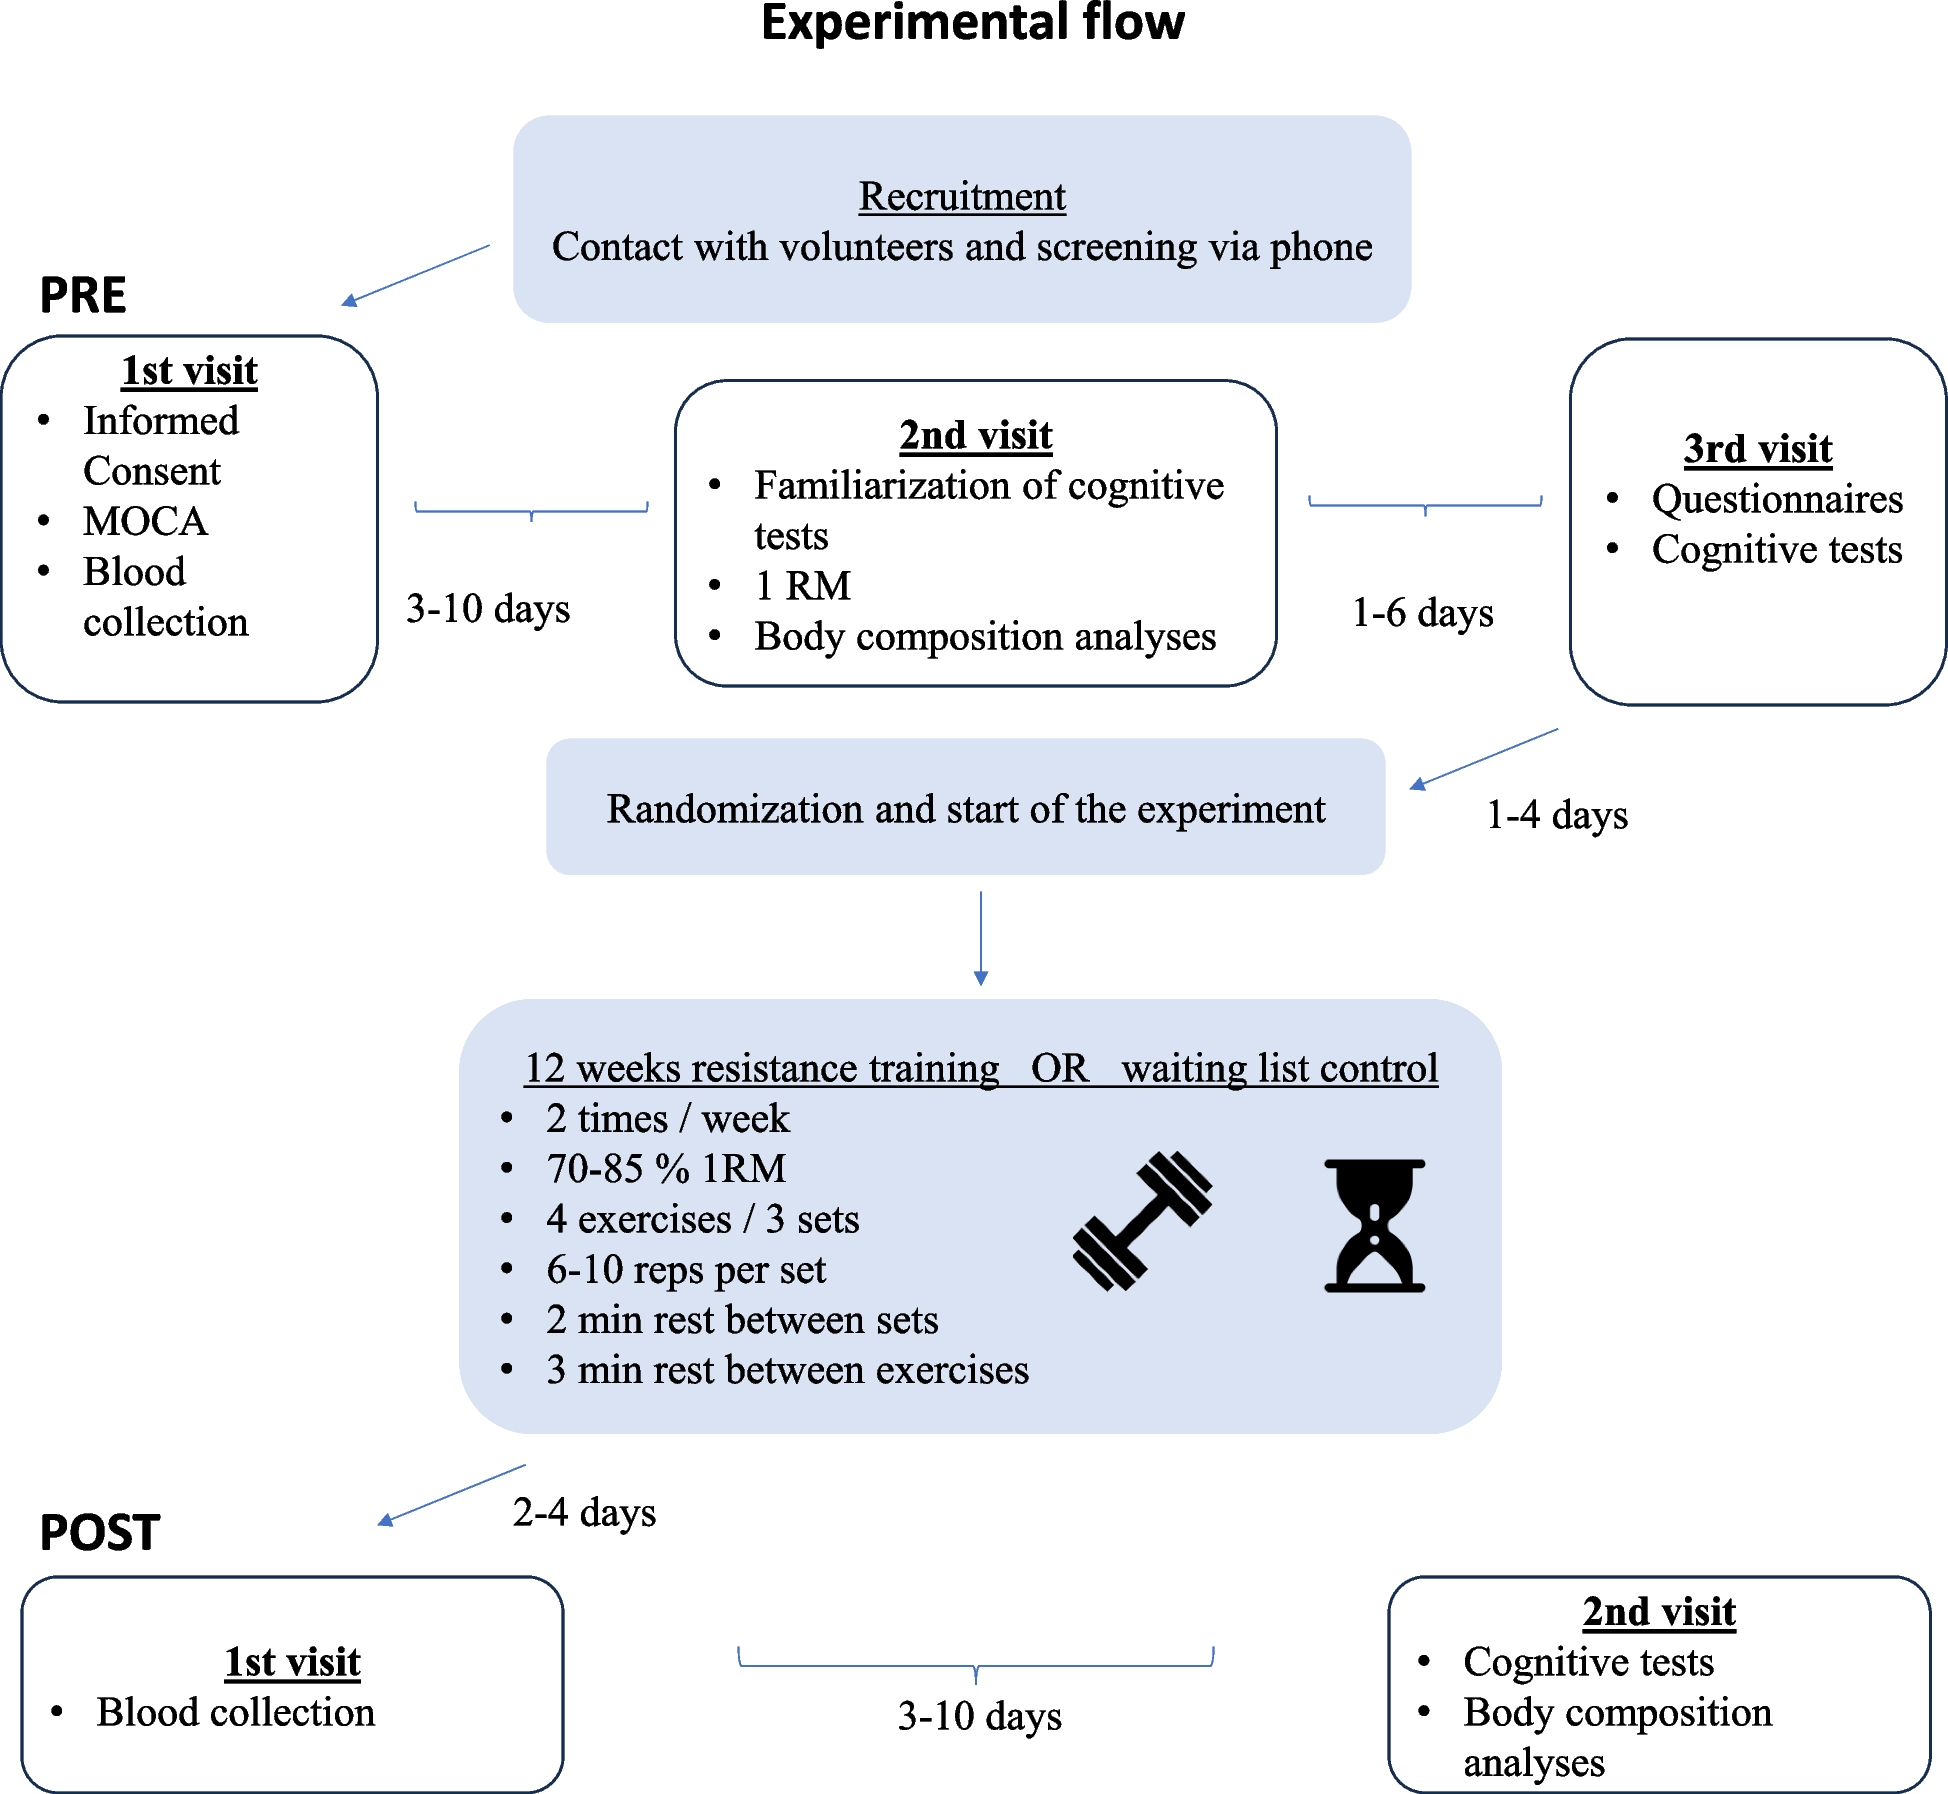
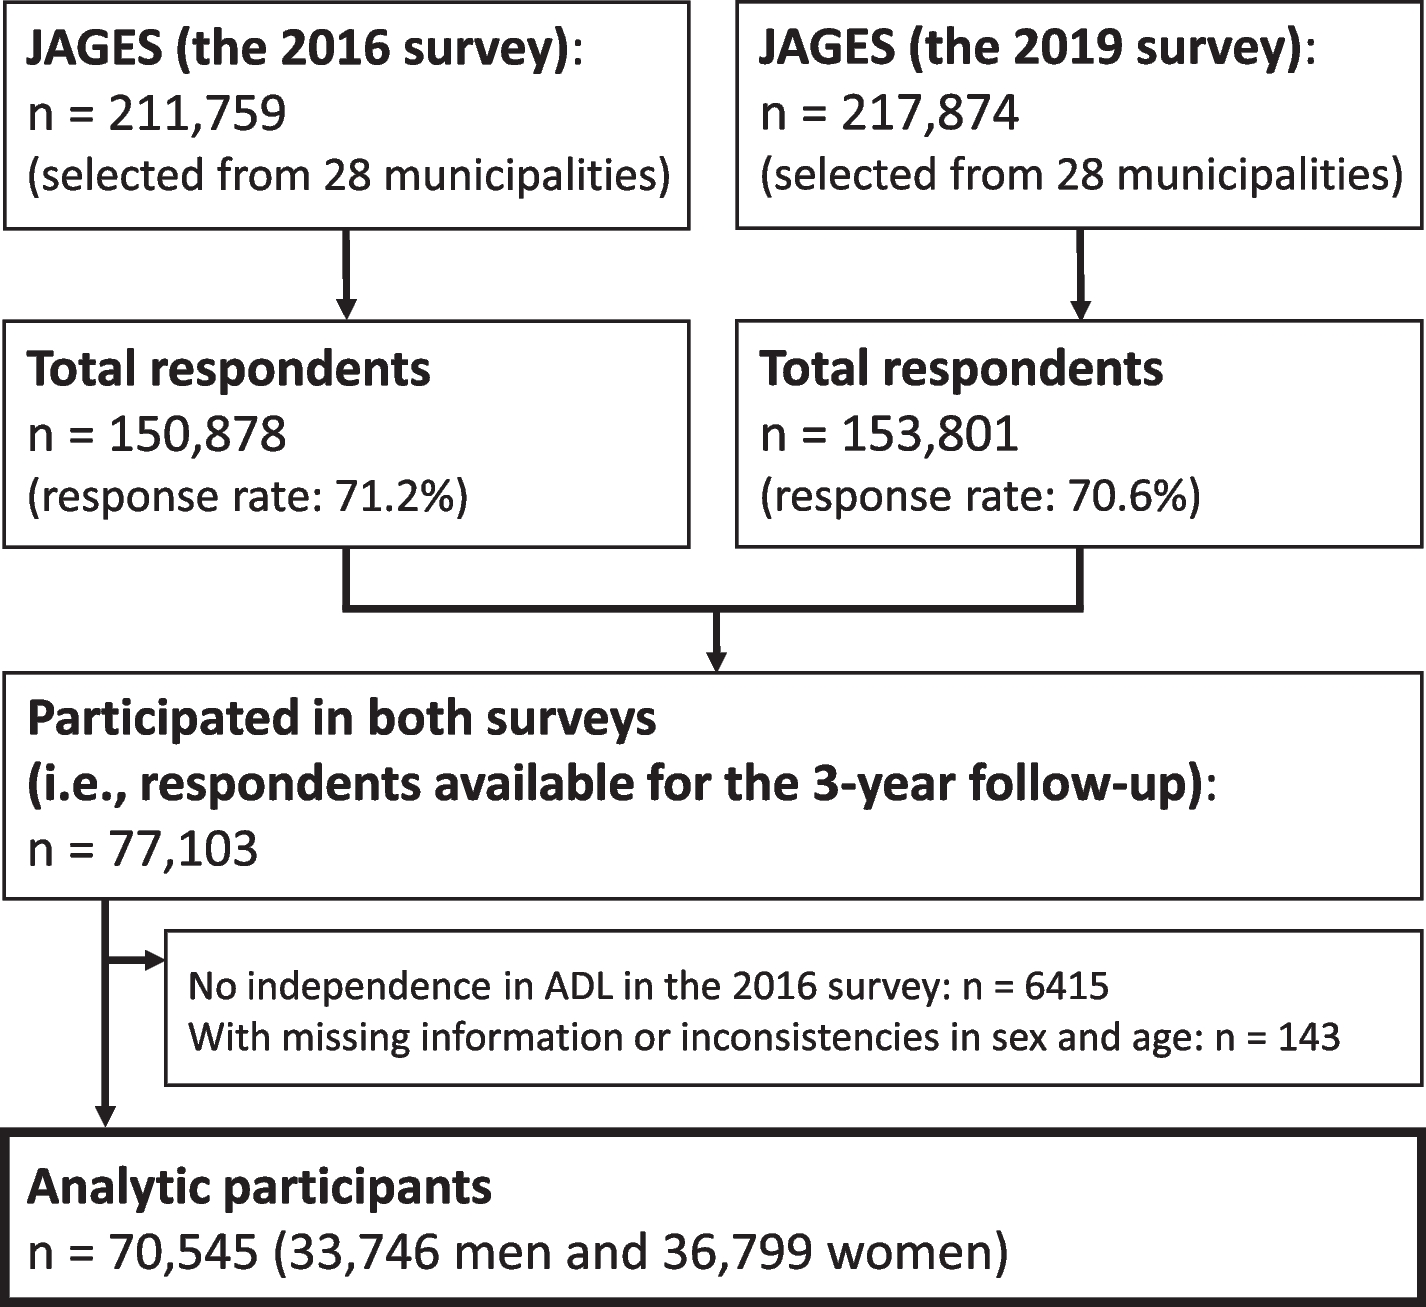
Population and sample
Data comes from the three waves of the World Health Organization (WHO) Study on global AGEing and adult health (SAGE) in Mexico. SAGE is a multi-country, longitudinal study, based on nationally representative samples of individuals aged ≥50y. It has been conducted in six countries -- China, Ghana, India, Mexico, Russia, and South Africa – which each bring different geographic distributions, population sizes, income levels (low and medium), and phases in the epidemiological transition. To date, SAGE has three longitudinal measurements in Mexico, details of the study design have been published elsewhere [13]. Briefly, Wave 1 (baseline) was collected between July and September 2009, with a total sample of 2404 respondents ≥50y. Wave 2 data was collected between July and October 2014, with a refreshed sample of 618 new interviews (also ≥50) additional to the remained sample of Wave 1; and Wave 3 from August to November 2017 with 2318 participants (including 610 new interviews). In total, 3277 individuals were interviewed in the three waves. Given that the aim of this study was to identify longitudinal trajectories of the PA and SB, we included participants with at least two measurements. The final analytical sample had 3209 subjects. The response rate (the proportion of those initially invited, i.e., those with baseline measurement) was 76% (Fig. S1 in the Additional file, Appendix 1). We identified baseline differences between the final sample and excluded participants in several analytical variables -- the latter were older and had a higher prevalence of frailty and multimorbidity (p < 0.05).
Sample for mortality data
For all-cause mortality data analysis, sample definition proceeded as follows. The individuals were included if they had two of three complete measurements (censored observations) or had measurements for waves 1 and 2, and their death occurred between waves 2 and 3. Additionally, and given that our cohort includes incorporating new individuals (with rolling admissions), older adults with measurements in waves 2 and 3 were considered with delayed entry. Table 1 shows the different settings and their sample size. Hence, this analysis included a total of 2564 older adults.
Table 1 Analytical sample for survival analysisDefinition of variablesOutcomes
Quality of life (QoL)
We assessed this variable using the WHOQOL (WHO Quality of Life) instrument. This eight-item questionnaire covers the following core domains (two items per domain): physical, psychological, social, and environmental. The eight items are summed for an overall score ranging from 0 to 100. The higher the score, the higher QoL [14].
Disability
We used the WHO Disability Assessment Schedule Version 2.0 (WHODAS 2.0), a cross-culturally validated, 12-item tool that measures limitations in activity and daily-life participation over the last month. WHODAS 2.0 covers six domains within the 12 items (two per domain): 1) cognition and communication, 2) self-care, 3) mobility, 4) interpersonal relations, 5) life activities, and 6) participation. The results of the 12 items are summed to obtain a global score expressed on a continuous scale from 0 (no disability) to 100 (complete disability) [15].
All-cause mortality
Data drawn from the interviews in Wave 3 (2017) included information about death (for any cause) that occurred during the follow-up using the WHO-Verbal autopsy instrument, which ascertains and attributes causes of death based on the self-report of the closest relative -or non-relative person- of the older adults [16]. We define the follow-up time as the interval between the interviews of the baseline measurement (whether were individuals whose risk began in 2009 or with delayed entry in 2014) and the 3rd Wave for censored data. We recorded the date of death for the deceased, which provided information on the survival time. We then calculated the follow-up time according to the number of days elapsed.
Main exposures
Physical activity
This was assessed using the Global Physical Activity Questionnaire (GPAQ). The GPAQ measures PA in terms of intensity, duration, and frequency, and assesses three domains in which PA is performed: activity at work, travel to and from places, and recreational activities [17]. The total amount of moderate-to-vigorous PA in a typical week was calculated and METs/hours per week were reported [18].
Sedentary behavior
The GPAQ was also used to assess SB. In this instrument, participants were asked for the minutes per day spent in sitting activities [19, 20]. Specifically, OA reported the total time they usually spent sitting or reclining at work, at home, getting to and from places, or with friends (i.e., sitting at a desk, sitting with friends, travelling in car, bus, train, reading, playing cards, or watching television), excluding time spent sleeping. SB was used in the analysis as a continuous measurement of daily hours spent sitting.
Measurements
Height and weight -- measured through stadiometers and calibrated electronic weighting scales -- were used to calculate body mass index (kg/m2). Grip strength was measured twice for both hands using the hand dynamometer (Baseline Electronic Smedley Hand Dynamometer, Fabrication Enterprises, White Plains, NY, USA). Four-meter walk time was used to measure gait speed. Participants were asked to walk at a normal pace.
Covariates
Covariates were categorized as follows: sex (1 = female), age, and number of years of formal education. Socioeconomic status (SES) of the household was derived using the WHO standard approach to estimate permanent income from household ownership of durable goods, dwelling characteristics (type of floors, walls, and cooking stove), and access to services such as water, sanitation, and electricity [21]. SES was included as a continuous variable, with higher values indicating better SES. Multimorbidity was included as a dichotomous variable (with/without multimorbidity) and was defined as the presence of two or more chronic non-communicable conditions from the list of nine chronic diseases included in the SAGE study. The operational definitions of these diseases have been published elsewhere [22]. Frailty status was determined using a modified frailty phenotype, based on the criteria proposed by Fried et al. [23], which includes five components: weight loss, exhaustion, low physical activity, slow walking speed and weakness. Details of the previous application of this frailty measurement in the SAGE sample has been published elsewhere [24]. We also used sarcopenia as an additional covariate. In accordance with previous publications, we defined the presence of sarcopenia as having low skeletal muscle mass (reflected by lower skeletal muscle mass index) and either a slow gait speed or weak handgrip strength. Details of the specific algorithms used to define sarcopenia status in the older adult population using the SAGE study sample are published elsewhere [25]. Finally, body mass index (BMI) was calculated using weight (kg) and height (cm) (BMI = Weight [kg] / Height [m2]) and was incorporated into the analysis as a continuous variable.
Statistical analysis
Baseline characteristics are presented in percentages and means (standard deviation) as appropriate. Health and sociodemographic characteristics related to longitudinal trajectories of PA were compared using Chi-square or ANOVA tests.
We used growth mixture modelling (GMM) to investigate the longitudinal trajectories of PA and SB [26]. GMM is useful since it provides information regarding the growth factors of each different trajectory. The intercept and slope (growth factors) are interpreted as usual in longitudinal modelling: the level of outcome variable when time is equal to zero and the rate of change in the outcome over time, respectively. According to current recommendations [27], we initially specified a single-class latent growth curve model to determine the pattern of change over time. Given the number of available measurements in the SAGE study (i.e., three waves) we examined a linear and a quadratic pattern of change. We specifically applied the GMM with class-specific random intercepts. We also applied an exploratory approach and fitted models with an increasing number of classes to identify the optimal latent class model.
We determined the best model (i.e., the one with the optimal number of classes) based on statistical criteria, parsimony, and interpretability [27]. We considered: (1) the lowest values of the goodness of fit measures - Bayes Information Criteria (BIC), Akaike Information Criteria (AIC) and the sample-size adjusted BIC (aBIC), (2) the following versions of the likelihood ratio tests (LRT): Vuong-Lo-Mendell-Rubin, Lo-Mendell-Rubin adjusted, and Bootstrapped, (3) the way to which the trajectory classes captured distinct and important patterns in the data, and (4) the quality of the model in terms of posterior probability diagnostics, namely the entropy and average posterior probability for each trajectory class.
We analyzed the association between the PA and SB trajectories and the distal outcomes (QoL, disability, and all-cause mortality) using linear mixed-effects regression and Cox proportional hazards models. Given that the Mexico-SAGE study included multiple members from within the same household and had repeated measurements of QoL and disability from the same individual, our data had a three-level hierarchical structure, with measurement occasions at level 1, individuals at level 2, and households at level 3. We then fitted a random intercept models including the subject and household IDs as random effects for QoL and disability outcomes.
For the Cox model, new admissions are left-truncated observations (also known as delayed entry), implying that not all individuals start to be at risk simultaneously, which in turn represents a potential bias [28,29,30]. Then, we considered the delayed entry feature in our statistical analysis following the proposal of Lamarca et al. [31] to analyze left-truncated data with the older adult population using age as the time scale. In our study, consider the survival time as the elapsed time from age 50 until the event of interest. Additionally, we used clustered standard errors to account for correlation between repeated measurements within individuals.
All models were adjusted using the covariates described above. Furthermore, the modeling of PA was adjusted by weekly hours of SB, and SB was adjusted by PA (METs/hours per week), and both (PA and SB) for the follow-up time. Regression coefficients, hazard ratios, and 95% confidence intervals were reported.
Models for GMM were estimated in Mplus v8.5 by full maximum likelihood (FML) and robust standard errors to non-normality [32]. To avoid local maxima for the expectation-maximization (EM) algorithm, we estimated the models with 200 random starting values and 100 iterations per set of starting values. According to the guidelines for reporting on latent trajectory studies [27], the code syntax is provided in the Additional file, Appendix 2. We used Stata 17.0 to model the association between PA and SB trajectories and distal outcomes.
This study was conducted following the STROBE guidelines for reporting cohort studies (STROBE checklist is reported in the Additional file, Appendix 3).

留言 (0)