
記住我
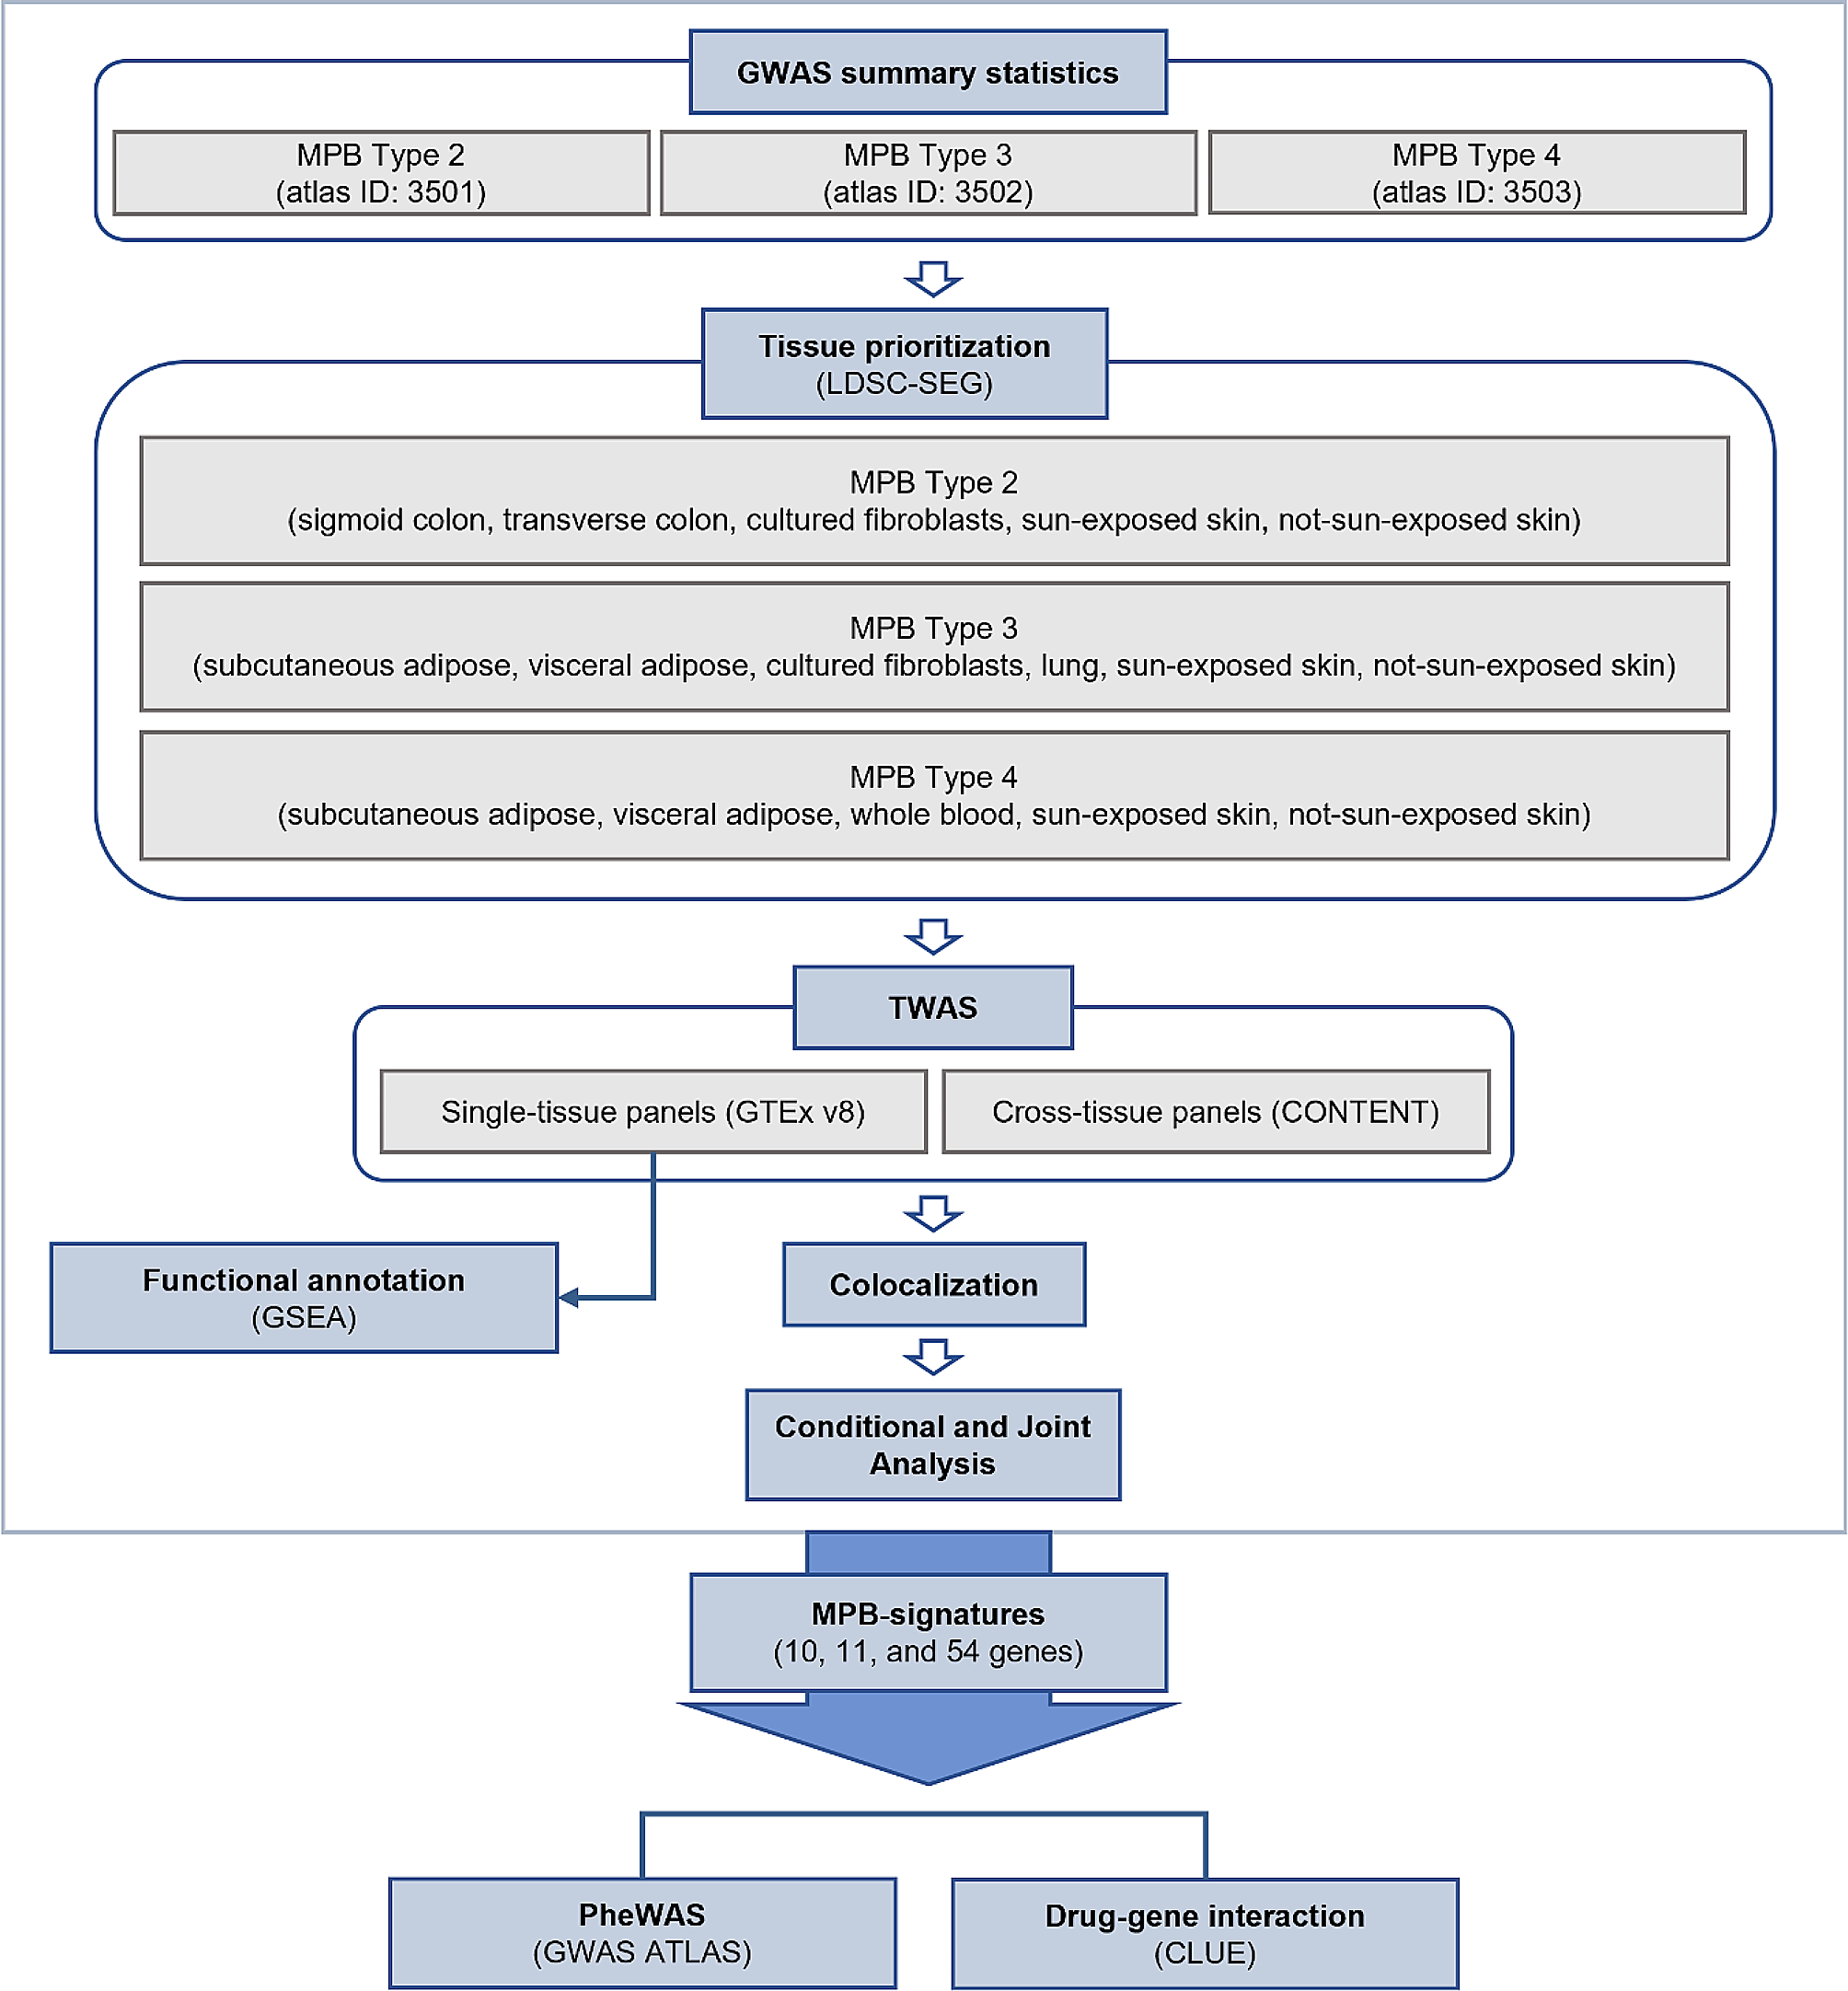
The workflow of this study was shown (Additional file 1: Fig. S1). The study included four types of RNA modifications writers (writers of m1A, m6A, APA and A-to-I editing) and analyzed a total of 26 genes of writers. In TCGA-STAD dataset, 353 samples were recruited to analyze gene mutations and mutation patterns of the 26 writers, and 118 of them were mutant (Fig. 1A). ZC2H13 was the most frequent mutated gene, showing a mutation frequency of 30%, and there were 10 genes that reached a mutation frequency up to 10% (Fig. 1A). The majority of mutations were missense mutation and frame-shift deletion. Interestingly, patients with mutations showed a longer OS than those without, suggesting a potential relationship between the writers and GC (p = 0.0245, Fig. 1B). GSEA was applied to enrich hallmark gene sets in the mutated samples. Here, we detected a series of tumor-related gene sets, such as E2F targets, Myc targets, G2/M checkpoint, pancreas beta cells and interferon-gamma response (Fig. 1C). In addition, by using PathScore tool, we observed that these significantly mutated genes were highly enriched in BARD1 pathway (56.5% patients, p < 1e−16) and interferon alpha–beta signaling pathway (33% patients, p = 0.048, Additional file 2: Fig. S2).
Fig. 1
Mutation patterns and expression level of 26 RNA modification writers. A The top 20 mutated genes in 118 of 353 samples in TCGA-STAD dataset. Eight types of mutations were presented, including missense, nonsense, splice site mutation, in-frame deletions, frame-shift deletions or insertions, and different combinations of multiple genetic mutations (multi-hit). B Kaplan–Meier survival curve of mutant group and wild-type (WT) group. Log-rank test was performed. C Enriched pathways of hallmark gene set in mutant group and WT group. The dot size represents the count numbers of genes. D CNV distribution of 26 RNA modification writers. Red, green and blue represent gain of copy number, loss of copy number and no CNV, respectively. E Comparison of the expression level of 26 writers between cancer samples and normal samples grouped by m6A, m1A, APA and A-I. Student’s t test was performed. F The expression level of 26 writers among gain of copy number (amplification), loss of copy number (deletion) and normal samples. Kruskal–Wallis test was performed. *p < 0.05, **p < 0.01, ***p < 0.001, ****p < 0.0001. ns no significance
In addition to small-scale mutations, copy number variation (CNV) is a major factor contributing to aberrant gene expression. Our result showed that ADAR, CPSF1 and CPSF4 had high frequency of increased copy numbers, while RBM15 and RBM15B showed a high proportion of decreased copy numbers; interestingly, no CNV was detected in KIAA1429 (Fig. 1D). Compared with normal samples, GC cancer samples exhibited obviously higher expression of m6A, m1A and APA writers (Fig. 1E), but ADAR only showed significantly higher expression in 3 A-to-I writers (Fig. 1E). Notably, RBM15B with loss of copy numbers still expressed higher in cancer samples. To further understand the relation of CNV and gene expression, the samples were classified into CNV amplification and CNV deletion groups. In both amplification and deletion groups, we observed a higher expression level in most writer genes in GC samples than in normal samples (Fig. 1F). The above results indicated that the expression of writers was involved in a complicated regulation network and may be affected by small- or large-scale mutations. Additionally, these data also suggested that abnormal expression was a potential factor for GC tumorgenesis and development.
Expression patterns of RNA modification writers were associated with GC prognosis and tumor immune cell infiltrationTo investigate the relation between each writer and GC prognosis, univariate Cox regression analysis was performed on 300 samples of GSE62254 dataset. Twelve out of 26 writers including ADARB1, PABPN1, PCF11 and METTL3 were positively related to hazard ratio (HR) and significantly related to the cancer prognosis, and NUDT21, CLP1, RBM15B, CSTF2, WTAP, CPSF3, CPSF2 and RBM15 were negatively related to HR (Fig. 2A). To validate their prognostic performance, we implemented immunohistochemistry (IHC) of two writers (ADARB1 and RBM15B) on GC tissues. Consistent with the above analysis, ADARB1 was higher expressed and RBM15B was lower expressed in advanced gastric cancer tissue (Additional file 3: Fig. S3), but both the two showed opposite expressions in early GC tissue, demonstrating the reliability of these writers of serving as prognostic indicators. Spearman rank analysis on the correlations among writers revealed interactions among different writers (Fig. 2B).
Fig. 2
Different expression patterns of RNA modification writers. A Univariate Cox regression of 26 writers and 12 writers had a close relation with GC prognosis. B Spearman rank correlation analysis of 26 writers. Red means positive correlation and blue means negative correlation. C Unsupervised consensus clustering of 300 samples in GSE62254 dataset. Red and violet represent high and low expression, respectively. D Kaplan–Meier survival curve of cluster 1 (165 samples) and cluster 2 (135 samples). Log-rank test was performed. E Enriched KEGG pathways of two clusters analyzed by GSVA. Red and blue represent high and low GSVA enrichment score, respectively. F Enrichment and distribution of 22 immune cells in two clusters. Student t test was performed. *p < 0.05, **p < 0.01, ***p < 0.001, ****p < 0.0001. ns no significance, CI confidence interval, HR hazard ratio
As the specific roles of writers are different in the development of GC prognosis and interactions among writers, we speculated whether different expression patterns of all writers would lead to different prognostic results. Thus, unsupervised consensus clustering was performed to classify 300 samples into two groups based on different expression patterns of 26 writers (Fig. 2C). Survival analysis showed a significant difference between the two groups, and cluster 1 group tended to develop a more favorable OS than cluster 2 (p = 0.002, Fig. 2D). Then, we used GSEA to analyze the correlation between the two clusters and functional pathways. Cluster 1 group was enriched to pathways related to DNA repair and cell cycle, such as base excision repair pathway, homologous recombination pathway, mismatch repair pathway, DNA replication pathway and cell cycle pathway (Fig. 2E). Cluster 2 group presented a lower GSVA score in the above pathways, but many metabolism pathways, for example, arachidonic acid metabolism pathway, and metabolism of xenobiotics were enriched by cytochrome P450 pathway and drug metabolism cytochrome pathway (Fig. 2E). On biological process (BP) and molecular function (MF) terms, the two clusters also exhibited apparently distinct enrichment (Additional file 4: Fig. S4). A total of 1046 (21.0%) and 1770 (35.5%) BP terms were significantly annotated in clusters 1 and 2, respectively (FDR < 0.05). Metabolism and RNA modification-related BP terms were highly enriched in Cluster 1, while Cluster 2 had a high correlation with cell proliferation, migration and autophagy (Additional file 4: Fig. S4A). Moreover, 328 and 251 MF terms were significantly enriched in clusters 1 and 2, respectively (FDR < 0.05); specifically, cluster 1 was more correlated with RNA synthesis, and cluster 2 was more associated with protein binding and extracellular matrix (Additional file 4: Fig. S4B). The results further supported the conclusion that Cluster 2 had worse prognosis, which may be resulted from its high activity of tumor cell proliferation and migration.
Previous studies showed that RNA modifications are correlated with tumor immune infiltration; therefore, we performed CIBERSORT to calculate the enrichment score of immune-related cells and analyzed its correlation with writers. Of the four types of writers, the expression of m6A and APA writers, especially gamma delta T cells, activated memory CD4 T cells, M0 macrophages, activated dendritic cells, resting and activated mast cells, were found to be closely associated with immune infiltration (Additional file 5: Fig. S5). Activated mast cells and M1 macrophages were greatly enriched in cluster 1, and gamma delta T cells, M2 macrophages and resting memory CD4 T cells were noticeably enriched in cluster 2 (Fig. 2F). Through using Timer method, we also observed similar results that cluster 2 had higher immune infiltration than cluster 1 (Additional file 6: Fig. S6).
Construction of a prognostic signature based on genes related to RNA modification writersVariations in expression patterns of RNA modification writers normally result in different influence on GC prognosis; we therefore developed a signature for predicting the prognosis based on the genes related to RNA modification writers. A total of 194 differentially expressed genes related to RNA modification were identified through univariate Cox regression analysis. Gene ontology (GO) analysis revealed that these 194 genes were involved in multiple biological functions (Additional file 7: Fig. S7A–C). Next, according to unsupervised clustering analysis, 300 samples of GSE62254 dataset were stratified into two groups (cluster A and cluster B) (Additional file 9: Table S1). Survival analysis exhibited significantly differential OS of the two groups, with higher OS in cluster B (p = 0.0032, Additional file 7: Fig. S7D). Two types of systems for classifying GC patients were constructed based on 26 writers and 194 genes related to RNA modification writers. The performance of the two systems in clustering 300 samples were similar (Fig. 3A), indicating the reliability of developing a prognostic signature using RNA modification writers.
Fig. 3
Construction of a signature of RNA modification writers. A Unsupervised consensus clustering of 194 RNA modification genes in GSE62254 dataset, and the comparison of two kinds of clustering. B, C WM score of different RNA modification patterns, cluster 1 and cluster 2 (B), cluster A and cluster B (C). Wilcoxon test was performed. D Kaplan–Meier survival curve of high-WM score and low-WM score groups in GSE62254 dataset. Log-rank test was performed. E ROC analysis of 1 year, 3 years and 5 years for WM score effectiveness in GSE62254 dataset. F Kaplan–Meier survival curve of high-WM score and low-WM score groups in TCGA-STAD dataset. Log-rank test was performed. G ROC analysis of 1 year, 3 years and 5 years for WM score effectiveness in TCGA-STAD dataset. (H-I) Multivariate Cox regression analysis of WM score, T stage, N stage, M stage, stage, age and gender in GSE62254 (H) and TCGA-STAD (I) dataset. Log-rank test was performed. *p < 0.05, **p < 0.01, ***p < 0.001, ****p < 0.0001
Based on 194 genes, we established a WM (Writers of RNA Modification) scoring system, which was shown as WM score = Σ(coefficient i) * (expression i) [27]. The scoring system showed robust performance in different groups, in which cluster 2 had higher WM score than cluster 1 (p = 3.40e−29, Fig. 3B). Consistently, cluster B also had higher WM score than cluster A (p = 9.70e−49, Fig. 3C). Samples in GSE62254 dataset were classified into high-risk and low-risk groups with distinct OS using the WM score (p = 0.0015, Fig. 3D). According to receiver operator curve (ROC), WM score showed an area under ROC curve (AUC) of 0.64, 0.71 and 0.71, respectively, in predicting 1-year, 3-year and 5-year OS (Fig. 3E). Similarly, 353 samples in TCGA-STAD dataset were divided into high-risk and low-risk groups with differential prognosis (p = 0.045, Fig. 3F), and ROC analysis also demonstrated a robust performance of the WM score (Fig. 3G). Furthermore, multivariate Cox regression analysis in both datasets verified that WM score could serve as an effective indicator for GC prognosis prediction, with a hazard ratio of 1.5 (95% CI = 1.3–1.7, p < 0.0001) in TCGA-STAD dataset and 1.2 (95% CI = 1.0–1.4, p = 0.0098) in GSE62254 dataset (Fig. 3H, I).
WM score was correlated with tumor microenvironmentTo examine whether WM score was related to tumor microenvironment (TME), CIBERSORT was applied to calculate the proportion and enrichment score of 22 immune cells. In GSE62254 dataset, the proportion of 22 immune cells in high-risk and low-risk groups was shown in the heatmap and histogram (Fig. 4A–C). Among the 22 immune cells, gamma delta T cells, M1 macrophages and activated mast cells consisted of a large proportion (Fig. 4B), and 11 immune cells were differentially enriched in the two groups (Fig. 4C). Particularly, activated memory T cells, M0 macrophages, activated dendritic cells and activated mast cells were more enriched in the low-risk group, while gamma delta T cells, M2 macrophages, resting dendritic cells and eosinophils were more enriched in the high-risk group (p < 0.05, Fig. 4C). After excluding seven immune cells without expression from more than half of the samples, 15 immune cells remained and their distributions in the two groups are shown in Fig. 4D. Immune infiltration analysis using CIBERSORT showed a higher enrichment score of stromal score, immune score and ESTIMATE score in high-risk group than low-risk group, indicating that WM score was positively related to immune infiltration (Fig. 4E, F).
Fig. 4
The relation between WM score and immune infiltration. Heatmap (A) and box plot (B) for describing the distribution and proportion of 22 immune cells. C Enrichment of 22 immune cells in high- and low-WM score groups. Student’s t test was performed. D Proportion of 15 immune cells whose immune score was nonzero in over half samples. E–G Stromal score, immune score and ESTIMATE score calculated by CIBERSORT in high- and low-WM score groups. Wilcoxon test was performed. *p < 0.05, **p < 0.01, ****p < 0.0001. ns no significance
The relation between WM score and clinical features, epithelial–mesenchymal transitionNext, we identified the relation between WM score and clinical features including T stage, N stage, M stage, stage I to IV, gender and age. In T stage, T3 had the highest WM score, and the score of T2 was significantly different from that of T3 and T4 (Fig. 5A). Though the difference of WM score was not obviously different in T stage or M stage, there was still a tendency of the higher WM score correlating with the progression of stage (Fig. 5B, C). Moreover, such a tendency was also observed in stage I to IV, which manifested significant differences between stage I and III, stage II and III, stage II and IV (Fig. 5D). Notably, the WM score of female group was higher than male group, and age was another important factor leading to differential WM score (Fig. 5E, F).
Fig. 5
The relation between WM score and clinical features, EMT-related pathways. A–F The relation between WM score and clinical features including T stage (A), N stage (B), M stage (C), stage I to IV (D), gender (E) and age (F) in GSE62254 dataset. Heatmap (G) and box plot (H) for describing the relation between WM score and EMT-related pathways in GSE62254 dataset. Heatmap (I) and box plot (J) for describing the relation between WM score and EMT-related pathways in TCGA-STAD dataset. Wilcoxon test was performed. *p < 0.05, **p < 0.01, ***p < 0.001, ****p < 0.0001. ns no significance
As epithelial–mesenchymal transition plays a crucial role in tumor progression, we also assessed the enrichment of EMT-related pathways in high-risk and low-risk groups using GSVA. In GSE62254 dataset, EMT1, EMT2, Pan-F-TBRS, EMT3 and angiogenesis pathways were highly enriched to high-risk group, while DNA replication, DNA repair and cell cycle pathways were more enriched to low-risk group (Fig. 5G, H). The majority of pathways showed significant differences between the two groups. In addition, similar result was also observed in TCGA-STAD dataset (Fig, 5I, J), indicating that the WM score was strongly associated with EMT. Due to the important role of EMT in cancer development, a number of studies have explored a series of EMT-related signatures [28,29,30]; for instance, Wang et al. built an EMT-CYT Index (ECI) model as an indicator for pan-cancer prognosis [30]. We also compared our WM score with EMT score developed by Wang et al. according to hazard ratio, C-index and AUC. The EMT score was calculated for each sample in TCGA-STAD dataset. Although the EMT signature showed a more favorable result in hazard ratio, our WM score had higher C-index and AUC, which supported its robustness (Additional file 8: Fig. S8).
WM score was related to tumor mutation burdenTumor mutation burden (TMB) has been considered to be correlated with tumor immune infiltration, and this can provide a guidance to immunotherapy to some extent. The group with low WM score had higher TMB than that with high WM score in TCGA-STAD dataset (Fig. 6A), and a negative correlation of R = − 0.424 (p = 9.33e−17, Fig. 6B) between WM score and TMB was observed. The top 20 significantly mutated genes were listed with their p value and proportion (Fig. 6C). Missense mutations accounted for the greatest proportion among these mutation types. Frame-shift deletions frequently occurred in TTN, TP53 and KMT2D, and nonsense mutations were found the most in TTN and TP53. Tumor-related genes, such as TP53, LRP1B and MUC16, showed great mutations in both groups but apparently more in low-risk group.
Fig. 6
Mutation patterns between high-WM and low-WM score groups. A The difference of TMB between high- and low-WM score groups. Wilcoxon test was conducted. B Spearman rank correlation of WM score and TMB. R indicates coefficient. C The proportion of seven types of mutations (missense, nonsense, in-frame deletions and insertions, frame-shift deletions and insertions, splice site mutation) in high- and low-WM score groups. Fisher’s exact test was conducted. The left column listed the top 20 mutated genes with p value in the brackets. The proportion of mutated frequency was presented in the right column. TMB tumor mutation burden
The relation between WM score and micro-RNA regulationPrevious studies demonstrated that 3′-UTR alterations caused by APA will affect posttranscriptional regulation and translation, which could result in loss of miRNA binding sites [31, 32]. The WM score system was developed based on 26 types of RNA modification writers, and we speculated that there was a correlation between WM score and miRNA regulation. Firstly, 46 differentially expressed miRNAs were screened between high-WM score and low-WM score groups. Then, miRNA-targeted genes of these miRNAs were enriched in KEGG pathways using GSVA. In the top 10 enriched pathways, the target genes of miRNAs were highly enriched in PI3K-Akt signaling pathway, focal adhesion and MAPK signaling pathway (Fig. 7A). Moreover, miRNA-targeted genes were differentially expressed between the two groups in these signaling pathways (Fig. 7B), suggesting that WM score was related to the regulation of miRNA-related signaling pathways.
Fig. 7
Differential miRNA expression in different RNA modification patterns. A The top 10 KEGG pathways enriched from miRNA-targeted genes. The dot size represents the count numbers of genes. B Differential expression of miRNA-targeted genes between high- and low-WM score groups. Red and green lines represent low miRNA expression in high-WM score group and high-miRNA expression in low-WM score group. Red and green dots represent highly expressed miRNA-targeted genes in high- and low-WM score groups. The dots within circles mean the miRNA-targeted genes in a pathway
The sensitivity of chemotherapeutic drugs was related to WM scoreTo examine whether WM score and patients’ sensitivity of chemotherapeutic drugs was correlated, we exported a series of drugs for treating GC from GDSC database. Spearman rank correlation analysis identified 12 chemotherapeutic drugs significantly correlated with WM score. Among these drugs, WM score showed close relations to the sensitivity of two drugs (p38 MAPK inhibitor doramapimod and IGF-1R inhibitor BMS-754807) and to the resistance of 10 drugs (Fig. 8A). Furthermore, pRRophetic R package was used to evaluate the drug response of TCGA-STAD samples to cisplatin, paclitaxel, docetaxel and 5-fluorouracil. Low score of estimated IC50 represented a high sensitivity to drugs. Low-WM score group showed high sensitivity to cisplatin and docetaxel, and patients with a high-WM score were more sensitive to paclitaxel and 5-fluorouracil (Fig. 8B–E). The targeted pathways of chemotherapeutic drugs were also investigated. Here, each drug targeted different pathways, such as IGF-1R inhibitor, and BMS-754807 and oxaliplatin were related to IR signaling pathway and DNA replication pathway, respectively (Fig. 8F).
Fig. 8
The applicative value of WM score in chemotherapy. A Screening of chemotherapeutic drugs showing a correlation with WM score. |rs| > 0.2 was considered to have a correlation, where rs represents Spearman rank correlation coefficient. B–E The difference of drug sensitivity of cisplatin (B), paclitaxel (C), docetaxel (D) and 5-flurouracil between high-WM score and low-WM score groups. F The targeted pathways of chemotherapeutic drugs showing a correlation with WM score. Student’s t test was performed. **p < 0.01, ****p < 0.0001
The efficacy of anti-PD-1 therapy is associated with WM scoreFor metastatic cancer, immunotherapy, especially anti-PD-1/PD-L1 therapy, is a promising strategy in treating many cancer types. We therefore examined the WM score in predicting the efficacy of immunotherapy. In GSE78220 dataset, 27 patients with four outcome information of complete response (CR), partial response (PR), stable disease (SD) and progressive disease (PD) treated by anti-PD-1 therapy were included. The result presented that CR and PR patients had a lower WM score than SD and PD patients (p < 0.01, Fig. 9A), and a higher proportion of CR and PR patients was in low-WM score group (Fig. 9B). Kaplan–Meier survival plot also displayed a favorable OS in low-WM score group (p = 0.021, Fig. 9C), suggesting that WM score was closely associated with the outcomes of immunotherapy.
Fig. 9
The prognostic value of WM score for immunotherapy. A The difference of WM score between CR/PR samples and SD/PD samples in GSE78220 dataset. Student’s t test was performed. B The proportion of CR/PR samples and SD/PD samples in high- and low-WM score groups in GSE78220 dataset. C Survival analysis of high- and low-WM score groups in GSE78220 dataset. Log-rank test was performed in survival analysis. **p < 0.01
留言 (0)