Study design and population
The Hispanic Community Health Study/Study of Latinos (HCHS/SOL) is a multicenter, population-based cohort study of 16 415 men and women who self-identified as Hispanic or Latino (Mexican, Cuban, Puerto Rican, Dominican, Central, and South American), were age 18–74 years at recruitment, and lived in households selected at random in four U.S. field centers (San Diego, CA; Chicago, IL; Miami, FL; and Bronx, NY). Recruitment involved a stratified 2-stage area probability sample of addresses in each field center from 2008–2011 [23]. The sample design and cohort selection have been previously described [24]. Briefly, a stratified two-stage area probability sample of household addresses was selected in each of the four field centers. The first sampling stage randomly selected census block groups with stratification based on Hispanic/Latino concentration and proportion of high/low socio-economic status. The second sampling stage randomly selected households, with stratification, from US Postal Service registries that covered the randomly selected census block groups. Both stages oversampled certain strata to increase the likelihood that a selected address yielded a Hispanic/Latino household.
After households were sampled, in-person or telephone contacts were made to screen eligible households and to roster their members. Lastly, the study oversampled the 45–74 age group (n = 9714, 59.2%) to facilitate the examination of target outcomes. As a result, participants included in HCHS/SOL were selected with unequal probabilities of selection, and these probabilities need to be taken into account during data analysis to appropriately represent the target population. HCHS/SOL sampling weights are the product of a “base weight” (reciprocal of the probability of selection) and three adjustments: (1) non-response adjustments made relative to the sampling frame, (2) trimming to handle extreme values (to avoid a few weights with extreme values being overly influential in the analyses), and (3) calibration of weights to the 2010 U.S. Census according to age, sex, and Hispanic background.
All participants provided written informed consent. There were 11,623 participants who completed the follow-up visit from 2014–2017.
The institutional review boards of each field center, coordinating center, central lab, reading centers, and the National Heart, Lung, and Blood Institute approved this study. The study was registered at clinicaltrials.gov as NCT02060344. This analysis was reviewed and approved by the University of North Florida Institutional Review Board (IRB).
Data collection
Both baseline (2008–2011) and follow-up (2014–2017) in-person examinations included anthropometric measurements, urine and fasting blood sample collection, and interviewer-administered questionnaires on the participants’ language preferences. The questionnaire collected demographic and socio-economic information, health and medical history, access and use of health care, smoking status history, physical activity, and medications/supplement use. Details of study design and study procedures can be found elsewhere [23, 24].
Dietary assessment
Dietary assessment was completed at baseline (2008–2011). Detailed methods for dietary data collection have been previously published [25]. Briefly, dietary intake was assessed using data from two interviewer-administered 24 h dietary recalls. The first 24 h recall was administered in-person at the baseline examination, and the second recall via telephone ~30 days after baseline. Data were collected using the multiple-pass method of the Nutrition Data System for Research software, which contains over 18,000 foods, 8000 brand-name products, and many Hispanic and Latino foods. The software provides values for 139 nutrients, nutrient ratios, food-group serving counts, and other food components.
In the 24 h recall data, FV intakes were recorded for each participant by day. Using the U.S. Department of Agriculture’s Food Patterns Equivalents Database: 2009–2010: Methodology and User Guide (FPED), the FV weights were converted to cups by one-cup serving equivalents in grams. For food items lacking an FPED serving size, the U.S. Food and Drug Administration (FDA) serving size was used to count as one serving (e.g., French fries). Each one-cup equivalent was converted to standard serving size. With two exceptions (raw, green leafy vegetables, and dried fruit) a standard serving of a fruit or vegetable was defined as being a ½ cup. One cup was considered a serving for raw, leafy green vegetables, and a ¼ cup was considered a serving for dried fruits. Criteria for excluded FV were as follows: serving size information from FPED or FDA data was not available, mixed dishes (e.g., chicken and vegetable soup), beans, sauces, condiments, seasonings, jelly/jam, chips, and no weighed amount for food item provided by the participant. Mixed fruits or vegetables, and derivatives of certain foods (e.g., French fries) were included in the uncategorized category. We categorized all FVs into one of five color groups and used the modified color classification system by Mirmiran et al. [26].
Table S1 shows the color grouping and FV included for each color group (e.g., green, yellow/orange, red/purple, white, and uncategorized). Fruits and vegetables were combined due to the similar nutrient profile and phytochemicals in the same color group of fruit and vegetables. There are some exceptions, e.g., potato and corn have more starch content, and avocado has more monounsaturated fatty acids (MUFA) than other food items. Thus, in sensitivity analysis, we excluded them from their respective FV color group. The daily average one-cup equivalent and daily average serving were calculated for each participant and categorized by color and total. In this analysis, we used the average of the two 24 h dietary recalls.
Cardiometabolic risk biomarkers and type 2 diabetes definition
Previous studies have suggested a large variety of metabolic factors that are potentially involved in the pathophysiology of diabetes (e.g., body mass index (BMI), glycosylated hemoglobin (HbA1c), fasting glucose, 2 h oral glucose tolerance test (OGTT), insulin, high-density cholesterol (HDL-C), low-density cholesterol (LDL-C), total cholesterol, triglycerides (TG), systolic blood pressure (SBP), and diastolic blood pressure (DBP)) and, thus, were used for this analysis [27,28,29].
Participants were required to fast for at least 8 h before the visit. A Roche Modular P Chemistry Analyzer was used to analyze serum triglycerides, serum HDL-C, serum LDL-C, total cholesterol, and fasting plasma glucose using a hexokinase enzymatic method (Roche Diagnostics Corporation, Indianapolis, IN). A 2 h OGTT was performed during the in-person visit. HbA1c was measured in EDTA whole blood using a Tosoh G7 Automated HPLC Analyzer (Tosoh Bioscience Inc., San Francisco, CA). Blood pressure was measured in triplicate with an automatic sphygmomanometer after a quiet rest and was averaged. Height was measured to the nearest 1.0 cm and weight to the nearest 0.1 kg; BMI was calculated as weight in kilograms divided by height in meters squared. The following BMI categories were used based on the CDC cutoffs [30]: underweight <18.5 kg/m2, healthy weight 18.5–<25 kg/m2, overweight 25–<30 kg/m2, and obesity ≥30 kg/m2.
The American Diabetes Association criteria were used to define diabetes based on fasting plasma glucose (≥126 mg/dL), 2 h OGTT (≥200 mg/dL), HbA1c level (≥6.5%), or self-reported use of medications for diabetes in the last 4 weeks [31]. Incident diabetes was a new case identified at follow-up visit from participants who were free of diabetes at baseline.
Covariates
All covariates were from baseline data and include participants’ self-reported information on age, sex, field center, Hispanic/Latino heritage, household income, education level, whether U.S. born, and years living in the U.S. The following baseline covariates were included in the models. Self-reported hours of physical activity using the Global Physical Activity Questionnaire [32] were converted into metabolic equivalents and categorized as low, moderate, or high levels as described previously [33]. Sedentary behavior was self-reported by sitting and reclining time on Global Physical Activity Questionnaire [32]. A comprehensive questionnaire gauged cigarette use history, smoking status categories include non-smokers (smoked < 100 cigarettes and no present use), former smokers (smoked > 100 cigarettes but no present use), and current smokers (smoked daily or on some days). Alcohol use level was classified as no current use, low-level use (<7 drinks /week for females; <14 drinks/week for males), and high-level use (7+ drinks/week for females; 14+ drinks/week for males).
Statistical analysis
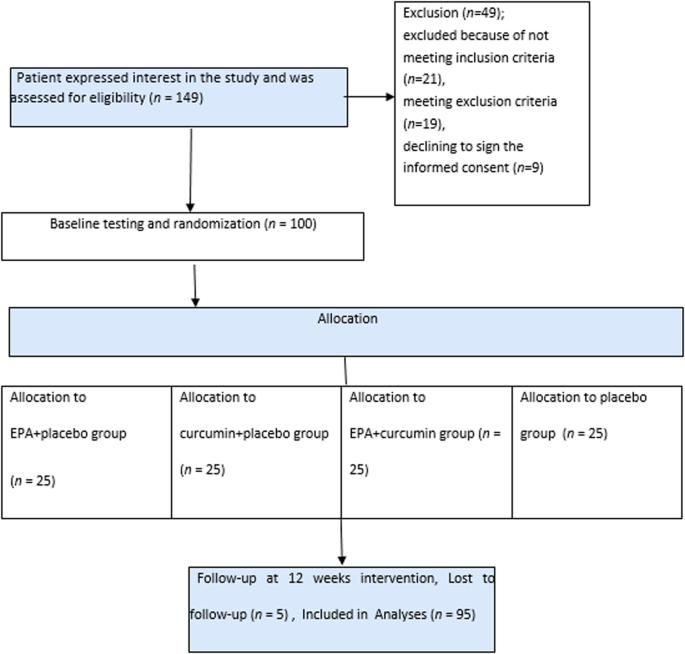
Among 11,623 participants who had follow-up data, we excluded those with a diagnosis of diabetes at baseline (n = 2 401) due to the possibility of FV intake being influenced by any medical intervention a patient may receive from their health care team [34,35,36,37]. We also excluded individuals without 24 h dietary recalls (n = 16) for this analysis. These exclusions resulted in a final analytical sample size of 9206 adults. Individuals missing ethnic backgrounds were combined with the “others/mixed” category.
Individuals were categorized into two levels according to the median intake for overall FV and for each FV color group. Differences in baseline sociodemographic characteristics, lifestyle, and dietary intake by the median of FV color groups were tested using linear survey regression. The intake of the different FV color groups by ethnic background was examined by one-way analysis of variance (ANOVA) followed by Tukey post-hoc test. Differences in energy and nutrient intake from different FV color groups were also tested using ANOVA with p-value adjusted by Bonferroni correction for multiple comparisons. We used linear survey regressions to evaluate the association of intake of FV color groups with nutrient intake from all foods and with cardiometabolic biomarkers at follow-up (BMI, HbA1c, fasting glucose, post-OGTT, insulin, HDL-C, LDL-C, total cholesterol, TG, DBP, and SBP). Cardiometabolic risk biomarkers were log-transformed due to skewed distributions. We also evaluated the association between intakes of FV color groups and incident diabetes at follow-up using logistic survey regression models. Sex-stratified analyses were performed in linear survey regression models and logistic survey regression models to test differences by sex.
Linear and logistic regression models were adjusted for total energy intake only (model 1) and adjusted for baseline age, sex, income, education level, whether U.S. born, years living in the US, medication use for hypertension and blood lipids, BMI (except when BMI was the outcome), field center, Hispanic/Latino heritage, smoking status, alcohol use level, physical activity level, sedentary behavior, the time between baseline and follow-up visit, total energy intake, polyunsaturated fatty acids (PUFA), trans fatty acids, whole grains, red and processed meats, and sugar-sweetened beverages (model 2). Furthermore, the final models were mutually adjusted for the other color groups for an individual color group.
In sensitivity analysis using model 2, we repeated the analysis for white, yellow/orange, and uncategorized FV, excluding potato from the white group, corn from the yellow/orange group, and potato salad from the uncategorized group, since they are rich in starch and have a high glycemic index. We also removed avocado from the yellow/orange group due to its higher MUFA content. Sensitivity analyses were also conducted to additionally adjust models for nutrient intake (e.g., fiber, vitamin C) to test their impacts on the reported association.
We used survey-specific procedures for all analyses to account for HCHS/SOL complex sampling design. SAS 9.4 (SAS Institute, Cary, NC) was used for all analyses, and a p-value of <0.05 was considered statistically significant.


留言 (0)