
記住我
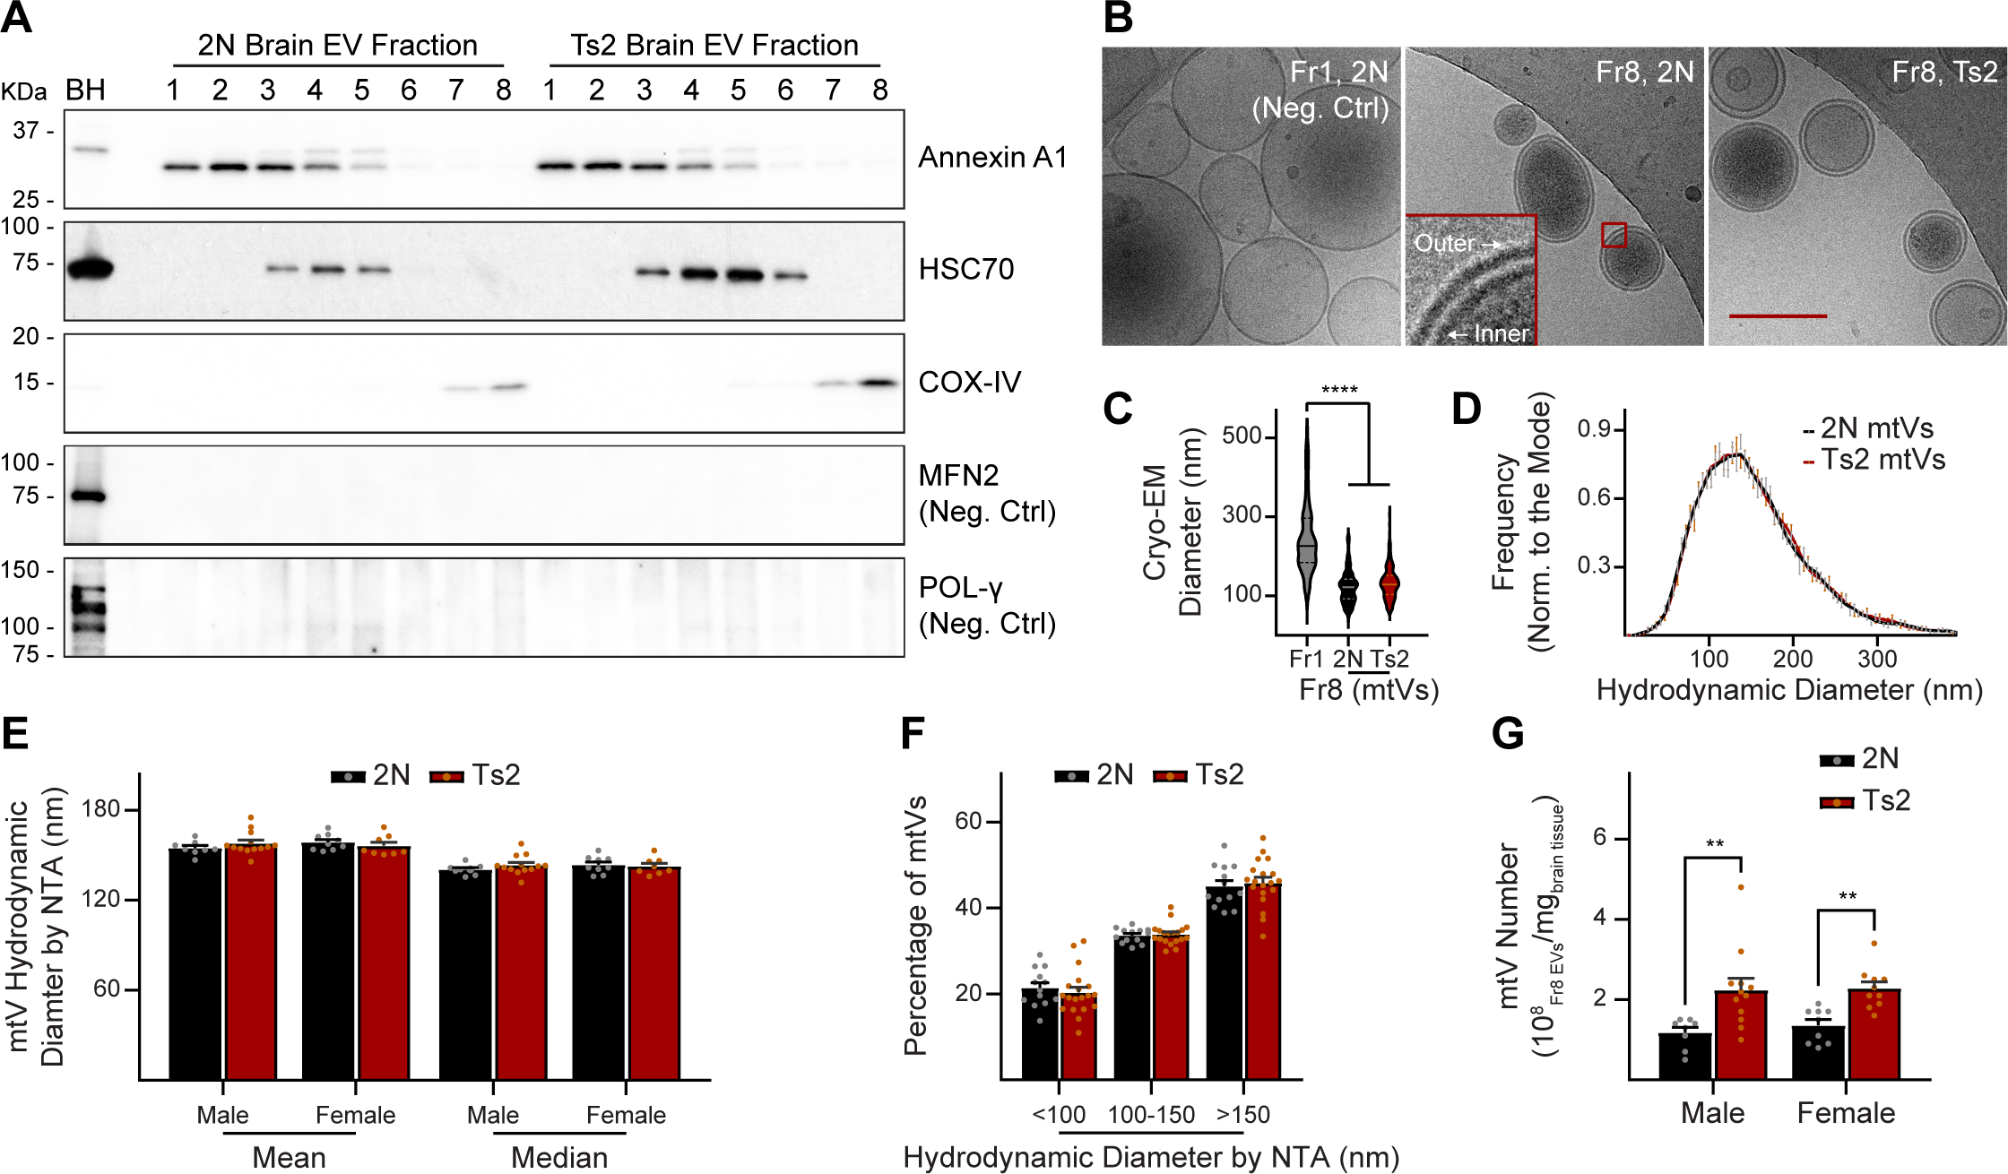

Table 1 shows the demographic, clinical and neuropathological data for the samples included in the study grouped according to their final neuropathological diagnosis. Forty-five percent of the study participants were female. The FTLD-Tau group had a lower proportion of females (25%) compared to controls (57%, p = 0.03), whereas the proportion was comparable across all other groups (p > 0.05). There was no difference in years of education across groups (p = 0.40). The mean age-at-disease onset (6 year difference, post-hoc p = 0.02) and mean age-at-CSF analysis (7 year difference, post-hoc p = 0.04) were higher in the AD group compared to FTLD-TDP. The mean age-at-death was higher in AD compared to FTLD-Tau (8 year difference, post-hoc p = 0.03) and FTLD-TDP (9 year difference, post-hoc p = 0.006). There was no difference in mean disease duration (p = 0.07) or time interval between disease-onset and CSF analysis (p = 0.79), whereas the mean time interval between CSF analysis and death was longer in the AD group compared to FTLD-Tau (1.4 year difference, post-hoc p = 0.04) and FTLD-TDP (2.4 year difference, post-hoc p = 0.01). Based on these differences, we included sex and age-at-CSF collection as a covariate in statistical analysis for group comparisons. Eighty-three percent of the FTLD-Tau and 76% of FTLD-TDP showed little to no AD pathology and 72% of the AD patients showed no TDP-43 pathology beyond the amygdala, a proportion that was comparable across groups (p = 0.63). The global pathological burden of tau (p = 0.66) and TDP-43 (p = 0.31) pathology was comparable between male and female participants. Global pathological burden was not associated with the time interval from CSF collection to death (tau; p = 0.12, TDP-43; p = 0.21) or disease duration (tau; p = 0.08, TDP-43; p = 0.19) but was inversely related to age-at-death (tau; p = 0.04, TDP-43; p = 0.02). The mean MMSE score and time interval between MMSE and CSF collection were comparable between FTLD-Tau and FTLD-TDP (both p > 0.29).
Correlation between antemortem CSF levels of the synaptic proteinsWe first sought to compare the pair-wise correlation between antemortem CSF levels of the synaptic proteins in each neuropathologic group (Fig. 1). A set of 3 proteins (calsyntenin-1, neurexin-2a and thy-1) showed pair-wise correlation in all groups (FTLD-Tau; rs = 0.79-0.87, p < 0.0001, FTLD-TDP; rs = 0.70-0.88, p < 0.009, AD; rs = 0.55-0.78, p < 0.007, Controls; rs = 0.68-0.81, p < 0.0001), while all other protein combinations were group-dependent.
Fig. 1
Pair-wise correlation of antemortem CSF levels of 8 synaptic proteins in FTLD, AD and controls. Pair-wise rs coefficients resulting from statistical tests performed in (a) FTLD-Tau, (b) FTLD-TDP, (c) AD and (d) controls are shown. Degree of shading is relative to size of Spearman rs coefficients, which are shown in bold where p < .05. A set of 3 proteins that correlated in all groups are highlighted by a black box
Antemortem CSF profile of the synaptic proteins across neuropathologic groupsWe next compared the CSF profile of the synaptic proteins across neuropathologic groups, including sex and age-at-CSF as covariates (Fig. 2). Of the 8 synaptic proteins, calsyntenin-1 showed the strongest association with neuropathologic group (F = 6.36, p = 0.004). In FTLD-TDP, we observed low CSF calsyntenin-1 compared to AD (0.72-fold, p = 0.001) and controls (0.80-fold, p = 0.02). In FTLD-Tau, we observed low CSF calsyntenin-1 compared to AD (0.79-fold, p = 0.03) but not controls (0.88-fold, p = 0.24). Calsyntenin-1 was comparable between FTLD neuropathological subtypes (p = 0.79) and between AD and controls (p = 0.60).
Fig. 2
Antemortem CSF SRM intensities of the synaptic panel across patient groups. Violin plots show the distribution of SRM intensities for each synaptic protein quantified in CSF for patients with neuropathological confirmation of FTLD-Tau (Tau), FTLD-TDP (TDP) or AD and cognitively normal subjects (Control). Solid horizontal lines show the mean value for each and boxes represent the standard error of the mean. The horizontal dotted line represents the mean value in the control group for each protein. Summary statistics for ANCOVA including sex and age-at-CSF performed on square root transformed data are shown at the top of each plot. ANCOVA p-values are adjusted for multiple testing (9 proteins). *p < .05, **p < .01 for Dunnet’s post-hoc tests
Neurexin-2a (F = 4.60, p = 0.01), thy-1 (F = 3.79, p = 0.03), neurexin-3a (F = 3.53, p = 0.03) and VAMP-2 (F = 4.58, p = 0.01) were also associated with neuropathologic group. Neurexin-2a was lower in FTLD-TDP compared to AD (0.77-fold, p = 0.04) and controls (0.78-fold, p = 0.02). Thy-1 was lower in FTLD-TDP compared to AD (0.73-fold, p = 0.04). Neurexin-3a was lower in FTLD-Tau compared to AD (0.66-fold, p = 0.01). VAMP-2 was elevated in AD compared to controls (1.6-fold, p = 0.005) and FTLD-Tau (1.43-fold, p = 0.03). The association of CSF calsyntenin-1, neurexin-2a and VAMP-2 with patient group remained when sex and age-at-CSF were excluded from the model (p = 0.009, p = 0.02, p = 0.02, respectively).
To determine the influence of AD comorbidity, we repeated these analyses in the FTLD subgroups without significant AD pathology (FTLD-Tau; n = 20, FTLD-TDP; n = 19). The principal associations we observed across groups in the total dataset held in this subset (Additional file 1). We observed no difference in any of the synaptic proteins between male and female participants (all p > 0.21) and no association with age-at-CSF analysis (all p > 0.10) in any neuropathologic group. The synaptic proteins were not associated with age-at-disease onset (all p > 0.07), duration from disease onset to CSF analysis (all p > 0.15), disease duration (all p > 0.15) or duration from CSF analysis to autopsy (all p > 0.06) in any neuropathologic group.
Association of antemortem CSF levels of the synaptic proteins with post-mortem pathological burden in FTLDIn FTLD-Tau, we observed no association between antemortem CSF levels of the synaptic proteins with age-at-death (all p > 0.11). In FTLD-TDP, neurexin-3a was inversely associated with age-at-death (rs = -0.55, p = 0.04). We observed no association between antemortem CSF levels of the 8 synaptic proteins with postmortem global tau burden (Additional File 2; all p > 0.17). Calsyntenin-1, neurexin-2a, thy-1 and neuroligin-2 were inversely associated with postmortem global TDP-43 burden (Fig. 3). With the exception of neuroligin-2 and thy-1, biological sex also significantly contributed to the associations (all p = 0.03). Moreover, the inclusion of covariates explained global postmortem TDP-43 burden better than simple linear regression models for each synaptic protein alone (all ANOVA p < 0.003). In a secondary analysis, we observed a stronger association of calsyntenin-1 when the outcome measure was restricted to regions with low to medium TDP-43 burden (brainstem + cerebellum + thalamus + basal ganglia; r2 = 0.61; p = 0.03). We also observed an association for neurexin-3a in regions with low to medium TDP-43 burden (r2 = 0.69; p = 0.01). This may be due to a ceiling effect in regions with high burden.
Fig. 3
Association of antemortem CSF levels of synaptic proteins with postmortem TDP-43 burden. Scatter plots show the antemortem SRM intensities for selected synaptic proteins quantified in CSF and post-mortem TDP-43 burden for patients with neuropathological confirmation of FTLD. Linear regression lines and standard error (shaded region) are shown for each plot. Adj.r2, p-values and t-statistics for the synaptic protein (syn t), time from CSF to autopsy (aut t), age-at-death (age t) and biological sex (sex t) are shown for each linear regression. P-values were adjusted for multiple testing (9 proteins)
To determine whether a combination of synaptic proteins could better explain postmortem tau and TDP-43 burden, we performed stepwise mixed entry linear regression starting with the synaptic proteins and covariates. No multimarker model was associated with global Tau (p > 0.13). On the other hand, a 6 variable model including calsyntenin-1, neurexin-3a, VAMP-2 and all 3 covariates was associated with global TDP-43 burden (Table 2a; r2 = 0.69, p = 0.003). Age-at-death, biological sex, calsyntenin-1, VAMP-2 were the significant contributors to this model (henceforth named Panel A[CLSTN1-VAMP2]). When controlling for the other variables, lower age-at-death (p = 0.01), lower CSF calsyntenin-1 (p = 0.0006), elevated CSF VAMP-2(p = 0.02) and being female (p = 0.01) were associated with elevated global TDP-43 protein. Additional File 3 plots the relative regression line of each variable.
Table 1 Demographic, clinical and neuropathological data for the samples included in the studyTable 2 Association of step-wise linear regression models with postmortem TDP-43 burden and MMSE outcome measures and diagnostic accuracyAssociation of antemortem CSF levels of the synaptic proteins with cognitive performance in FTLDWe first tested the association of the synaptic proteins from Panel A[CLSTN1-VAMP2] with MMSE score in FTLD patients including sex, age-at-CSF, and years of education as covariates. The panel was associated with MMSE in the total FTLD group (Table 2b; r2 = 0.19, p = 0.03) but not in FTLD-Tau (r2 = 0.33, p = 0.09) or FTLD-TDP (r2 = 0.17, p = 0.13). For comparison, no individual synaptic protein was associated with MMSE in FTLD (all p > 0.48) or in either neuropathologic subtype (FTLD-Tau; p = 0.35, FTLD-TDP; p > 0.52). Neurexin-3a and VAMP-2 were the significant contributors to this model. When controlling for the other variables, lower CSF VAMP-2 (p = 0.02) and elevated CSF neurexin-3a (p = 0.02) were associated with worse MMSE score. Additional file 4 plots the relative regression line of each variable.
To determine whether other combinations of synaptic proteins could improve the association of Panel A, we performed stepwise linear regression starting with the synaptic proteins and covariates. Compared to Panel A, a 6 variable model including calsyntenin-1, gluA4, syntaxin-1b, VAMP-2, age-at-CSF and education showed a stronger association with MMSE in FTLD-Tau (Table 2b; r2 = 0.49, p = 0.04). Age-at-CSF, calsyntenin-1, VAMP-2 and gluA4 were the significant contributors to the model (henceforth termed Panel B[CLSTN1-VAMP2-GLUA4]). When controlling for the other variables, elevated age (p = 0.03), elevated CSF calsyntenin-1 (p = 0.005), lower CSF VAMP-2 (p = 0.01) and lower CSF gluA4 (p = 0.03) were associated with worse MMSE score. Additional file 5 plots the relative regression line for each variable. An alternative 6 variable model, including gluA4, neuroligin-2, neurexin-3a, syntaxin-1b, age-at-CSF and education, showed a stronger association with MMSE in FTLD-TDP (Table 2b; r2 = 0.38, p = 0.02) and in all FTLD (Table 2b; r2 = 0.30, p = 0.002). GluA4, neurexin-3a and syntaxin-1b, age-at-CSF and years of education were the significant contributors to this model (henceforth termed Panel C[GLUA4-NRX3A-STX1B]). When controlling for the other variables, less education (p = 0.02), elevated age (p = 0.005), lower CSF gluA4 (p = 0.002), elevated neurexin-3a (p = 0.003) and elevated CSF syntaxin-1b (p = 0.03) were associated with worse MMSE score. Additional file 6 plots the relative regression line for each variable.
Thus, several multimarker panels of synaptic proteins are associated with cognitive performance in FTLD. Panels B and C were not associated with postmortem global TDP-43 or global Tau burden (all p > 0.1).
Diagnostic value.
The synaptic proteins showed modest diagnostic accuracy to distinguish FTLD-Tau from controls (highest AUC = 0.67 for neurexin-2a). The best multimarker panel was Panel B[CLSTN1-VAMP2-GLUA4], which showed only a nominal improvement (Table 2c; AUC = 0.71) compared to neurexin-2a (p = 0.67). This panel was statistically comparable to tau CSF biomarkers, pTau, tTau and pTau/tTau ratio (AUC = 0.65–73, all p > 0.53 vs Panel B). When distinguishing FTLD-Tau from AD, neurexin-3a gave nominally the highest AUC (0.75, 95% CI 0.60-0.88). Panel A[CLSTN1-VAMP2] showed a nominal improvement (Table 2c; AUC = 0.80) compared to neurexin-3a (p = 0.61) but still performed worse than pTau and the ptau/Aβ42 ratio (AUC = 0.95–98, all p < 0.04 vs Panel A).
Neurexin-2a gave nominally the highest AUC (0.75, 95% CI 0.62-0.87) for distinguishing FTLD-TDP from controls. Panel B[CLSTN1-VAMP2-GLUA4] showed only a nominal improvement (Table 2c; AUC = 0.82) compared to neurexin-2a (p = 0.41) but performed better than CSF tau markers (AUC = 0.62–68, all p < 0.04 vs Panel B). When distinguishing FTLD-TDP from AD, calsyntenin-1 gave nominally the highest AUC (0.76, 95% CI 0.62-0.89). Panel B showed only a nominal improvement (Table 2c; AUC = 0.81) compared to calsyntenin-1 (p = 0.56) and was significantly worse than the pTau/Aβ42 ratio (AUC = 0.96, p < 0.03 vs Panel B).
None of the synaptic proteins alone could discriminate FTLD-TDP from FTLD-Tau subtypes (all AUC < 0.67). However, Panel B performed significantly better (Table 2c; AUC = 0.83) than tau markers (0.51–62, all p < 0.05 vs Panel B) and the ptau/aβ42 ratio (AUC = 0.56, p = 0.009).
留言 (0)