Mice
BALB/cAnNCrl female 11-week-old wild-type mice (Charles River Laboratories, Wilmington, USA) were housed under controlled standard conditions (diurnal lighting conditions with food and water provided ad libitum) in a pathogen-free animal facility at Ulm University. Experimental procedures were approved by the Regierungsprasidium in Tubingen, Germany. For Cdk5 inhibition, mice were injected intraperitoneally (i.p.) with 150 mg·kg−1 roscovitine or vehicle (5% dimethyl sulfoxide (DMSO), 10% kolliphor EL, 85% 1x phosphate-buffered saline (PBS)) three times per week for 14 days as previously described38. Body weight was measured prior to every roscovitine injection, and the mice were euthanized through intracardial blood withdrawal under deep isoflurane anesthesia at Day 14 to collect the skeletons. Cdk5gtRosaCreERT2 mice were generated by intercrossing Cdk5flox mice68 and C57BL/6-GT(ROSA)26Sortm9(Cre/ESR1)Arte mice (Taconic Artemis, Köln, Germany) as previously described69.
Femur osteotomy
The surgeries were performed under general anesthesia with 2% isoflurane (Forene; Abbott Laboratories, Chicago, USA). Male 12-week-old mice received a unilateral femur osteotomy as described previously23. Briefly, the right femur was exposed, and the midshaft was osteotomized using a gigli wire saw (0.44 mm). Osteotomy stabilization was achieved using an external fixator (axial stiffness 3.2 N·mm–1; RISystem, Davos, Switzerland) that was fitted to the bone using four mini-Schanz screws. Mice received 25 mg·L–1 tramadol hydrochloride (Grünenthal, Aachen, Germany) in the drinking water as pain medication from one day pre- until 3 days post-surgery as well as anti-infective treatment with 45 mg·kg–1 clindamycin (clindamycin-2-dihydrogenphosphate; Ratiopharm, Ulm, Germany) just prior to surgery. All mice received i.p. injections of either vehicle (PBS/DMSO/Solutol 17:1:2) or 150 mg·kg–1 roscovitine (Selleckchem, Houston, USA) solution three to four times weekly for 14 or 23 days. Mice were euthanized under deep isoflurane anesthesia through intracardial blood withdrawal. Fractured right femora were removed for further analysis.
Microcomputed tomography (micro-CT)
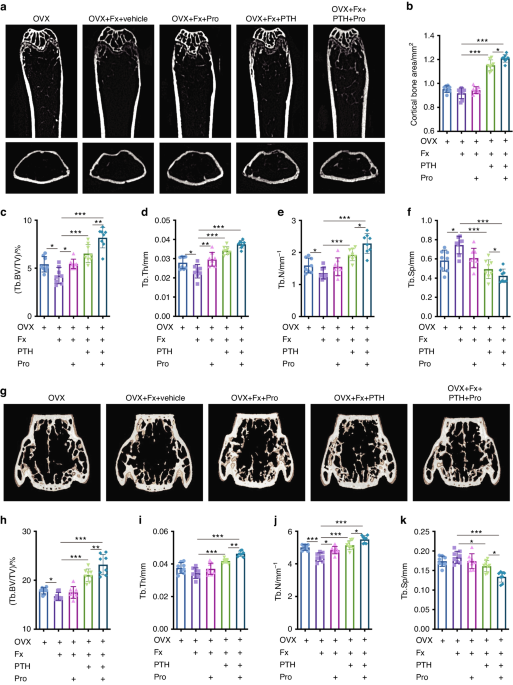
Images of the femurs were acquired by micro-CT using a Bruker Skyscan 1176 (Bruker, Kontich, Belgium) (X-ray voltage = 50 kV, X-ray current = 200 µA, filter = 0.5 mm aluminum, resolution = 9 µm, rotation step = 1°). For reconstruction of trabecular and cortical femurs, the region commenced ~0.215 mm and 1.935 mm from the growth plate in the direction of the metaphysis and was extended by 1.29 mm and 0.43 mm, respectively. Structural indices were determined by Bruker’s Skyscan CT Analyzer (CTan) software. The calculated trabecular and cortical parameters are presented in Fig. 3. Three-dimensional models were created using CT-volume.
In fractured femurs, the region of interest was defined as the periosteal callus between both inner pin holes. The BV/TV was determined using a global threshold of 642 mgHA·cm–2 as described previously70.
Biomechanical testing of the fracture callus
Directly after euthanasia, both femurs underwent biomechanical testing using a nondestructive three-point bending test in a universal material testing machine (Z10, Zwick Roell, Ulm, Germany) as described previously23,71. Briefly, the proximal end of the femur was fixed in an aluminum cup, which in turn was fixed to a hinge joint of the three-point bending setup in the material testing machine (Fig. 4i). The femur condyles rested unfixed on a bending support. The bending load was applied to the middle of the callus up to a maximum load of 2 N. Flexural rigidity (EI) was calculated from the slope (k) of the linear region of the force–displacement curve.
Bone histomorphometry
Femurs were isolated, fixed in 4% p-formaldehyde (PFA) for 3 days, decalcified with 15% EDTA for 10 days, paraffin-embedded, and sectioned (7 µm). Prior to tartrate resistant acid phosphatase (TRAP) staining, the femur sections were deparaffinized, incubated in TRAP-staining solution for 1 h, washed, counterstained with hematoxylin for 3 min, and mounted with Aquatex aqueous mounting media (Santa Cruz, Houston, USA). Static histomorphometry was performed on TRAP-stained sections for osteoblasts and osteoclasts and analyzed using the OsteoMeasure high-resolution digital video system (OsteoMetrics, Inc., Decatur, USA).
For dynamic histomorphometry, mice were injected (i.p.) with calcein solution, as described previously72,73, at 9 and 2 days prior to skeleton collection. Femurs were isolated, stripped of muscle and other soft tissues, fixed in 4% PFA, and embedded in methacrylate as previously described74. Histomorphometric analysis of 7 µm sections was performed according to standard procedures using the Osteomeasure system. The following parameters were measured: MAR and BFR. The results are shown in Fig. 3.
Enzyme-linked immunosorbent assays (ELISAs)
Blood was collected in heparin-coated tubes, incubated at room temperature (RT) for 15 min, and centrifuged at 2 000 × g for ten min at RT to collect the supernatant (plasma). PINP and CTX-I ELISAs (Immunodiagnostic Systems, Boldon, UK) were performed according to the manufacturer’s instructions.
Osteoblast differentiation
Primary calvarial osteoblasts were collected from mouse calvaria of 2- to 5-day-old pups, as previously described11. Briefly, following isolation, the calvariae were placed in 1 mL of digestion solution (0.2% w/v of both Collagenase A (Roche, Basel, Switzerland) and Dispase II (Roche, Basel, Switzerland)) and incubated at 37 °C with shaking at 700 r·min−1 for 10 min. The first supernatant (fraction 1) was discarded. The digestion was repeated four further times (fractions 2–5), and the supernatant of the combined fractions was collected in 15 mL Falcon tubes containing 500 µL of fetal bovine serum (FBS) (GE Healthcare, Chicago, USA). The collected supernatant was centrifuged at 1 500 r·min−1 for 5 min at RT. The cell suspension from each pup was resuspended in 3 mL of complete medium [α-MEM (Thermo Fisher Scientific, Waltham, USA) with 10% FBS and 1% penicillin/streptomycin (Sigma-Aldrich, St. Louis, USA)] and was plated in a six-well plate using one well per calvaria. The cells were maintained in an incubator under 5% CO2 at 37 °C overnight. The following day, any nonadherent cells were removed by replacing the cell culture medium with fresh complete medium. The cells were allowed to grow for 2–3 days until reaching ~80% confluency.
For all experiments, primary murine calvarial osteoblasts were seeded at a confluency of 12 000 cells per cm2, and 48 h after seeding, the medium was replaced by osteogenic induction medium [100 μg·mL−1 (+)-sodium L-ascorbate and 5 mmol·L−1 β-glycerophosphate (both Sigma-Aldrich, St. Louis, USA)]. Treatment with roscovitine (0.16 μmol·L−1) was performed in osteogenic induction medium. Ethanol vehicle at 0.01% was used as a control. Roscovitine treatment was performed every third day until the termination of the experiment.
Primary osteoblasts isolated by sequential digestions from the calvaria of neonatal Cdk5flox and Cdk5gtRosaCreERT2 pups were cultivated as described above. The cells were exposed to 1 μmol·L−1 4-hydroxytamoxifen (4-OHT) on the second day following isolation for 3 days. Subsequently, the cells were trypsinized, seeded, and allowed to differentiate by adding osteogenic induction medium as described above.
Human primary cells
The bone samples used were resected from the medial head of the first metatarsal bone during operative foot alignment correction by Chevron osteotomy. Regarding the surgical gain of samples, bone resection as described above is essential for Chevron osteotomy, such that no further damage or extra operation time is needed. Ethical approval for this study was obtained from the ethical commission of Ulm University (306/19). The bone sample was cut into ~2 mm Ø pieces, transferred into a 50-mL falcon, and washed several times vigorously with 1× PBS until it appeared white. Subsequently, the bone pieces were transferred into 10-cm petri dishes (10–12 pieces per dish) containing 7 mL of complete DMEM [DMEM (Thermo Fisher Scientific, Waltham, USA) with 10% FBS and 1% penicillin/streptomycin]. The cells were incubated at 37 °C under 5% CO2 (note: it can take up to 10 days before the first cells appear). Ten milliliters of complete DMEM was exchanged every third day for 6–8 weeks. Subsequently, the bone pieces were washed out from the dishes by using 1× PBS, and the attached cells were trypsinized and reseeded in new 10-cm dishes. The cells were cultured again for ~2 weeks until they reached 80% confluency.
For the siRNA experiment, human primary osteoblasts were reverse transfected and seeded at a confluency of 12 000 cells per cm2. The final siRNA concentration and percent RNAiMAX (Life Technologies, Carlsbad, USA) used were 20 nmol·L−1 and 0.125%, respectively. After 48 h, the medium was replaced with osteogenic induction medium, which was exchanged every third day until the termination of the experiment.
siRNA transfection
SMARTpool siRNA targeting mouse and human non-targeting #2 (Cat. D-001206-13-05), Cdk5 (Cat. M-040544-01-0005), Mapk1 (Cat. M-040613-01-0005), and CDK5 (Cat. M-003239-01-0005) were purchased from Dharmacon (Thermo Fisher Scientific, Waltham, USA). siRNA transfection was performed at a final siRNA concentration of 20 nmol·L−1 and 0.125% RNAiMAX as previously described11. The siRNA sequences used are given in Table S7.
High-content RNAi screening of a kinase library
The SMARTpool siRNA kinase library was purchased from Dharmacon. Reverse transfection was performed using the Tecan Freedom EVO pipetting workstation (Tecan Life Sciences, Maennedorf, Switzerland). This process was followed by the addition of a cell suspension using a BioTek cell dispenser (LabX, Midland, Canada). The cells were cultured for 8 days, followed by fixation, staining, image acquisition and analysis, data analysis, and finally hit selection as previously described11.
Quantitative ALP staining
For quantitative ALP, primary murine calvarial osteoblasts were seeded in 384-well plates and differentiated by adding osteogenic induction medium. The cells were fixed, stained, and analyzed as previously described11. For in vitro Cdk5 inhibition, primary murine calvarial osteoblasts were treated with either vehicle or roscovitine (0.16 μmol·L−1) for 6 and 14 days.
PrestoBlue, ALP, and Alizarin Red S staining
Cell viability, ALP staining, and Alizarin Red S staining were determined using PrestoBlue cell viability reagent (Life Technologies, Carlsbad, USA), ALP kit (Sigma-Aldrich, St. Louis, USA), and 1% Alizarin Red S (Sigma-Aldrich, St. Louis, USA) according to the manufacturers’ instructions and as previously described11.
Osteoclast differentiation
Bone marrow cells were isolated from femurs and tibias of 13-week-old male mice, and 2.5 × 10⁵ and 2.5 × 10⁶ cells were seeded in a 24-well plate and 6-cm dishes, respectively. Osteoclast differentiation was performed in α-MEM containing 10% FBS and 1% penicillin/streptomycin and supplemented with 50 ng·mL−1 RANKL (R&D Systems, Minneapolis, USA) and 20 ng·mL−1 M-CSF (R&D Systems, Minneapolis, USA) for 8 days, and the media was changed every second day. Roscovitine (0.16 μmol·L−1) treatment was performed every second day until the termination of the experiment. TRAP staining was performed using a TRAP kit (Sigma-Aldrich, St. Louis, USA), with osteoclasts defined as TRAP-positive cells with ≥3 nuclei. Osteoclast numbers were quantified using Osteomeasure software.
Bio-Plex assay
Protein lysates (10 µg per sample) were prepared from primary murine calvarial osteoblasts after 8 days of transfection with non-targeting siRNA or Cdk5-specific siRNA using a Bio-Plex cell lysis kit (Bio-Rad Laboratories, Hercules, USA). The phosphorylation levels of the proteins listed in Fig. 5e and f and Fig. S7a–d were determined using the Bio-Plex Pro Cell Signaling panel (Bio-Rad Laboratories, Hercules, USA) according to the manufacturer’s instructions. The data were analyzed using Bio-Plex Manager 6.1 software (Bio-Rad Laboratories, Hercules, USA).
RNA extraction, cDNA synthesis, and quantitative real-time polymerase chain reaction (PCR)
Total RNA was extracted from organs using TRIzol reagent (Life Technologies, Carlsbad, USA) and from cells using the RNeasy kit (Qiagen, Hilden, Germany) according to the manufacturers’ instructions. Reverse transcription of 1 000 ng RNA from both cells and organs was performed using the RevertAid H Minus reverse transcriptase kit (Fermentas, Waltham, USA). qPCR was performed on a ViiA 7 system (Applied Biosystems, Waltham, USA), and the relative mRNA concentrations normalized to that of β-actin were calculated by the 2−ΔΔCt method. The primer sequences used in qPCR are shown in Table S8.
RNA-seq and bioinformatics analysis
Following RNA isolation using the RNeasy kit (Qiagen, Hilden, Germany), the RNA concentration and integrity were determined using a 2100 Bioanalyzer and the RNA 6000 Nano kit (Agilent Technologies, Santa Clara, USA). RNA samples with an A260/A280 ratio of 1.9–2.0 and an RNA integrity number (RIN) > 9.5 were used. RNA sequencing by Illumina (HiSeq 2500, Illumina, San Diego, USA) was performed by Novogene (Novogene Company Limited, Cambridge, UK). The original image data file from high-throughput sequencing was transformed to sequenced reads by CASAVA base recognition. Sequence adapters and low-quality reads were removed using fastp. Quality control analysis of raw sequence data was performed with fastp. Subsequently, sequencing reads were mapped to the mouse reference genome (ensembl_mus_musculus_grcm38_p6_gca_000001635_8) using the STAR program. The expression quantity of each transcript was calculated by analysis of the alignment results using the feature counts, and the alignment results were analyzed by STAR. The FKPM method was applied to quantify gene expression. PCA was performed to identify the variability and repeatability of samples in R using RStudio with pcaExplorer75. The overall distribution of differentially regulated genes was visualized using a volcano plot [log2 FC ≥ 0.58 and ≤ -0.58 and FDR (adjusted P value) <0.05] in GraphPad Prism (v9.0.0). Hierarchical clustering analysis of all differentially regulated genes from primary murine calvarial osteoblasts treated with nontargeting siRNA or Cdk5-specific siRNA for eight days was performed in R using RStudio with pheatmap (RRID:SCR_016418). Gene Ontology (GO) analysis of genes with differentially up- and downregulated expression was performed using Metascape76. The top clusters from the GO terms from both the up- and downregulated groups present in our dataset were sorted and plotted on the basis of log2 FC using RStudio.
Protein isolation, quantification, and western blotting
Total cellular protein was extracted using RIPA lysis buffer, quantified using the Pierce BCA protein assay kit (Thermo Fisher Scientific, Waltham, USA), and subjected to western blotting as previously described11 using antibodies against Cdk5, pCdk5, Runx2, Mek1/2, pErk1/2, Erk1/2 (all from Cell Signaling Technology, Danvers, USA), Sp7 (Abcam, Cambridge, UK), pMek2 (Life Technologies, Carlsbad, USA), and α-tubulin (Sigma-Aldrich, St. Louis, USA). The band intensity of western blots was quantified using Fiji ImageJ.
Statistical analysis
Data are represented as box-and-whisker plots with min. to max. as well as superimposition of all the data points. Statistical differences between two groups were determined by unpaired homoscedastic two-tailed Student’s t test and two-way ANOVA with Sidak’s multiple comparisons test. A p value less than 0.05 was considered to be statistically significantly, *P < 0.05, **P < 0.01, ***P < 0.001.


留言 (0)