
記住我

Type 2 diabetes has become a public health problem worldwide, with an estimated 462 million people (6.28% of the world's population) having this disease (Khan et al., 2020). China has the largest number of patients with Type 2 diabetes (129.8 million; Li et al., 2020). Prediabetes is an impairment in fasting plasma glucose (Brannick & Dagogo-Jack, 2018). In a survey of 170,287 adults in China, 35.7% were found to have prediabetes (Wang et al., 2017). Prediabetes is not only a risk factor for Type 2 diabetes but also associated with an increased risk for cardiovascular diseases (Brannick & Dagogo-Jack, 2018). Therefore, managing prediabetes is crucial to preventing the onset of Type 2 diabetes. In individuals with prediabetes, controlling body weight has been shown to reduce the incidence of Type 2 diabetes significantly, especially in overweight and obese individuals with prediabetic conditions (Guess, 2018; Pal & Nanda, 2017).
Continuous calorie restriction is commonly used in body weight control and in interventions to prevent cardiometabolic diseases in obese and overweight populations (Rynders et al., 2019). However, people find it difficult to follow this diet pattern as it requires the consistent reduction of daily calorie intake (Golbidi et al., 2017). Furthermore, continuous calorie restriction may enable adaptive responses (e.g., increased appetite, reduced physical activity, deactivated hypothalamic–pituitary–thyroid axis), which results in weight regain (Seimon et al., 2015) and increases the risk of adverse effects such as hypoglycemia and malnutrition (Corley et al., 2018). Recently, intermittent fasting has been proposed as an alternative to continuous calorie restriction. Intermittent fasting typically involves restricting calorie consumption during a controlled period and then engaging in ad libitum calorie consumption during nonfasting times (Muñoz-Hernández et al., 2020). Therefore, individuals are more likely to adhere to this dietary plan than plans that mandate continuous calorie restriction. Alternate-day fasting (ADF) and time-restricted fasting (TRF) are the two most commonly used dietary interventions in intermittent fasting studies. ADF involves calorie restriction on the fasting day and eating ad libitum on “feed” days, whereas TRF allows individuals to eat during a specific, time-limited period each day and fast for the remaining time (e.g., an 8-hour eating window followed by fasting for the remaining 16 hours of the day; Muñoz-Hernández et al., 2020).
The effects of intermittent fasting on weight and blood glucose control in people with metabolic risks have been evaluated in several prior studies (Cho et al., 2019). A systematic review that synthesized the findings of 40 intermittent-fasting studies revealed significant reductions in body weight and fat mass and improvements in glucose homeostasis with intermittent fasting (Seimon et al., 2015). Similarly, the effects of intermittent fasting identified in prior interventional studies of overweight and obese adults were summarized in two recent meta-analyses, with findings supporting the effectiveness of this approach on weight loss (Cho et al., 2019; Harris et al., 2018). However, the intermittent fasting interventions differed across these studies, and no direct comparisons were made among the intermittent fasting interventions, making it difficult to determine the optimal intermittent fasting regimen. In addition, most previous studies focused on people who were overweight or obese, while excluding those with comorbid conditions such as prediabetes (Harris et al., 2018), which may put them at a higher risk of developing cardiometabolic diseases.
Thus, an evaluation of the effects of different, intermittent fasting regimens on weight control and the management of cardiometabolic outcomes in high-risk populations is urgently needed. Thus, this study was developed to examine the effects of ADF and 16/8 TRF on body weight, blood glucose, body mass index (BMI), waist circumference, and lipid profile in overweight and obese individuals with prediabetes.
Methods Study DesignThis was a randomized controlled trial (RCT) study that used convenience sampling. Participants were randomized to the ADF group (n = 34), the 16/8 daily TRF group (n = 33), and the usual care group (n = 34) using a computer-generated randomization list created by an offsite research staff who was not involved in the practical conduct of this study. Random numbers with allocation codes were kept in opaque sealed envelopes that were sequentially numbered and distributed to participants by a research assistant according to participants' enrolment sequence.
Participants and SettingThe participants were recruited from a weight management clinic in Hunan Provincial People's Hospital, Changsha, China, from August 2018 to April 2019. The inclusion criteria were as follows: (a) age of 18–65 years, (b) having a diagnosis of prediabetes (blood glucose level: 100–125 mg/dl; American Diabetes Association, 2020), (c) being overweight or obese (BMI: ≥ 23 kg/m2; WHO Expert Consultation, 2004), and (d) being able to give written informed consent. Patients were excluded from the study if they (a) were pregnant or planning to become pregnant; (b) had an eating disorder, a serious cognitive impairment, a psychiatric disease, or a gastrointestinal disorder; (c) were being treated with insulin, glyburide, or other antiobesity drugs; or (d) had been involved in a diary-related program during the previous 12-month period.
Sample Size EstimationThe sample size was determined as adequate for detecting a 5% difference in the reduction of body weight between the two intervention groups (Seimon et al., 2015). The power analysis software PASS 14.0 (NCSS, Kaysville, UT, USA) was used to estimate the power when regression analysis was applied. Thus, it was estimated that a sample size of 29 participants per arm was needed to give 80% power at a 5% level of significance (two sided). Allowing for a 10% attrition rate, 33 participants were recruited for each arm.
Dietary InterventionsThe intervention lasted for 3 weeks. The participants in both of the intervention groups received an individual education session on healthy diet provided by a nurse in the weight management clinic. This session covered topics including diet and health, benefits of energy control, and skills to maintain a healthy diet. The participants in the ADF group were instructed by a dietitian to consume 600 kcal on fasting days and to consume a usual diet on eating days. The fasting days alternated with eating days throughout the intervention period. The ADF group participants were free to divide up the calories into different meals during fasting days. The 16/8 TRF group was asked to consume their daily calorie intake during an 8-hour window during the daytime and then fast for the remaining 16 hours each day throughout the intervention period. Participants were free to arrange the 8-hour eating window based on personal preferences. The daily calorie requirement was determined according to Chinese Dietary Reference Intakes in which daily calorie requirements are estimated based on level of physical activity and gender (Chinese Nutrition Society, 2016). This flexibility was expected to help the participants adapt to their individual lifestyles and to facilitate compliance with the dietary intervention. In addition, both the ADF and 16/8 TRF groups received individualized menus tailored to their dietary interventions and individual counseling provided by a dietitian. Weekly telephone calls were conducted by a research nurse to facilitate participants' adherence to their dietary intervention. Furthermore, the participants were asked to record and report adverse effects experienced during the study period.
To minimize potential attention bias, the participants in the control group also received the same individual educational session. All of the participants were asked to maintain their usual physical activity throughout the study period.
Outcome Measures Primary outcomeThe primary outcome of this study was the change in body weight. Body weight was measured using a calibrated digital scale with light clothing and without shoes or jewelry.
Secondary outcomesSecondary outcomes included blood glucose, BMI, waist circumference, and a lipid profile that included total cholesterol, high-density lipoprotein cholesterol (HDL-C), low-density lipoprotein cholesterol (LDL-C), and triglyceride. Blood glucose was measured via blood testing in the laboratory of the study hospital. The blood sample was drawn by a trained research nurse via venepuncture after 8 hours of overnight fasting. BMI was calculated using the formula: body weight (kg) / body height2 (m2). Waist circumference was measured using a tape at midway between the bottom of the rib cage and the top of the iliac crest at the end of normal exhalation. Lipid profile was measured via blood testing in the laboratory of the studied hospital using the same blood sample for blood glucose testing.
Participants' physical activity may confound the intervention effects. Participants were asked to complete the physical activity subscale of the Chinese version of the Health Promoting Lifestyle Profile II to track changes in physical activity level. The Chinese version of the Health Promoting Lifestyle Profile II is a reliable and valid questionnaire, with a satisfactory Cronbach's alpha of .95 for the whole scale and .91 for the physical activity subscale in a Chinese sample (Meihan & Chung-Ngok, 2011).
Ethical ConsiderationsEthical approval was obtained from the Joint Chinese University of Hong Kong–New Territories East Cluster Clinical Research Ethics Committee (No. CRE-2017.704). Participants were informed about their right to withdraw from the study at any time without penalty to their present or future care. Furthermore, the study conformed to the principles outlined in the Helsinki Declaration.
Data CollectionPatients who were admitted for weight management were screened for eligibility based on the inclusion and exclusion criteria by a research nurse. The research nurse explained the study purposes, procedures, and benefits/risks to eligible patients and invited them to participate. After obtaining written informed consent, the participants were randomized to one of the three groups. Data collection was conducted at three time points: baseline (T0), end of the intervention (T1), and 3-month follow-up (T2).
Data AnalysisData analyses were performed using SPSS Statistics 22.0 (IBM Corp., Armonk, NY, USA). Descriptive statistics, including mean (SD), median (interquartile range), frequency, and percentage, were used as appropriate to present the data. Continuous data were examined for normal distribution using Q-Q plots. For comparisons among the three groups, one-way analysis of variance, Kruskal–Wallis test, and chi-square test were used as appropriate. The generalized estimating equation (GEE) model was performed to assess differences in the changes between groups in each outcome across the time points. The linear link function was applied for data that were normally distributed. For nonnormal distributed continuous data, the data were natural log-transformed before being subjected to GEE analysis. The autoregressive model (AR-1) was used for the working matrix. As the GEE is able to use partial observation data to estimate the regression parameters (Ziegler & Vens, 2010), the missing data were not particularly handled in the data analysis in this study. Adverse events during the duration of the study were recorded. The intention-to-treat principle was followed unless indicated otherwise. The level of significance was set at < .05 (two sided).
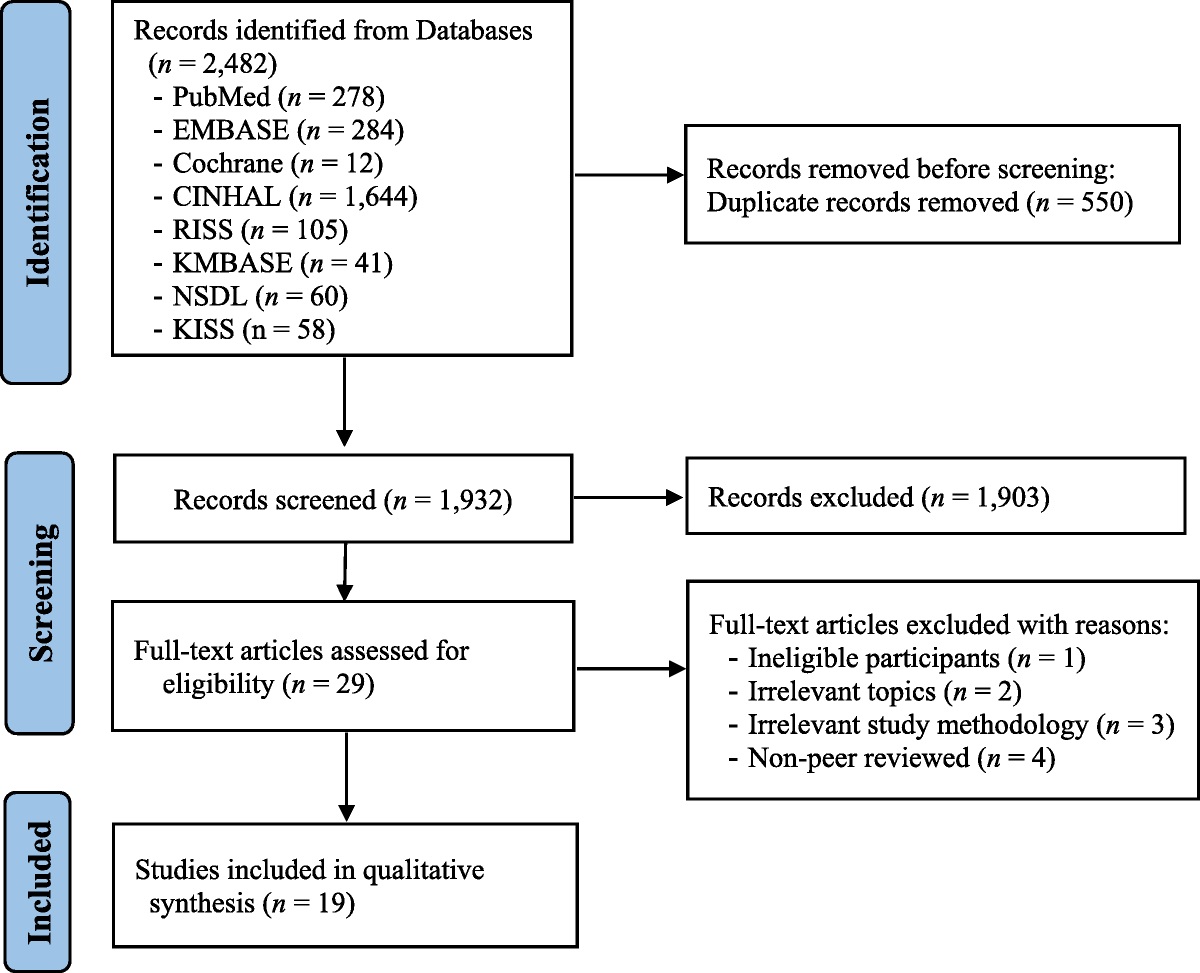
ResultsTwo hundred sixty-nine patients were screened and 168 were excluded, mainly because of ineligibility or lack of interest. One hundred one patients were included in the final sample and randomized, with 34 in the ADF group, 33 in the 16/8 TRF group, and 34 in the control group. There was one dropout in the ADF intervention group and no dropouts in the other two study groups. Three participants (all in the 16/8 TRF group) reported occasional feelings of hunger during fasting hours. No severe, adverse events were reported. The Consolidated Standards of Reporting Trials flowchart of this study is illustrated in Figure 1.
 Figure 1:
 Consolidated Standards of Reporting Trials Flowchart of the Study and Length, Width, and Size Similar
Characteristics of ParticipantsThe characteristics of the participants are presented in Table 1. Mean age was 35.23 (SD = 6.19) years, with more women (63.4%) than men (36.6%); most (80.2%) held a bachelor's degree and were married (86.1%). The average BMI was 26.56 (SD = 1.95) kg/m2, and the mean waist circumference was 90.77 (SD = 8.80) cm.
Table 1 - Baseline Characteristics of the Participants (N = 101) Characteristic Total Control (n = 34) ADF (n = 34) 16/8 TRF (n = 33) p n % n % n % n % Gender .013 b Female 64 63.33 20 58.88 28 82.35 16 48.48 Male 37 36.67 14 41.12 6 17.65 17 51.52 Educational attainment .301 b Associate degree or below 11 10.89 2 5.88 4 11.76 5 15.15 Bachelor's degree 81 80.20 29 85.29 29 85.29 23 69.70 Master's degree or above 9 9.01 3 8.83 1 2.95 5 15.15 Income level (RMB) .737 b < 6,000 44 43.56 13 38.24 16 47.06 15 45.45 ≥ 6,000 57 56.44 21 61.76 18 52.94 18 54.55 Marital status (n = 99) .025 b Single 12 12.12 3 8.82 1 3.03 8 25.00 Married 87 87.88 31 91.18 32 96.97 24 75.00 Living alone .926 b No 90 89.11 30 88.24 31 91.18 29 87.88 Yes 11 10.89 4 11.76 3 8.82 4 12.12 M SD M SD M SD M SD p Age (years) 35.23 6.19 34.97 6.23 34.68 4.37 36.06 7.67 .634 a Body weight (kg) 74.30 8.39 72.15 8.47 75.78 8.46 74.98 8.02 .173 a Body height (cm) 167.13 7.78 164.94 8.36 169.15 6.97 167.30 7.58 .081 a Body mass index (kg/m2) 26.56 1.95 26.47 1.84 26.46 2.36 26.74 1.58 .809 a Waist circumference (cm) 90.77 8.80 90.65 9.35 92.03 9.27 89.61 7.73 .531 a HDL-C (mmol/L) 1.14 0.36 1.26 0.42 1.02 0.24 1.15 0.37 .027 a LDL-C (mmol/L) 2.94 0.79 3.05 0.78 2.94 0.73 1.14 0.37 .492 a Total cholesterol (mmol/L) 4.63 1.32 4.89 1.32 4.94 1.16 4.04 1.30 .006 a TG (mmol/L; median and interquartile range) 2.16 1.70–2.79 1.97 1.37–2.52 2.36 1.77–2.66 2.26 1.93–3.21 .307 c Blood glucose (mmol/L; median and interquartile range) 5.13 4.72–5.64 4.92 4.67–5.69 5.14 4.82–5.65 5.30 4.80–5.52 .574 c Physical activity score (range: 8–32) 16.40 4.53 16.03 5.02 18.38 4.16 14.73 3.59 .003 aNote. ADF = alternate-day fasting; TRF = time-restricted fasting; RMB = renminbi; HDL-C = high-density lipoprotein cholesterol; LDL-C = low-density lipoprotein cholesterol; TG = triglyceride.
a One-way analysis of variance. b Chi-square test. c Kruskal–Wallis analysis.
No significant differences in most of the baseline variables were observed among the three study groups, with the exception of gender (p = .013), marital status (p = .025), HDL-C (p = .027), total cholesterol (p = .006), and physical activity level (p = .003). These variables were then considered as confounding factors and adjusted in the GEE analysis.
Body WeightThe results of the GEE analysis are presented in Tables 2 and 3. Compared with the control group, both of the intervention groups showed significant body weight reductions at T1 and T2 (all ps < .001; Table 2). Compared with the 16/8 TRF group, the ADF group showed more significant weight reductions across the study period (all ps < .001; Table 3).
Table 2 - Generalized Estimating Equation (GEE) Models for the Comparison of Cardiometabolic Outcomes Across Time Between the Control Group and the Two Intervention Groups (With the Control Group as Reference) Variable a Body Weight (kg) Body Mass Index (kg/m2) Waist Circumference (cm) HDL Cholesterol (mmol/L) β 95% CI p β 95% CI p β 95% CI p β 95% CI p T1 −0.06 [−0.14, 0.02] .145 −0.02 [−0.05, 0.01] .145 −0.15 [−0.49, 0.20] .406 0.13 [−0.03, 0.29] .101 T2 −0.24 [−0.49, 0.02] .074 −0.09 [−0.19, 0.01] .082 −0.18 [−0.46, 0.11] .230 −0.05 [−0.20, 0.11] .565 ADF 4.85 [0.89, 8.80] .016 0.00 [−1.06, 1.06] .998 1.66 [−2.57, 5.88] .442 −0.27 [−0.43, −0.11] .001 16/8 TRF 2.73 [−0.91, 6.37] .141 0.45 [−0.37, 1.26] .285 −0.22 [−4.11, 3.66] .910 −0.06 [−0.25, 0.12] .505 ADF × T1 −14.72 [−18.92, −10.52] < .001 −3.69 [−4.80, −2.57] < .001 −8.16 [−11.98, −4.34] < .001 0.28 [0.02, 0.53] .032 ADF × T2 −14.80 [−19.02, −10.58] < .001 −3.69 [−4.81, −2.57] < .001 −8.34 [−12.14, −4.54] < .001 0.34 [0.08, 0.60] .009 16/8 TRF × T1 −4.55 [−5.65, −3.45] < .001 −1.59 [−1.96, −1.22] < .001 −5.54 [−7.22, −3.86] < .001 −0.08 [−0.32, 0.16] .517 16/8 TRF × T2 −4.44 [−5.52, −3.35] < .001 −1.55 [−1.91, −1.18] < .001 −5.67 [−7.23, −4.11] < .001 0.45 [0.14, 0.75] .004Note. Only the model estimates of regression coefficients of the dummy variables for group (ADF: 0 = control [reference], 1 = ADF group; 16/8 TRF: 0 = control [reference], 1 = 16/8 TRF group), time points (T1 and T2 with the baseline [T0] as reference), time points, and group interaction terms (ADF × T1, ADF × T2, 16/8 TRF × T1, and 16/8 TRF × T2) are shown for the GEE models. HDL = high-density lipoprotein; LDL = low-density lipoprotein; ADF = alternate-day fasting; TRF = time-restricted fasting; T1 = end of the intervention; T2 = 3-month follow-up.
a Gender, marital status, baseline levels of HDL-C, total cholesterol, and physical activity were adjusted. b Natural log-transformed before being subjected to GEE analysis.
Note. Only the model estimates of regression coefficients of the dummy variables for group (0 = 16/8 TRF group [reference], 1 = ADF group; time points [T1 and T2 with the baseline [T0] as reference), time points, and group interaction terms (ADF × T1, ADF × T2) are shown for the GEE models. HDL = high-density lipoprotein; LDL = low-density lipoprotein; ADF = alternate-day fasting; TRF = time-restricted fasting; T1 = end of the intervention; T2 = 3-month follow-up.
a Gender, marital status, baseline levels of HDL-C, total cholesterol, and physical activity were adjusted. b Natural log-transformed before subjected to GEE analysis.
留言 (0)