
記住我


In this retrospective study, we searched in our electronic database system in the years from January 2014 to December 2019 for the terms “mesenteric ischemia”, “bowel ischemia” and “intestinal ischemia” in all radiological reports of patients who underwent a non-enhanced and contrast-enhanced abdominal CT examination in the arterial and portal-venous phase. The entire report text was screened for the terms mentioned above. The clinical suspicion of mesenteric ischemia was taken from the order indication.
We found a total of 540 patients. 408/540 patients (76%) had no PI in CT and were thus excluded. Care was taken to not mistake pseudo-pneumatosis as PI [10]. Twenty-three of the remaining 132 patients (30%) had to be excluded because of a missing signed consent. The remaining 109 patients were included in this study (Table 1). This study had institutional review board and local ethics committee approval.
Table 1 Patient demographicsCT imagingAll CT examinations were performed on a second or third generation dual-source CT scanner (SOMATOM Definition Flash or Force, Siemens Healthineers, Forchheim, Germany) using our institutional multiphasic abdominal CT protocol settings including a non-enhanced, followed by an arterial and portal-venous phase CT scan (intravenous administration of 70–100 mL iodinated contrast media depending on the body weight). Standard image reconstructions were performed with a slice thickness of 2 mm (increment 1.5 mm) using a medium-soft tissue convolution kernel.
Image interpretationTwo radiologists (one with 4 years and one with 15 years of experience in abdominal imaging) being blinded to the clinical data evaluated independently all abdominal CT examinations. The two readers evaluated all imaging findings being indicative of mesenteric ischemia listed in Table 2 [11]. Readers were requested to note the anatomical location of all abnormal findings. Concerning the bowel wall, the criteria included wall thickening (> 0.5 cm), non-enhanced hyperdense wall, distension of the bowel (defined as > 3 cm in small bowel, > 9 cm in cecum and > 6 cm in colon), reduced wall enhancement, and presence of ileus (mechanical vs paralytical). For the abdominal cavity, the readers listed the presence of mesenteric edema (misty/dirty mesenteric fat), ascites (the presence of fluid in anatomical pouches), free air and additional locations demonstrating ischemia (namely the liver, spleen, kidneys) [12]. The abdominal arteries and veins were evaluated for atherosclerosis and occlusion. In case of disagreement, consensus reading of the two radiologists was performed, which was required in 11 of the 109 patients (10%).
Table 2 Extracted data from abdominal CT and from the electronic patient recordsData analysisOne of the readers (with 4 years of experience) collected laboratory tests, clinical findings, patient history, treatment during hospitalization and results from surgery and histopathology, if available, for all patients (see Table 2). The reviewed variables included also age, sex, smoking, obesity, body mass index (BMI), comorbidities such as diabetes and heart disease (including coronary atherosclerosis, heart failure such as hypertensive cardiomyopathy, valvular stenosis, previous myocardial infarction, heart transplantation), other risk factors such as underlying malignancy, as well as symptoms (pain, nausea, vomiting), and clinical findings at the time of presentation and CT.
Treatment and patient outcomeThe 109 patients were divided into two groups: Those who were operated (n = 85/78%) and those who were not operated within 30 days of CT (n = 24/22%). Patients who were not operated underwent conservative therapy according to the underlying disease.
Patients who underwent surgery were divided into a group with curative intent and to an exploratory group (which are not mutually exclusive, as there were explorative laparotomies that turned into surgery with curative intent, Fig. 1). Laparotomy and laparoscopy were categorised in the explorative group. The following types of surgery (i.e. subtotal and total colectomy, hemicolectomy right and left, partial resection of the small bowel, Hartmann surgery, ileocecal resection, sleeve gastrostomy and hepaticojejunostomy) were noted. Conservative treatment included, among others, the application of antibiotics, bowel rest and/or palliative care.
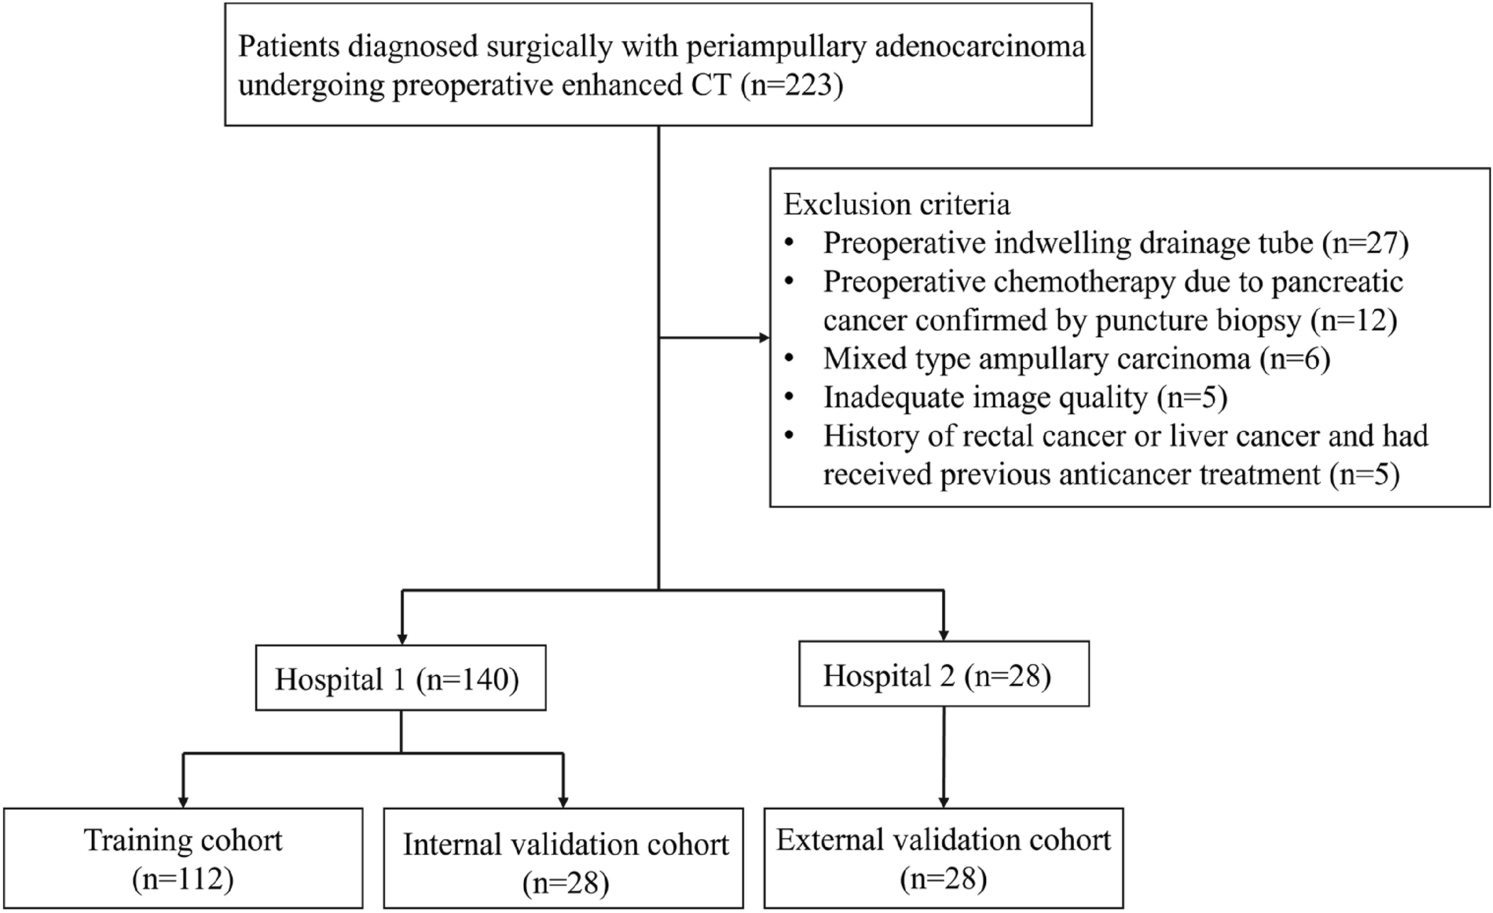
Fig. 1
Study flowchart. Please note that the total amount exceeds the number of patients as some received both endoscopy and surgery
Mortality rates were calculated for 30 days after CT (hereafter called short-term mortality).
Statistical analysisA binary regression model was conducted to predict short-term mortality of the present data. A total of 78 bivariate models were constructed, one for each predictor variable of interest. Mortality was coded as a binary variable representing death, while the predictors were coded as continuous, ordinary (categories), nominal (each category regarded separately such as normal, high or low levels), and binary variables.
There were nine possible groups of correlated variables and one such group was discovered in the data (nausea and vomiting). Multi-collinearity tests, tests for suppression effects and confounding variables were performed to distinguish the independent effect of each predictor. In the cases where the variables were highly correlated, a factor score encompassing all of them was constructed after a parallel analysis to determine the number of components. Additionally, a principal component analysis was performed to calculate the respective score. This factor score was then used to calculate the unbiased effect of the variables.
Four separate multivariate models were conducted with the location of pneumatosis, distension, thickening, and edematous bowel wall as predictors. One multivariate logistic regression was conducted with these abnormalities in the colon as predictors. This was done because their effects were both significant in the previously calculated bivariate and multivariate models and there was a possibility of confounding effects. Finally, a multivariate model was conducted by including all significant variables. After tests of multicollinearity, likelihood ratio tests, and comparisons of information criteria, a model with an optimal set of predictors was constructed. All statistical analyses were performed using commercially available statistical software (R, R Core Team, version 4.0.2).
留言 (0)