
記住我


Androgen-deprivation therapy (ADT) and androgen receptor (AR)-targeted therapies have significantly improved outcomes for patients suffering from advanced prostate cancer (PCa). However, treatment resistance ultimately leads to the development of lethal castration-resistant prostate cancer (CRPC), which remains a major therapeutic challenge.
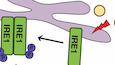
Resistance to treatment is accompanied by a plethora of cellular and metabolic adaptations that allow cancer cells to cope with stress-inducing factors (Marine et al, 2020). Together with mitochondria, the endoplasmic reticulum (ER) plays a central role in the regulation of stress-signalling pathways. Indeed, the ER is critical for the establishment of a complex stress response, termed the unfolded protein response (UPR), that orchestrates the cellular adaptation to various perturbations such as impairment of protein or lipid homeostasis. Activation of the UPR relies on the coordinated action of three major branches, each of them characterised by the activity of a specific ER stress sensor: Inositol Requiring Enzyme 1 (IRE1α), PRKR-like Endoplasmic Reticulum Kinase (PERK) and Activating Transcription Factor 6 (ATF6). In cancer, correct induction of the UPR is required to support oncogenic transformation (Hart et al, 2012). Persistent activation of ER stress responses can further promote tumour progression, metastasis dissemination and resistance to therapy (Chen & Cubillos-Ruiz, 2021). Therefore, clinical targeting of the UPR, alone or in combination with other treatment modalities, is regarded as a promising strategy for the treatment of aggressive cancer (Logue et al, 2018; Xie et al, 2018; Zhao et al, 2018; Jin & Saatcioglu, 2020). This strategy is particularly effective in the context of PCa, where inhibition of the IRE1a branch of the UPR significantly impairs tumour growth and activation of c-MYC signalling (Sheng et al, 2019), an important feature of ADT resistance (Bernard et al, 2003). Similarly, targeting of the PERK-eIF2a-ATF4 branch of the UPR effectively reduces tumour progression and metastasis dissemination in preclinical models of CRPC (Nguyen et al, 2018), while ATF4 signalling is essential for PCa growth and survival (Pallmann et al, 2019).
The ER is also the primary site of lipid and cholesterol biosynthesis. Changes in lipid homeostasis, such as impaired membrane lipid saturation (Pineau et al, 2009) or imbalance in the levels of phospho- and sphingolipid species (Han et al, 2010; Thibault et al, 2012), can also contribute to ER stress. Recently, we and others demonstrated the importance of lipid remodelling in tumour resistance to antiandrogen therapy (Blomme et al, 2020; Tousignant et al, 2020). Thus, targeting lipid-mediated ER stress could be considered as a potential therapeutic option for the treatment of CRPC.
Acyl-CoA thioesterases (ACOTs) are a class of enzymes that hydrolyse acyl-CoA molecules. In contrast with type I enzymes, type II ACOTs are related by structure rather than sequence, as evidenced by their low levels of sequence similarity (Cohen, 2013). By contrast, type II ACOTs are characterised by the presence of an evolutionarily conserved domain, the “Hotdog” domain, which confers the thioesterase enzymatic activity (Pidugu et al, 2009). Type II ACOTs also include members of the Thioesterase Superfamily (THEM), which primarily function to deactivate fatty acyl-CoA thioesters and generate free fatty acids (FA) and CoA. THEM proteins are involved in the regulation of intracellular FA trafficking and have been shown to influence both lipogenesis and beta-oxidation depending on the physiological context (Tillander et al, 2017). Interestingly, overexpression of thioesterase superfamily member 6 (THEM6/c8orf55) has been reported in several cancer types in a proteomic study focusing on the identification of colon cancer biomarkers (Kume et al, 2014). However, the biological role of THEM6 in normal and pathological physiology remains unexplored.
In this study, we identified THEM6 as a clinically relevant protein associated with ADT resistance in PCa. Mechanistically, we show that THEM6 maintains lipid homeostasis by controlling intracellular levels of ether lipids. Consequently, THEM6 expression is critical for ER membrane integrity, sterol biosynthesis and ATF4 activation under ADT conditions. Importantly, high THEM6 expression is frequently observed in CRPC patient biopsies, correlates with high levels of UPR activation and is associated with shortened patient survival. Taken together, our results highlight the potential of THEM6 as a future therapeutic option for the treatment of CRPC.
Results THEM6 expression is increased upon ADT resistanceWe previously performed an in-depth proteomic analysis comparing in vivo hormone-naïve (HN) and castration-resistant (CRPC) orthograft models of PCa (Martinez et al, 2021). For this purpose, we injected matched pairs of isogenic human PCa cell lines (namely 22rv1/CWR22res and LNCaP AI/LNCaP) into the prostate of immuno-deficient mice to generate tumour orthografts. Importantly, CRPC cells (22rv1 and LNCaP AI) were routinely cultured in absence of androgens and subsequently injected into castrated mice, while the matched HN cells (CWR22res and LNCaP) were cultured in androgen-containing medium and further injected into intact mice. We then sought to identify the proteins that were commonly regulated following ADT in the different models. From this comparison, we identified THEM6/c8orf55 as a protein significantly upregulated in CRPC tumours (22rv1 and LNCaP AI) when compared to HN counterparts (CWR22res and LNCaP, respectively; Figs 1A and EV1A). Increased THEM6 levels in CRPC conditions were validated in vivo (Fig 1B and C) and in vitro (Fig EV1B). Of note, THEM6 expression was the lowest in normal prostate epithelial cells (RWPE-1) when compared with multiple PCa cell lines (Fig EV1B). Immunohistochemistry (IHC) staining of prostate orthografts confirmed THEM6 over-expression in CRPC tumours and highlighted strong cytoplasmic and perinuclear staining in tumour epithelial cells (Fig 1C).

Figure 1. Loss of THEM6 impairs PCa tumour growth following ADT
Volcano plot of the differentially modulated proteins in 22rv1 (CRPC) versus CWR22res (HN) tumours. Red and blue dots represent the proteins that are significantly up- and down-regulated, respectively (P-value < 0.05, FC = 1.5). Western blot analysis of THEM6 expression in CRPC (22rv1 and LNCaP AI) and HN (CWR22res and LNCaP) prostate orthografts. VCL was used as a sample loading control. IHC staining of THEM6 expression in CWR22res and 22rv1 orthografts. Scale bar represents 100 µm. Western blot analysis of THEM6 expression in CTL and THEM6 KO CRPC cells. HSC70 was used as a sample loading control. Proliferation of CTL and THEM6 KO CRPC cells after 72 h. Data are expressed as a percentage of CTL cells. Cell stiffness (Young's modulus) of CTL and THEM6 KO CRPC cells measured by atomic force microscopy. Tumour volume (measured by ultrasound) of CTL and THEM6 KO 22rv1-derived orthografts developed in surgically castrated mice. Tumour volume of CTL and THEM6 KO LNCaP AI-derived xenografts developed in surgically castrated mice. Tumour volume (measured by ultrasound) of CTL and THEM6 KO CWR22res-derived orthografts. Orchidectomy was performed 3 weeks after cell implantation.Data information: Panels (E, G, H, I) Data are presented as mean values ± SD. Panel (F) Centre line corresponds to median of data, top and bottom lines correspond to maximal and minimal values. Statistical analysis: (E, F) One-way ANOVA with a Dunnett's multiple comparisons test. (G, H) two-tailed Mann–Whitney U-test. (I) Kruskal–Wallis test. Data reproducibility: Panel (A) n = 3 tumours per group. Panel (B) n = 1 gel loaded with three prostate orthografts per condition. Panels (C, D) representative image from 3 independent biological experiments. Panel (E) n = 3 independent biological experiments. Panel (F) (up): n = 46 (CTL); 47 (KO1); 49 (KO2) cells measured. Panel (F) (down): n = 31 (CTL); 43 (KO1); 50 (KO2) cells measured. Panels (G, I) n = 5 mice per group. Panel (H) n = 7 mice per group.
Source data are available online for this figure.
Click here to expand this figure.
Figure EV1. THEM6 is overexpressed following ADT resistance
Volcano plot of the differentially modulated proteins in LNCaP AI (CRPC) versus LNCaP (HN) tumours. Red and blue dots represent the proteins that are significantly up- and down-regulated, respectively (P-value ≤ 0.05, FC = 1.5). Western blot analysis of THEM6 expression in PCa cells. HSC70 was used as a sample loading control. Within a panel of PCa cell lines, androgen receptor (AR)-positive CRPC (namely 22rv1 and LNCaP AI) cells express THEM6 at higher levels than their respective isogenic HN (LNCaP and CWR22res) counterparts. Representative pictures of haematoxylin/eosin staining on orthografts from CWRres CTL and THEM6 KO tumours. C = cancer cells; N = necrotic area. Scale bar represents 1,000 µm.Data information: Data reproducibility: (A) n = 3 tumours per group. (B) representative image from three independent biological experiments. (C) representative image from three tumours per group.
Source data are available online for this figure.
Loss of THEM6 affects PCa tumour growth and increases tumour response to ADTTo investigate the role of THEM6 in CRPC, we generated stable CRISPR-based THEM6 knockout cell lines (hereafter referred to as THEM6 KO; Fig 1D). On average, THEM6 KO resulted in a mild (~ 20–25%) decrease in CRPC cell proliferation (Fig 1E). Interestingly, THEM6-depleted cells also displayed increased cell stiffness (Fig 1F), a phenotype which is indicative of membrane and cytoskeleton reorganisation and associated with impaired migratory abilities (Rudzka et al, 2019). In vivo, loss of THEM6 significantly reduced tumour volume in a CRPC model of 22rv1-derived orthografts (assessed by ultrasonography, Fig 1G). Similarly, THEM6 KO significantly impaired the growth of LNCaP AI tumours developed in castrated mice (Fig 1H). In both models, orchidectomy was performed at the time of cell transplantation to mimic the in vivo environment of ADT. To complement the use of the CRPC models, we tested whether THEM6 loss would also sensitise PCa tumours to acute ADT treatment. For this purpose, we applied the CWR22res orthograft model which allows us to study the effects of ADT on pre-established tumours (orchidectomy 3 weeks post-injection), thus better resembling treatment in clinical patients (Patel et al, 2018). Similar to 22rv1 and LNCaP AI, THEM6 KO strongly impaired tumour growth following ADT in the CWR22res orthograft model (Fig 1I). In addition to decreased tumour size, THEM6-deficient orthografts exhibited large necrotic areas and decreased cellularity, especially under ADT conditions (Fig EV1C). Taken together, these data support a pro-tumorigenic role for THEM6 in PCa.
THEM6 regulates cellular lipid metabolismAs a member of the THEM superfamily, THEM6 exhibits an evolutionarily conserved “Hotdog” domain predicted to confer thioesterase activity (Tillander et al, 2017). Rewiring of lipid metabolism is a common feature of ADT resistance (Blomme et al, 2020). Therefore, we hypothesised that THEM6 could participate in the lipid rearrangement required for CRPC progression. To evaluate the impact of THEM6 loss on the lipid composition of CRPC cells, we compared the lipid profiles of control (CTL) and THEM6 KO cells using LC-MS lipidomics. Strikingly, loss of THEM6 in 22rv1 cells resulted in a profound remodelling of the cellular lipidome. THEM6 depletion was associated with a strong reduction in the intracellular levels of multiple triglyceride (TG) and ether lipid species (ether triglycerides [ether TG] and ether phospholipids [ether phosphatidylcholines (ether PC) or ether phosphatidylethanolamines (ether PE)]). In contrast, THEM6 KO cells displayed increased amounts of ceramides (Fig 2A). In addition to specific lipid changes, THEM6 KO also significantly affected the total amount of TGs, ether TGs and ceramides in 22rv1 cells (Fig 2B). Interestingly, the intracellular levels of several ether lipid species (but not TG) were also strongly reduced in LNCaP AI THEM6 KO cells when compared to their respective CTL (Figs 2C and EV2A). In line with these data, transient overexpression of THEM6 in CWR22res cells (Fig EV2B) resulted in increased levels of specific lipid molecules, including multiple species of TGs, ether-TGs and ether-PCs (Fig 2D). Total amounts of TGs and ether-TGs were also significantly increased following THEM6 overexpression (Fig 2E). Taken together, these results suggest that THEM6 loss might primarily affect ether lipid homeostasis. We further assessed the effect of THEM6 KO on lipid content in vivo by performing Raman spectroscopy on ADT-treated CWR22res orthografts. Raman spectroscopy allows assessment and quantitation of lipids (band at 2,845 cm−1) and cholesterol (band at 2,880 cm−1) content on paraffin-embedded tumour slides in a non-destructive manner (Fig 2F). Results from the analysis provided evidence that THEM6-deficient tumours (Fig 1I) display significantly less lipids (Fig 2G) and cholesterol (Fig 2H) than CTL tumours, thus confirming a role for THEM6 in the maintenance of the tumour lipidome.

Figure 2. Loss of THEM6 alters lipid homeostasis
A. Heatmap illustrating the steady-state levels of significantly regulated lipids in THEM6 KO 22rv1 cells when compared to CTL (P ≤ 0.05, FC = 1.3). Values are expressed as log2(FC). B, C. Changes in lipid content (total amount) observed in THEM6 KO CRPC cells when compared to CTL. D. Heatmap illustrating the steady-state levels of significantly regulated lipids in THEM6 OE CWR22res cells when compared to EV (P ≤ 0.05, FC = 1.2). Values are expressed as log2(FC). E. Changes in lipid content (total amount) observed in THEM6 OE CWR22res cells when compared to EV. F. Average Raman spectra of CWR22res CTL and THEM6 KO orthografts. G, H. Quantification of tumour lipid (2,845 cm−1-peak) and cholesterol (2,880 cm−1-peak) content obtained from (F).Data information: AU, arbitrary unit. Panels (B, C, E) Data are presented as mean values ± SD. Panels (G, H) Centre line corresponds to median of data, top and bottom lines correspond to upper and lower quartiles. Statistical analysis: (B, C) *P-value < 0.05 using a one-way ANOVA with a Dunnett's multiple comparisons test. (E) *P-value < 0.05 using a two-tailed Student's t-test. (G, H) Kruskal–Wallis test. Data reproducibility: Panels (A, B, C, D, E) n = 3 independent biological experiments. Panel (F) n = 4 mice per group. Panel (G, H) n = 6,581 (CTL); 12,047 (KO1); 6,493 (KO2) peak intensities that were extracted from four mice per group. CE, Cholesteryl ester; Cer, Ceramide; DAG, diacylglycerol; EV, Empty Vector; LysoPC, lysophosphatidylcholine; LysoPE, lysophosphatidylethanolamine; PC, phosphatidylcholine; PE, phosphatidylethanolamine; PI, phosphatidylinositol; SM, sphingomyelin; TG, triglyceride.
Source data are available online for this figure.
Click here to expand this figure.
Figure EV2. Loss of THEM6 alters lipid homeostasis
Heatmap illustrating the steady-state levels of significantly regulated lipids in THEM6 KO LNCaP AI cells when compared to CTL (P ≤ 0.05, FC = 1.3). Values are expressed as log2(FC). Western blot analysis of THEM6 expression in CWR22res cells overexpressing THEM6 (T6 OE). HSC70 was used as a sample loading control.Data information: Data reproducibility: (A) n = 3 independent biological experiments. (B) representative image from two independent biological experiments.
Source data are available online for this figure.
THEM6 is an ER membrane protein that is essential to maintain ER integrityTo gain further insights into the role of THEM6 in cancer cells, we performed a proteomic comparison of 22rv1 cells proficient or depleted for THEM6 (Fig 3A). Proteomic analysis highlighted a large cluster of ER-related proteins that were significantly down-regulated in the absence of THEM6 (FC = 1.3, P < 0.05, Fig 3B and Table EV1). In addition, the majority of these proteins were described as membrane proteins (Fig 3B). Lipids are essential components of biological membranes, and the ER is particularly sensitive to lipid perturbation (Volmer & Ron, 2015). Electron microscopy confirmed the negative impact of THEM6 depletion on ER morphology. Indeed, THEM6 KO cells presented with abnormal ER, exhibiting rounded structures with highly dilated lumens (Fig 3C). To assess the impact of THEM6 loss on the ER membrane, we further quantified the length of the ER, the length of the plasma membrane (PM) as well as the ratio ER/plasma membrane. While THEM6 loss did not affect the PM length, the size of the ER membrane and therefore the ER/plasma membrane ratio were reduced in THEM6 KO cells in comparison to CTL (Fig 3D). The presence of abnormally enlarged mitochondria and large multilamellar lysosomes was also frequently observed in THEM6 KO cells, potentially reflecting general membrane perturbations following THEM6 loss (Fig EV3A). Interestingly, THEM6 strongly co-localised with the ER marker calreticulin (Figs 3E and EV3B), but not with mitochondria (Fig EV3C). This result suggests that THEM6 is predominantly associated with the ER, contrasting with the mitochondrial localisation reported for other THEM superfamily members (THEM2/4/5) (Cohen, 2013). Furthermore, topological analysis of the THEM6 protein sequence highlighted a 17-amino acid signal peptide that corresponds to a well-defined N-terminal transmembrane domain (Fig 3F). Finally, Western blot (WB) analysis after subcellular fractionation confirmed the presence of THEM6 in the insoluble organellular/membrane fraction of CRPC cells (Figs 3G and EV3D).

Figure 3. THEM6 interacts with multiple ER membrane components involved in protein transport
Venn diagram highlighting commonly modulated proteins (P-value ≤ 0.05, FC = 1.3) in THEM6 KO 22rv1 cells (two clones) when compared to CTL. Up-regulated proteins are on top; Down-regulated proteins are into brackets. Enriched cellular components commonly down-regulated in THEM6 KO 22rv1 cells (two clones) when compared to CTL. Representative electron microscopy (EM) pictures of CTL and THEM6 KO 22rv1 cells taken at low (left) and high (right) magnification. Red arrows point towards abnormal ER structure. Scale bar represents 500 nm. Quantification of ER membrane length, plasma membrane length and ER/plasma membrane ratio using the EM pictures from (C). Immunofluorescence showing co-localisation of THEM6 and the ER marker calreticulin in 22rv1 cells. Scale bar represents 20 µm. Prediction of transmembrane domain in the sequence of the THEM6 protein. Topology prediction was performed using the TMHMM server (http://www.cbs.dtu.dk/services/TMHMM). Western blot analysis of THEM6 expression in cytoplasmic (cyto.), membrane/organelle (memb.) and nuclear fractions (nucl.) of 22rv1 cells. HSC70 and SP1 were used as cytoplasmic and nuclear-enriched markers, respectively. Enriched cellular components in THEM6-interacting proteins following THEM6 pulldown in T6 OE HEK293 cells. Western blot analysis of THEM6, AMFR, SEC61b and XPO1 expression in CRPC cells following THEM6 immunoprecipitation in CRPC cells. Western blot analysis of CALX and CALR expression in PCa cells following THEM6 silencing.Data information: Panels (B, H) Enrichment analysis was performed using the STRING database (http://string-db.org). Panel (D) Data are presented as mean values ± SD. Statistical analysis: (D) Unpaired t-test. Data reproducibility: Panel (D) n = 20 cells/condition. Panels (E, G, J) representative image from three independent biological experiments. Panel (I) representative image from two independent biological experiments.
Source data are available online for this figure.
Click here to expand this figure.
Figure EV3. THEM6 is an ER membrane protein
Representative electron microscopy pictures of THEM6 KO 22rv1 cells. Green and blue arrows point towards enlarged mitochondria and abnormal lysosomal structure, respectively. Scale bar represents 500 nm. Immunofluorescence showing co-localisation of THEM6 and the ER marker calreticulin in LNCaP AI cells. Scale bar represents 20 µm. Immunofluorescence showing distinct localisations for THEM6 and mitochondria in 22rv1 cells. Scale bar represents 20 µm. Western blot analysis of THEM6 expression in cytoplasmic (cyto.), membrane/organelle (memb.) and nuclear fractions (nucl.) of LNCaP AI cells. HSC70 was used as cytoplasmic-enriched marker. Western blot analysis of THEM6 and MYC-tag expression in HEK293 cells overexpressing a MYC-tagged version of THEM6 (T6 OE). HSC70 was used as a sample loading control. Enriched biological processes in THEM6-interacting proteins following THEM6 pulldown in T6 OE HEK293 cells.Data information: Panel (F) Enrichment analysis was performed using the STRING database (http://string-db.org). Data reproducibility: (B, C, D) representative image from 3 independent biological experiments. (E) representative image from two independent biological experiments.
Source data are available online for this figure.
THEM6 interacts with multiple ER membrane components involved in protein transportLipid metabolism and protein homeostasis are highly interconnected processes (Surma et al, 2013). In particular, ether lipids and plasmalogen derivatives play a key role in regulating membrane protein trafficking and homeostasis (Jiménez-Rojo & Riezman, 2019). Due to its localisation at the ER membrane and its role in regulating lipid balance, THEM6 might therefore be important for the maintenance of protein homeostasis in the ER. In line with this idea, pull-down experiments followed by MS analysis identified 152 proteins that significantly interacted with THEM6 in THEM6-overexpressing HEK-293 cells (FC = 10, P < 0.05, Fig EV3E and Table EV2). Most of the THEM6 interactors were located at the ER membrane, or at the interface between the ER and the nucleus (Fig 3H) and were mainly involved in protein transport (Fig EV3F). Among others, several exportins, importins, transportins and components of the oligosaccharyltransferase (OST) complex were identified as strong THEM6-interacting partners (Table EV2). We further validated the results of our interactomics by performing immunoprecipitation experiments in 22rv1 and LNCaP AI cells. We confirmed the direct interactions between endogenous THEM6 and several membrane proteins from different subcellular compartments (XPO1 at the outer nuclear membrane, AMFR and SEC61b in the ER) in both CRPC cell lines, thus indicating that the function of THEM6 in the ER might be conserved across different cell types (Fig 3I). Finally, we observed that acute THEM6 silencing in PCa cell lines led to a consistent decrease in the expression of the ER membrane-associated lectin calnexin (CALX) without affecting the levels of the soluble homolog calreticulin (CALR; Fig 3J). Taken together, these results suggest that THEM6 is important to maintain the integrity of the ER membrane and that THEM6 loss might preferentially affect the expression of membrane proteins.
THEM6 loss affects de novo sterol and FA synthesis in cancer cellsIn addition to protein trafficking, the ER is also the primary site for lipid and cholesterol synthesis. Therefore, we postulated that THEM6 depletion would impact these metabolic processes. Supporting this idea, our proteomic analysis of the 22rv1 THEM6-deficient cells highlighted a down-regulation of multiple proteins involved in sterol biosynthesis (Fig 4A). Sterol biosynthesis is of particular interest in the context of CRPC, as cholesterol serves as a precursor for de novo androgen synthesis and sustains ADT resistance (Chang et al, 2013; Patel et al, 2018). We first validated the decreased expression of several enzymes involved in sterol biosynthesis in 22rv1 THEM6 KO cells (Fig 4B). Similarly, RNAseq analysis of LNCaP AI cells highlighted a strong negative enrichment of a sterol homeostasis gene signature in the THEM6 KO cells (Fig 4C). Next, we functionally tested the effect of THEM6 loss on de novo sterol biosynthesis by incubating cancer cells with [U13C]-glucose and [U13C]-glutamine and following 13C incorporation into sterols using GC-MS. Surprisingly, we were not able to detect a significant proportion of labelled cholesterol in 22rv1 cells. Instead, these cells accumulated large amounts of de novo synthesised desmosterol, an immediate precursor of cholesterol (Figs 4D and E and EV4A). In agreement with the proteomic data, 22rv1 THEM6 KO cells accumulated significantly less 13C-enriched desmosterol than CTL cells (Fig 4D and E). In contrast to 22rv1 cells, the isogenic CWR22res cell line displayed a significant proportion of labelled cholesterol after incubation with [U13C]-glucose and [U13C]-glutamine. In this cell line, 13C-enrichment of cholesterol was also significantly reduced following THEM6 depletion (Figs 4F and EV4B). To validate these findings, we also assessed the metabolic impact of THEM6 loss in the highly lipogenic and steroidogenic breast cancer MCF-7 cell line (Fig 4G). In line with the results obtained with the PCa cell lines, we observed that THEM6 depletion in MCF-7 cells resulted in decreased levels of de novo synthesised cholesterol (Figs 4G and EV4C). Furthermore, using the Prostate Adenocarcinoma (PRAD) TCGA dataset, we found that THEM6 expression strongly correlated with the expression of several enzymes involved in the late steps (SQLE, LSS, DHCR7 and DHCR24, Fig 4H), but not in the early steps (mevalonate pathway, Fig EV4D), of sterol biosynthesis, suggesting that THEM6 also contributes to this pathway in PCa patients. Similarly, unbiased analysis of the PRAD TCGA dataset revealed that Acetyl-CoA Carboxylase (ACACA) and Fatty Acid Synthase (FASN), two regulatory enzymes of the fatty acid (FA) synthesis, were among the top up-regulated proteins in THEM6-enriched patient tumours (Fig 4I and Table EV3). Moreover, THEM6-deficient cells displayed decreased expression (LNCaP AI, Fig EV4E) or activation (22rv1, Fig EV4E) of the lipogenic transcription factor SREBP-1, pointing towards an altered lipid synthesis in these cells (Fig EV4E). Therefore, we assessed the contribution of THEM6 to FA synthesis by determining the relative proportions of 13C-labelled palmitic, oleic and stearic acids in the presence and absence of THEM6 (Figs 4J and K, and EV4F). Similar to sterols, THEM6 KO cells accumulated significantly less labelled FA when compared to CTL, indicating reduced FA synthesis in the absence of THEM6. Importantly, the negative impact of THEM6 KO on de novo FA synthesis was also confirmed using the MCF-7 cell line (Fig EV4G–I). Altogether, these results suggest that THEM6 expression is critical for the regulation of de novo lipid synthesis.

Figure 4. Loss of THEM6 affects de novo sterol and fatty acid synthesis
Proteomic analysis highlighting proteins associated with sterol biosynthetic pathway and significantly down-regulated in THEM6 KO 22rv1 cells when compared to CTL (P-value ≤ 0.05, FC = 1.3). RT–qPCR analysis of MVD, FDPS and DHCR7 expression in CTL and THEM6 KO 22rv1 cells. CASC3 was used as a normalising control. Gene set enrichment plots analysed from THEM6 KO LNCaP AI cells using the GOBP “Sterol homeostasis” gene set. Labelled desmosterol fraction derived from 13C-glucose and 13C-glutamine in CTL and THEM6 KO 22rv1 cells after 72 h of incubation. Relative isotopologue distribution of desmosterol in CTL and THEM6 KO 22rv1 cells after 72 h of incubation. Labelled cholesterol fraction derived from 13C-glucose and 13C-glutamine in CTL and THEM6 KO CWR22res cells after 72 h of incubation. Labelled cholesterol fraction derived from 13C-glucose and 13C-glutamine in CTL and THEM6 KO MCF-7 cells after 72 h of incubation. Pearson's correlation analysis of SQLE, LSS, DHCR7 and DHCR24 with THEM6 using the PRAD TCGA dataset. Results were obtained using the GEPIA website http://gepia.cancer-pku.cn/. Differential expression of ACACA in high and low THEM6 tumours according to the PRAD TCGA dataset. Labelled palmitic, oleic and stearic acid fractions derived from 13C-glucose and 13C-glutamine in CTL and THEM6 KO 22rv1 cells after 72 h of incubation. Relative isotopologue distribution of palmitic acid in CTL and THEM6 KO 22rv1 cells after 72 h of incubation.Data information: Panels (A, B, D, E, F, G, J, K) Data are presented as mean values ± SD. Panel (I) Centre line corresponds to median of data, top and bottom of box correspond to 90th and 10th percentile, respectively. Whiskers extend to adjacent values (minimum and maximum data points not considered outliers). Statistical analysis: (B, D, E, F, J, K) *P-value < 0.05 using one-way ANOVA with a Dunnett's multiple comparisons test. (G) *P-value < 0.05 using a two-tailed Student t-test. (I) two-tailed Mann–Whitney U-test. Data reproducibility: Panels (A, B) n = 3 independent biological experiments. Panels (D, E, F, G, J, K) n = 3 independent wells from the same cell culture. Panel (I) n = 225 tumours for THEM6 low and n = 121 tumours for THEM6 high.
Source data are available online for this figure.
Click here to expand this figure.
Figure EV4. Loss of THEM6 affects de novo sterol and FA synthesis
Total pool of desmosterol in CTL and THEM6 KO 22rv1 cells. Data extracted from Fig 4D and E. Total pool of cholesterol in CTL and THEM6 KO CWR22res cells. Data extracted from Fig 4F. Total pool of cholesterol in CTL and THEM6 KO MCF-7 cells. Data extracted from Fig 4G. Pearson's correlation analysis of HMGCS1, HMGCR, MVK, IDI1, FDPS, FDFT1, SC5D with THEM6 using the PRAD TCGA dataset. Results were obtained using the GEPIA website http://gepia.cancer-pku.cn/. Western blot analysis of SREBP1 (precursor and mature forms) expression in CTL and THEM6 KO CRPC cells. HSC70 was used as a sample loading control. Total pool of palmitic, oleic and stearic acid in CTL and THEM6 KO 22rv1 cells. Data extracted from Fig 4J and K. Labelled palmitic, oleic and stearic acid fractions derived from 13C-glucose and 13C-glutamine in CTL and THEM6 KO MCF-7 cells after 72 h of incubation. Relative isotopologue distribution of palmitic acid in CTL and THEM6 KO MCF-7 cells after 72 h of incubation. Total pool of palmitic, oleic and stearic acid in CTL and THEM6 KO 22rv1 cells. Data extracted from (G, H).Data information: Panels (A, B, C, F, G, H, I) Data are presented as mean values ± SD. Statistical analysis: (A, B, F) One-way ANOVA with a Dunnett's multiple comparisons test. (C, G, H, I) two-tailed Student t-test. Data reproducibility: (A, B, C, F, G, H, I) n = 3 independent wells from the same cell culture. (E) representative image from three independent biological experiments.
Source data are available online for this figure.
THEM6 is required to trigger ATF4 induction in CRPC cellsPerturbation of ER homeostasis results in the activation of a tightly regulated stress response programme, the unfolded protein response (UPR), in order to rapidly alleviate ER stress (Hetz et al, 2020). Enrichment pathway analysis of the THEM6-deficient 22rv1 cells highlighted “Response to ER stress” as the main pathway regulated in absence of THEM6 (Fig 5A), with 17 proteins referenced in this pathway significantly down-regulated in both KO clones (FC = 1.3, P < 0.05, Fig 5B and Table EV1). Interestingly, BIP (HSPA5), the main regulator of the UPR, was identified among the proteins significantly down-regulated in 22rv1 THEM6 KO cells (Fig 5B), and we confirmed this result by WB (Fig 5C). Impaired UPR activation in THEM6-deficient cells was further evidenced by decreased levels of the UPR effectors XBP1s (spliced isoform of XBP1), ATF4 and CHOP (DDIT3; Fig 5C). As a consequence, THEM6 KO significantly sensitised CRPC cells to prolonged ER stress, caused by chronic tunicamycin treatment (Fig 5D).

Figure 5. THEM6-mediated lipid remodelling is required for UPR activation
Enriched biological processes commonly down-regulated in THEM6 KO 22rv1 cells (two clones) when compared to CTL. Proteomic analysis highlighting proteins associated with the ER stress response significantly down-regulated in THEM6 KO 22rv1 cells when compared to CTL (P-value ≤ 0.05, FC = 1.3). Western blot analysis of BIP, XBP1s, ATF4, CHOP and THEM6 expression in CTL and THEM6 KO 22rv1 cells. Proliferation of CTL and THEM6 KO CRPC cells treated with tunicamycin (2.5 µg/ml) for 72 h. Cell count is normalised to initial number of cells at T0. Proteomic analysis highlighting ATF4 targets significantly down-regulated in THEM6 KO LNCaP AI cells when compared to CTL (P-value ≤ 0.05, FC = 1.3). Western blot analysis of ATF4 and THEM6 expression in CTL and THEM6 KO LNCaP AI cells. Western blot analysis of ATF4, CHOP and THEM6 expression in PCa cells following THEM6 silencing. Differential expression of EIF4G1 and ASNS in high and low THEM6 tumours according to the PRAD TCGA dataset. Western blot analysis of ATF4 and CHOP expression in CTL and THEM6 KO 22rv1 cells treated with palmitic acid (200 µM) for 48 h. Western blot analysis of ATF4 and CHOP expression in CTL and THEM6 KO LNCaP AI cells treated with palmitic acid (200 µM) or hexadecylglycerol (50 µM) for 48 h.Data information: Panels (C, F, G, I, J) HSC70 was used as a sample loading control. Panels (B, D, E) Data are presented as mean values ± SD. Panel (H) Centre line corresponds to median of data, top and bottom of box correspond to 90th and 10th percentile, respectively. Whiskers extend to adjacent values (minimum and maximum data points not considered outliers). Statistical analysis: (D) One-way ANOVA with a Dunnett's multiple comparisons test. (H) two-tailed Mann–Whitney U-test. Data reproducibility: Panels (C, F, G, I, J) representative image from three independent biological experiments. Panels (B, D, E) n = 3 independent biological experiments. Panel (H) n = 225 tumours for THEM6 low and n = 121 tumours for THEM6 high.
Source data are available online for this figure.
Proteomic analysis of THEM6 KO in LNCaP AI cells also highlighted ER perturbation as the main consequence of THEM6 depletion (Fig EV5A and Table EV4). Of note, THEM6 KO in this cell type led to an accumulation of several ER chaperones, including BIP, and did not consistently affect XBP1s levels (Fig EV5B). In contrast with the IRE1a-XBP1s signalling, the proteomic analysis highlighted many ATF4 targets that were down-regulated in LNCaP AI THEM6 KO cells (Fig 5E), suggesting that THEM6 might be particularly important for ATF4 activation in PCa. In line with this idea, we found that ATF4 levels were strongly reduced in THEM6-deficient LNCaP AI cells (Fig 5F) and that both ATF4 and CHOP were also decreased following transient THEM6 silencing in multiple PCa cell lines (Fig
留言 (0)