Antibodies and reagents
Anti-IκBα was from Cell Signaling Technology (MA, USA). Anti-β-actin were purchased from Sigma-Aldrich (Sigma-Aldrich, MO, USA). Anti-TRIP6 was purchased from Santa Cruz Biotechnology (Santa Cruz, CA, USA). Anti-CD45, anti-CD11b, anti-CD4, anti-F4/80, and anti-B220 were from BD Bioscience (CA, USA). DSS was purchased from MP Biomedicals (USA). LIVE/DEAD™ Fixable Violet Dead Cell Stain Kit was from Invitrogen (USA).
Plasmid constructs
Expression construct for Flag-TRAF6 was kindly provided by Dr. Ashley Mansell (Monash Institute of Medical Research, Australia). TRAF6 and TRIP6 were generated by PCR and inserted into the pEGFP-C1 and pCMV-Myc vectors, respectively. Cells were transiently transfected with these plasmids using Lipofectamine 2000 (Invitrogen).
Mice
TRIP6+/+ and TRIP6−/− mice were obtained from Cyagen (Taicang, Jiangsu, China) and were housed under specific pathogen-free conditions with a 12 h light/dark cycle and free access to standard food and water at the Laboratory Animal Center in Soochow University (China). The Animal Care and Use Committee of Soochow University approved all animal studies.
Tissue collection and assessment
Tissue samples collected from TRIP6+/+ and TRIP6−/− mice for analysis included the colon, mesenteric lymph nodes, spleen, and peripheral lymph nodes. Spleen weight, colon length, and the numbers of cells in the mesenteric and peripheral lymph nodes were quantified.
DSS-induced colitis modelling
Mice (8-10 weeks old) were administered 2.5% DSS in their drinking water for 7 days, followed by a 6-day recovery period during which they were administered normal water. All mice were weighed daily, and were euthanized at experimentally appropriate time points. Colon tissue samples were then collected, and colitis severity was assessed by staining paraffin-embedded colon sections with hematoxylin and eosin (H&E), with inflammation and crypt damage being quantified and given a score ranging from 0 to 4 as indicated in Supplemental Table 1.
Histological staining
H&E staining was performed as in previous reports [19].
qPCR
Trizol LS (Invitrogen) was used to extract total RNA from appropriate samples, after which a RevertAid™ First Strand cDNA Synthesis Kit (Fermentas) was used to synthesize cDNA. qPCR was then performed with a SYBR Green Power Master Mix based upon provided instructions (Applied Biosystems), using the primers listed in Supplemental Table 2.
Western blotting
Samples of full-thickness colon tissue were homogenized in a 1 mL volume of cell lysis buffer supplemented with a protease inhibitor cocktail (Roche, Mannhein, Germany) for 30 min on ice, after which homogenates were centrifuged for 20 min at 13,000 xg at 4 °C. Equal amounts of protein were then separated via 10% SDS-PAGE and transferred to PVDF membranes, after which protein expression was detected using appropriate antibodies, with signaling being visualized with an ECL system.
Immunoprecipitation and ubiquitination assay
Cells were lysed in a buffer containing Tris-HCl (20 mM, pH 7.4), EDTA (10 mM), NaCl (100 mM), and IGEPAL (1%). Whole-cell lysates were subjected to immunoprecipitation with the indicated antibodies using protein A/G beads (GE Healthcare). For the detection of TRAF6 ubiquitination, 10 mM N-ethylmaleimide was included in the lysis buffer.
Luciferase reporter assay
An NF-κB reporter plasmid with an NF-κB response element was transfected into RAW264.7 cells using Lipofectamine 2000 (Invitrogen). After 24 h, the cells were treated with LPS (10 ng/ml) for 12 h. Cells were lysed and reporter activity was analyzed with the Luciferase Reporter Assay system (Promega). Each transfection also included β-gal as a normalization control.
ELISAs
TNFα and IL-6 levels were assessed using mouse-specific ELISA kits (R&D Systems) based on provided directions.
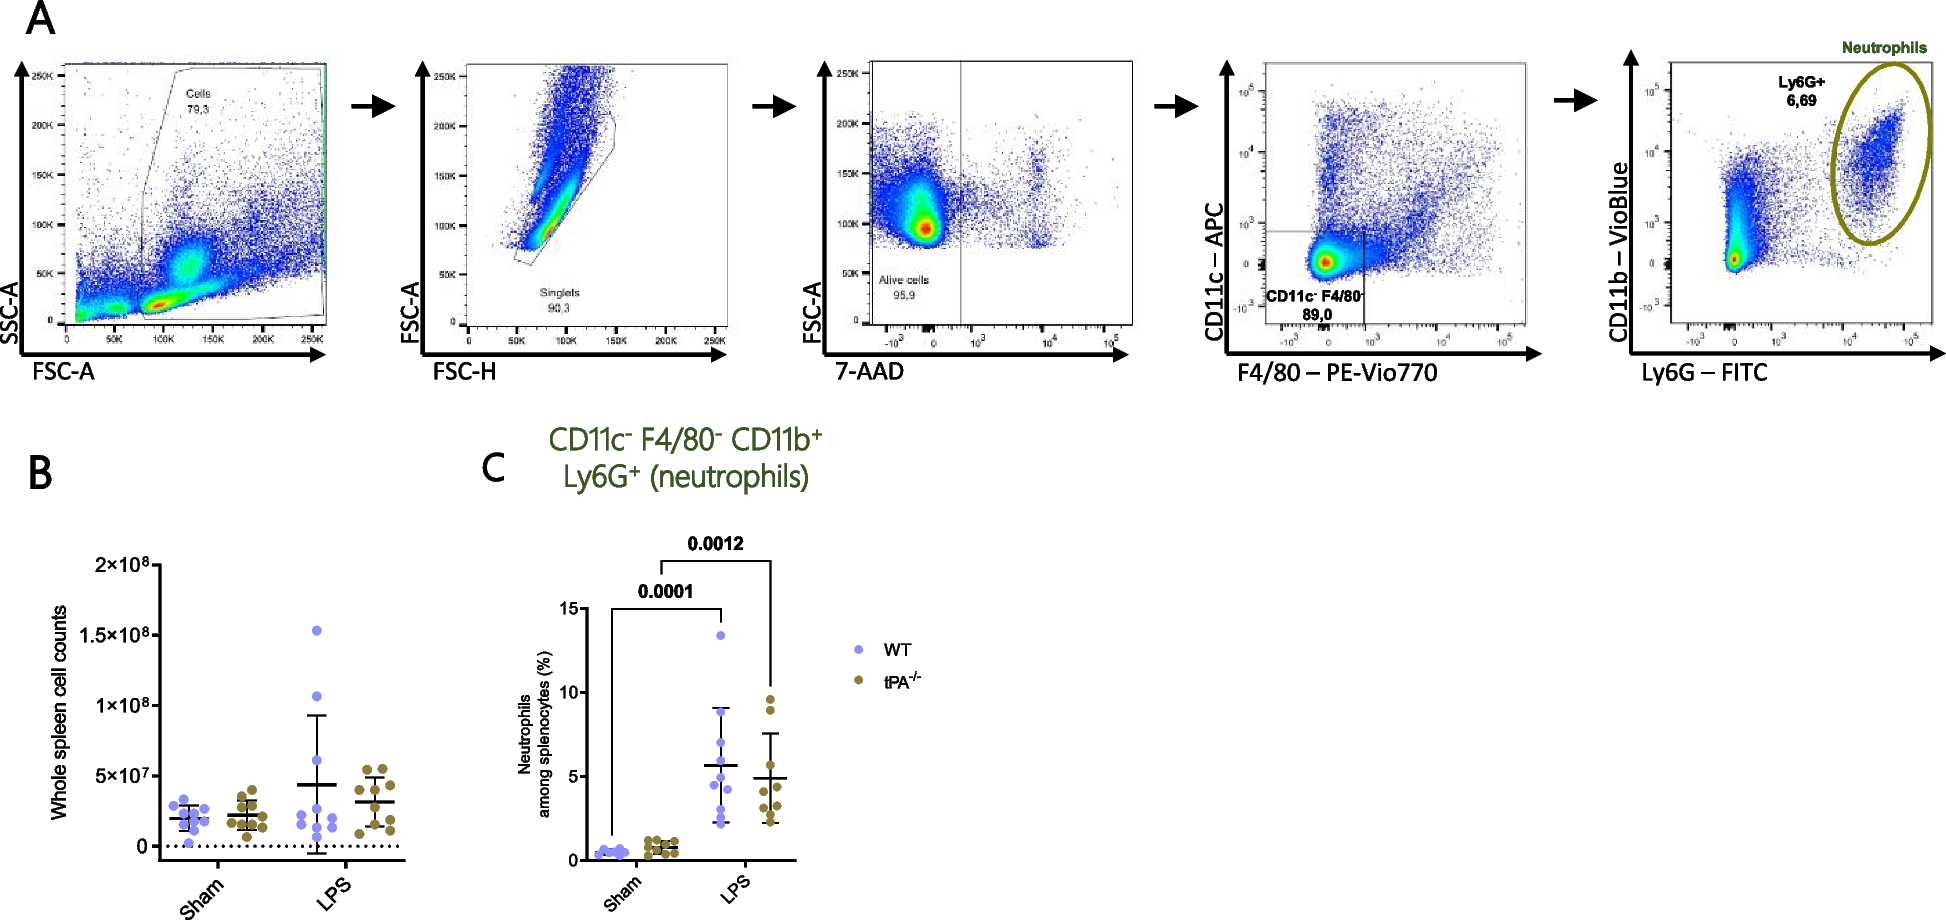
Flow cytometry
Colon tissue samples were isolated, rinsed three times using cold PBS, and digested for 45 min at 37 °C in DMEM containing 2% FBS, collagenase IV (1 mg/mL; Sigma-Aldrich), and DNase I (10 U/mL; Roche). The resultant digest was then passed through a 70-μm mesh filter to generate a single-cell suspension, which was stained with LIVE/DEAD, anti-CD45, anti-CD11b, anti-F4/80, anti-CD4, anti-CD8, and anti-B220 prior to analysis using a BD LSR Fortessa™ Flow Cytometer. All data were analyzed using NovoExpress or FlowJo X (TreeStar, CA, USA).
Statistical analysis
Data are given as means±SD. Statistical significance was analyzed using Student’s t-tests (unpaired, two-tailed). Experiments were repeated in triplicate and analyzed using Prism 5.03 software (GraphPad Software), with p < 0.05 as the significance threshold (*p < 0.05; **p < 0.01; ***p < 0.001; ns, not significant).


留言 (0)