
記住我

Lung cancer remains the leading cause of cancer-related mortality worldwide.1 Non-small cell lung cancer (NSCLC) is the most prevalent subtype of lung cancer, accounting for approximately 85% of diagnosed cases.2 Despite advances in early detection and multimodal treatment, the overall survival rate of NSCLC is still very low, particularly in patients with advanced/metastatic NSCLC.1, 3 Hence, increasing our understanding of the molecular basis of NSCLC pathogenesis will provide a novel opportunity to design better targeted therapies.
Circular RNAs (circRNAs) are naturally occurring RNA circles that are generated by the back-splicing process.4 Recent studies have suggested the implication of circRNAs in the pathogenesis of NSCLC.5, 6 Moreover, some circRNAs have been shown to involve the post-transcriptional regulation of gene expression in NSCLC by functioning as microRNA (miRNA) inhibitors.6 For example, Chen et al. identified that circ_100 146 worked as a strong tumor promoter in NSCLC by directly targeting miR-615-5p and miR-361-3p.7 Chi et al. demonstrated that circ_0014130 functioned as a contributor in the development of NSCLC by reducing miR-600 activity.8 Wan and colleagues uncovered that circ_0020123 contributed to NSCLC development by operating as a miR-488-3p inhibitor.9 As for circ_0026134, formed by the back-splicing of tubulin alpha 1c (TUBA1C) mRNA, is highly expressed in NSCLC and plays an oncogenic role in this disease.10, 11 However, our understanding of the molecular determinants underlying the oncogenic property of circ_0026134 has remained incomplete.
Aberrant expression of miRNAs has been reported to impact lung carcinogenesis.12, 13 For example, miR-21 and miR-23a have been identified as potential diagnostic biomarkers for NSCLC.14 MiR-422a is a strong antitumor factor in NSCLC by targeting sulfatase 2.15 A recent study has also identified miR-3619-5p as a tumor suppressor in NSCLC.16 Moreover, miR-3619-5p is involved in the regulation of circRNA forkhead box M1 (circFOXM1) in lung cancer progression.17 Nevertheless, whether miR-3619-5p is a functionally important mediator of circ_0026134 in promoting NSCLC progression is as yet undefined. In this study, we used human H520 and A549 NSCLC cells in order to explore the molecular basis underlying the regulation of circ_0026134.
METHODS Human subject study and cell cultureThe study cohort comprised 53 patients with primary NSCLC at The Central Hospital of Enshi Tujia and Miao Autonomous Prefecture. All patients provided their written informed consent. Use of human subjects was approved by the Ethics Committee of The Central Hospital of Enshi Tujia and Miao Autonomous Prefecture. The clinicopathological features of these patients are provided in Table 1. Fifty-three NSCLC tissues and 35 adjacent healthy lung tissues were obtained by surgery before treatment and used to investigate circ_0026134, miR-3619-5p, and chromatin assembly factor 1 subunit B axis (CHAF1B) expression.
TABLE 1. Association between clinicopathological features and circ_026134 expression Clinical parameter Low-circ_0026134 (n = 26) High-circ_0026134 (n = 27) p-value Age (years) <60 13 12 0.445 >60 13 15 Gender Male 11 13 0.388 Female 15 14 TNM stages I and II 10 7 0.020* III and IV 16 20 Size ≤5 cm 6 9 0.061 >5 cm 20 18 Invasion depth T1 and T2 10 19 0.021* T3 and T4 16 8 Lymphatic metastasis Yes 17 7 0.009* No 9 20 Distant metastasis Yes 13 10 0.012* No 13 17Human bronchial epithelial cells (BEAS-2B) and NSCLC cells (H520 and A549) were purchased from Procell (Wuhan, China) and propagated at 37°C using standard growth medium provided by Procell in a humidified incubator with 5% CO2.
Lentivirus transduction and transient transfection of cellsLentiviral vectors coding shRNA-circ_0026134 (sh-circ_0026134) or NONTARGET shRNA (sh-NC) were obtained from Geneseed (Guangzhou, China). To produce stable circ_0026134 knockdown cells, these lentiviral vectors were transfected into the 293T packaging cells (Procell). Virus particles were harvested and then used to transduce H520 and A549 cells in the presence of 8 μg/ml polybrene (Yeasen). The cells with positive transduction were selected by puromycin (Yeasen) for 10 days. MiR-3619-5p mimic (5′-UCAGCAGGCAGGCUGGUGCAGC-3′, Ribobio) and inhibitor (anti-miR-3619-5p, 5′-GCUGCACCAGCCUGCCUGCUGA-3′, Ribobio) were chemically enhanced oligonucleotides designed to alter the expression of miR-3619-5p. The NONTARGET mimic (miR-NC mimic, 5′-CGAUCGCAUCAGCAUCGAUUGC-3′, Ribobio) and inhibitor (anti-NC, 5′-CAGUACUUUUGUGUAGUACAA-3′, Ribobio) were scrambled control oligonucleotides. CHAF1B overexpressing plasmid (pcDNA-CHAF1B) was generated by cloning human CHAF1B sequence into the pcDNA3.1 vector (Genomeditech) opened with Not I and Xba I, and nonspecific pcDNA vector was used as a control. H520 and A549 cells of ~50% confluence were transiently transfected with 50 nM of the indicated oligonucleotide and 200 ng of plasmid using lipofectamine 2000 (Life Technologies) as per the manufacturer's guidelines. The cells were harvested after 48 h for further exploration.
qRT-PCRTo measure circ_0026134 and CHAF1B levels, 5 μg of RNA extracted from cells and tissues with RNA STAT-60 reagent (Biogenesis) was reverse-transcribed into cDNA using ReverTra Ace (Toyobo). Then, 10 μl of cDNA was mixed with SYBR qPCR Mix (Toyobo) and designed primers (Table S1) in a final volume of 25 μl, and cDNA amplification by qRT-PCR was done on a Roche PCR system (Roche Diagnostic). To quantify miR-3619-5p expression, 2 μg of RNA was reverse-transcribed into cDNA with NCode VILO miRNA cDNA Synthesis Kit (Life Technologies) and then analyzed using qRT-PCR with SYBR qPCR Mix and the specific primer (Table S1). Results were expressed using the 2-ΔΔCt method and normalized to glyceraldehyde-3-phosphate dehydrogenase (GAPDH) or U6.
Colony formation assayAbout 150 treated cells were seeded into each well of 6-well plates and were incubated for 2 weeks at 37°C. The wells were stained with 0.2% crystal violet (Yeasen) for 15 min for colony visualization. The number of colonies containing 50 cells or more was counted using Image J software (National Institutes of Health).
Transwell migration and invasion assaysIn these assays, we used 24-Transwell inserts with noncoated membranes (8 μm pore size, Millipore) for migration analysis and matrigel-precoated insert membranes (Millipore) for invasion analysis. Treated cells were plated into the top chamber at a density of 2 × 10⁴ cells per well for migration analyses and 1 × 10⁵ cells per well for invasion analyses. The lower chamber was filled with standard growth medium. Twenty-four hours later, the cells on the lower surface were stained with 0.2% crystal violet (Yeasen). Six visual fields of each insert were randomly selected under an inverted microscope (Leica) at 100× magnification, and migrated or invaded cell population was assessed by Image J software.
Flow cytometry for cell apoptosisAbout 1 × 10⁶ treated cells were stained with Annexin V-fluorescein isothiocyanate (FITC) and propidium iodide (PI) according to the manufacturer's protocols (Annexin V-FITC/PI Detection Kit, BD Bioscience). The apoptotic cells were defined as early (Annexin V+/PI−) and late (Annexin V+/PI+) apoptotic cells.18 The data were analyzed by a flow cytometer (BD Bioscience) and expressed as the percentage of total cells.
Measurement of glucose consumption and lactate productionThese assays were performed using the colorimetric glucose uptake assay kit and L-lactate assay kit, respectively, as per the manufacturer's recommendations (Abcam).
Western blotCells and tissues were homogenized in RIPA lysis buffer (Life Technologies) based on the accompanying instructions. Equivalent amounts of protein were resolved by SDS polyacrylamide gel electrophoresis and immunoblotted by a standard protocol.19 The primary antibodies including anti-Ki-67 (1:500; sc-23 900), antimatrix metalloproteinase-9 (anti-MMP-9, 1:500; sc-393 859), anti-B cell lymphoma protein 2-associated X (anti-Bax, 1:1000; sc-7480), anti-CHAF1B (1:500; sc-56 646) and anti-GAPDH (1:1000; sc-47 724, all from Cell Signaling Technology), IgG secondary antibody labeled with horseradish peroxidase (1:1000; sc-2748, Cell Signaling Technology), and the enhanced chemiluminescence (Amersham Biosciences) were used.
Bioinformatics and dual-luciferase reporter assayThe targeted miRNAs of circ_0026134 and the molecular targets of miR-3619-5p were searched using the online starBase v.3 database at http://starbase.sysu.edu.cn/. The segments of circ_0026134 and CHAF1B 3′UTR encompassing the miR-3619-5p-pairing sequence or the mutated binding region were individually cloned into the pmirGLO vector (Promega). Subconfluent H520 and A549 cells were transfected using lipofectamine 2000 with 200 ng of the indicated reporter construct and 50 nM of miR-3619-5p mimic or mimic control. After 24 h, the cells were subjected to luciferase assays using the dual-luciferase reporter assay system as recommended by the manufacturers (Promega).
Xenograft model studiesApproval for the animal experiments was obtained from the Animal Care and Use Committee of The Central Hospital of Enshi Tujia and Miao Autonomous Prefecture and all animal procedures followed international guidelines. sh-NC- or sh-circ_0026134-transduced H520 cells (5 × 10⁶ cells) were subcutaneously injected into male BALB/c mice aged 6 weeks (Vital River Laboratory; n = 6 per group). The developing tumors were periodically measured with a digital caliper and tumor volume was determined as follows: volume = length × width2 × 0.5. On day 40 after cell injection, the mice were sacrificed and the xenograft tumors were excised for weight measurement and gene expression analysis by qRT-PCR and western blot. Immunohistochemistry analysis for Ki-67 level measurement in the xenograft tumors was done as described.20 Briefly, the tissue paraffin sections were incubated with Ki-67 antibody (1:100; ab15580, Abcam) and biotinylated anti-rabbit secondary antibody (1:1000; ab15580, Abcam), followed by the incubation with the DAB detection kit as described by the manufacturers (Abcam).
Statistical analysisAt least three independent biological replicates for all assays were performed unless otherwise noted. Mean and standard deviation (SD) are presented as representative values for data in the figures. The Mann–Whitney U test was used to test the differences of gene expression in NSCLC tissues. Analysis of variance (ANOVA) with Tukey's post hoc test and Student's t-test were used to evaluate statistical significance. The association between circ_026134 expression and clinicopathological features of NSCLC patients was analyzed by chi-square test. Expression correlations among miR-3619-5p, circ_0026134, and CHAF1B mRNA in NSCLC tissues were determined by the Pearson's correlation coefficient. Parameters associated with survival were analyzed and a multivariate Cox analysis was employed to determine the influence of circ_0026134, miR-3619-5p, and CHAF1B expression on overall survival. Significance values were indicated as *p < 0.05, **p < 0.01 and ***p < 0.001.
RESULTS Circ_0026134 level was upregulated in NSCLC tissues and cellsFirst, we used qRT-PCR to determine the expression of circ_0026134 in NSCLC tissues and cells. Remarkably, circ_0026134 level was increased in NSCLC tissues compared with the normal controls (Figure 1(a)). Moreover, circ_0026134 was significantly overexpressed in NSCLC cell lines compared to the normal BEAS-2B cells (Figure 1(b)). Additionally, circ_026134 expression was closely associated with TNM stage, invasion depth, lymphatic metastasis and distant metastasis of the tumors (Table 1). Moreover, using univariate and multivariate Cox analysis, circ_026134 expression was significantly associated with overall survival of these patients (Table 2).

Circ_0026134 was overexpressed in NSCLC tissues and cell lines. Relative circ_0026134 level by qRT-PCR in 53 NSCLC tissues and 35 normal lung tissues (a), BEAS-2B, H520 and A549 cells (b). ***p < 0.001
TABLE 2. Univariate and multivariate Cox analysis of circ_0026134, miR-3619-5p and CHAF1B expression associated with overall survival in patients with NSCLC (n = 53) Univariate analysis Multivariate analysis HR 95% CI p-value HR 95% CI p-value Age 0.916 0.526 –1.596 0.856 Gender 1.297 0.856–1.965 0.639 TNM stages 2.131 1.263–3.596 0.011* 0.914 1.212–3.023 0.036* Size 1.104 0.623–1.956 0.237 Invasion depth 2.260 1.325–3.856 0.020* 1.855 1.063–3.236 0.021* Lymphatic metastasis 2.329 1.685–3.216 0.006* 1.575 0.965–2.569 0.045* Distant metastasis 2.125 1.523–2.965 0.012* 1.783 1.256–2.532 0.033* circ_0026134 expression 2.336 1.263–4.321 0.014* 2.229 1.135–4.023 0.027* miR-3619-5p expression 2.252 1.352–3.751 0.032* 1.792 0.965–3.3.9 0.032* CHAF1B expression 2.474 1.521–4.023 0.012* 1.981 1.115–3.521 0.019* Reduced expression of circ_0026134 hampered cell colony formation, migration, invasion, glycolysis and enhanced apoptosis in vitroTo gain insight into the biological role of circ_0026134 in NSCLC development, we carried out loss-of-function analyses with circ_0026134-shRNA (sh-circ_0026134). In contrast to the sh-NC control, the transduction of sh-circ_0026134 caused a prominent reduction in the expression of circ_0026134 in H520 and A549 cells (Figure 2(a)). Remarkably, the reduced level of circ_0026134 inhibited cell colony formation (Figure 2(b)), migration (Figure 2(c)), and invasion (Figure 2(d)), as well as promoting cell apoptosis (Figure 2(e)) in H520 and A549 cells. Furthermore, the reduced expression of circ_0026134 led to a significant decrease in the levels of proliferating marker Ki-67 and invasion-related protein MMP-9 and a remarkable increase in pro-apoptotic protein Bax expression in the two NSCLC cell lines (Figure 2(f)). Additionally, the downregulation of circ_0026134 inhibited glucose consumption and lactate production in H520 and A549 cells (Figure 2(g),(h)), indicating that circ_0026134 knockdown suppressed cell glycolysis.

The downregulation of circ_0026134 hampered cell colony formation, migration, invasion, glycolysis and enhanced apoptosis in vitro. Relative circ_0026134 expression by qRT-PCR (a), cell colony formation by colony formation assay (b), cell migration and invasion by transwell assay (c and d), cell apoptosis by flow cytometry (e), Ki-67, MMP-9 and Bax levels by western blot (f), glucose consumption and lactate production using the assay kits (g and h) in sh-NC-infected or sh-circ_0026134-transduced H520 and A549 cells. ***p < 0.001
Circ_0026134 directly targeted miR-3619-5pTo elucidate the mechanism by which circ_0026134 regulates NSCLC cell functional properties in vitro, we used the online starBase v.3 database to help identify its targeted miRNAs. The predicted data revealed that circ_0026134 harbors a putative region that matches the seed sequence of miR-3619-5p (Figure 3(a)). Interestingly, by contrast, miR-3619-5p was remarkably underexpressed in NSCLC tissues and cells (Figure 3(b),(c)). Moreover, a strong inverse correlation between circ_0026134 and miR-3619-5p expression in NSCLC tissues (Figure S1A) existed. Additionally, using univariate and multivariate Cox analysis, miR-3619-5p expression was strongly associated with overall survival of these patients (Table 2). To confirm the direct relationship between circ_0026134 and miR-3619-5p, we constructed circ_0026134 wild-type (circ_0026134 wt) and mutant-type (circ_0026134 mut) luciferase reporters and analyzed them by luciferase activity. The transfection of miR-3619-5p mimic significantly reduced the luciferase activity of circ_0026134 wt but barely affected the luciferase activity of circ_0026134 mut (Figure 3(d),(e)). Importantly, the reduced expression of circ_0026134 led to a striking upregulation in the level of endogenous miR-3619-5p in H520 and A549 cells (Figure 3(f)).

Circ_0026134 directly targeted miR-3619-5p. (a) Schematic of the putative miR-3619-5p-binding sequence within circ_0026134 and the mutant in the seed region. Relative miR-3619-5p level by qRT-PCR in 53 NSCLC tissues and 35 normal lung tissues (b), BEAS-2B, H520 and A549 cells (c). (d and e) Dual-luciferase reporter assays in H520 and A549 cells. (f) Relative level of miR-3619-5p by qRT-PCR in sh-NC-infected or sh-circ_0026134-transduced H520 and A549 cells. ***p < 0.001
Enforced expression of miR-3619-5p inhibited cell colony formation, migration, invasion, glycolysis and promoted apoptosis in vitroTo validate the functional role of miR-3619-5p in NSCLC progression, we then overexpressed miR-3619-5p in H520 and A549 cells, which expressed low levels of miR-3619-5p. Transient transfection of miR-3619-5p mimic, but not the miR-NC control, remarkably increased the level of miR-3619-5p in H520 and A549 cells (Figure 4(a)). In contrast, the enforced expression of miR-3619-5p significantly inhibited cell colony formation (Figure 4(b)), migration (Figure 4(c)), invasion (Figure 4(d)) and promoted cell apoptosis (Figure 4(e)). Moreover, the enforced level of miR-3619-5p reduced Ki-67 and MMP-9 expression and elevated Bax level in H520 and A549 cells (Figure 4(f)). Furthermore, the enforced expression of miR-3619-5p impeded the glycolysis of H520 and A549 cells (Figure 4(g),(h)).

The overexpression of miR-3619-5p repressed cell colony formation, migration, invasion, glycolysis and promoted apoptosis in vitro. H520 and A549 cells were transiently transfected with miR-NC mimic or miR-3619-5p mimic. (a) qRT-PCR for miR-3619-5p expression in transfected cells. (b) Colony formation assay for cell colony formation. (c and d) Transwell assay for cell migration and invasion. (e) Flow cytometry for cell apoptosis. (f) Western blot for Ki-67, MMP-9 and Bax levels in transfected cells. (g and h) Glucose consumption and lactate production using the assay kits. ***p < 0.001
Circ_0026134 functioned as a regulator of CHAF1B expression by miR-3619-5pTo identify the downstream targets of miR-3619-5p, we used the starBase v.3 database based on the presence of human 3′UTRs. Among these candidates, we selected six genes that were associated with the pathogenesis of NSCLC. Intriguingly, we found that CHAF1B was the most significantly upregulated gene in miR-3619-5p-silenced H520 and A549 cells (Figure S2). We thus selected CHAF1B for further investigation. The predicted data showed a putative target sequence for miR-3619-5p within the 3′UTR of CHAF1B (Figure 5(a)). The data of qRT-PCR and western blot revealed that CHAF1B expression was significantly upregulated at both mRNA and protein in NSCLC tissues and cells compared with the corresponding negative controls (Figure 5(b)–(e)). Moreover, CHAF1B mRNA level was inversely correlated with miR-3619-5p expression in NSCLC tissues (Figure 1(b)). Using univariate and multivariate Cox analysis, CHAF1B level was markedly associated with overall survival of these patients (Table 2). To confirm whether CHAF1B was a direct target of miR-3619-5p, we performed dual-luciferase reporter assays. When we cloned the CHAF1B 3′UTR segment harboring the targeted sequence for miR-3619-5p into a luciferase reporter, the cotransfection of this reporter and miR-3619-5p mimic into the two NSCLC cell lines produced lower luciferase activity than cells cotransfected with miR-NC control (Figure 5(f),(g)). However, when the target sequence was mutated, the suppression of miR-3619-5p was completely abolished (Figure 5(f),(g)). We then asked whether miR-3619-5p regulated CHAF1B expression in H520 and A549 cells. The transfection efficiency of anti-miR-3619-5p was measured by qRT-PCR (Figure 5(h)). As expected, the reduced expression of miR-3619-5p caused a significant increase in the level of CHAF1B protein in H520 and A549 cells (Figure 5(i)).

Circ_0026134 regulated CHAF1B expression through miR-3619-5p. (a) Schematic of the targeted sequence for miR-3619-5p within the 3′UTR of CHAF1B mRNA and the mutation of the target region. CHAF1B mRNA and protein levels in 53 NSCLC tissues and 35 normal lung tissues (b and c), BEAS-2B, H520 and A549 cells (d and e). (f and g) Dual-luciferase reporter assays in H520 and A549 cells. Relative miR-3619-5p expression by qRT-PCR (h) and CHAF1B protein level by western blot (i) in H520 and A549 cells transfected with anti-NC or anti-miR-3619-5p. (j and k) Relative CHAF1B protein level by western blot in sh-NC-infected or sh-circ_0026134-transducted H520 and A549 cells transfected with anti-NC or anti-miR-3619-5p. **p < 0.01 or ***p < 0.001
Additionally, we observed a strong positive correlation between CHAF1B mRNA and circ_0026134 levels in NSCLC tissues (Figure S1C). Next, we assessed whether circ_0026134 could affect CHAF1B expression. As expected, the downregulation of circ_0026134 led to a clear decrease in the level of CHAF1B protein, and this effect was significantly abrogated by anti-miR-3619-5p introduction (Figure 5(j),(k)).
CHAF1B was a functionally important effector of circ_0026134 in regulating cell colony formation, migration, invasion, glycolysis and apoptosis in vitroTo elucidate whether CHAF1B was a functionally downstream effector of circ_0026134 in regulating NSCLC cell functional behaviors, we increased CHAF1B expression in circ_0026134-silenced H520 and A549 cells. The transfection efficiency of CHAF1B overexpressing plasmid was gauged by qRT-PCR (Figure 6(a)). Indeed, the overexpression of CHAF1B significantly abrogated sh-circ_0026134-mediated anti-colony formation (Figures 6(b),(c), and S3A), antimigration (Figure 6(d),(e), and S3B), anti-invasion (Figures 6(f),(g), and S3C), and proapoptosis (Figures 6(h),(i), and S3D) effects. Furthermore, the increased expression of CHAF1B dramatically abolished the impact of circ_0026134 silencing on Ki-67, MMP-9 and Bax levels in H520 and A549 cells (Figure 6(j),(k)). Additionally, the upregulation of CHAF1B abolished circ_0026134 silencing-mediated inhibition of cell glycolysis of H520 and A549 cells (Figure 6(l)–(o)).

The knockdown of circ_0026134 regulated NSCLC cell behaviors in vitro by downregulating CHAF1B. (a) The level of CHAF1B protein by western blot in H520 and A549 cells transfected with pcDNA or pcDNA-CHAF1B. sh-NC-infected or sh-circ_0026134-transduced H520 and A549 cells were transfected with or without pcDNA or pcDNA-CHAF1B, followed by the determination of cell colony formation by colony formation assay (b and c), cell migration and invasion by transwell assay (d–g), cell apoptosis by flow cytometry (h and i), Ki-67, MMP-9 and Bax levels by western blot (j and k), glucose consumption and lactate production using the assay kits (l–o). **p < 0.01 or ***p < 0.001
Reduced expression of circ_0026134 diminished tumor growth in vivoFurther, we decided to investigate the role of circ_0026134 in tumor growth in vivo by implanting sh-NC-infected or sh-circ_0026134-transduced H520 cells into the right flanks of BALB/c nude mice. As shown in Figure 7(a),(b), sh-circ_0026134-transduced cells produced markedly smaller tumors than the same cells transduced with sh-NC controls. This result was also confirmed by fewer cells stained for Ki-67 staining in sh-circ_0026134-transduced H520 tumors (Figure 7(c)). Moreover, qRT-PCR and western blot analyses of the tumor tissues showed that circ_0026134 and CHAF1B protein levels were significantly downregulated and miR-3619-5p was strongly upregulated in sh-circ_0026134-transduced H520 tumors compared with the controls (Figure 7(d)–(f)).

The downregulation of circ_0026134 weakened tumor growth in vivo. (a) Graphic representation of tumor volume of mice injected with sh-NC-infected or sh-circ_0026134-transduced H520 cells. (b) Images and the average weight of the xenograft tumors formed by sh-NC-infected or sh-circ_0026134-transduced H520 cells, on 40 days after implantation. Ki-67 level by immunohistochemistry assay (c), relative expression of circ_0026134 (d) and miR-3619-5p (e) by qRT-PCR and CHAF1B protein level by western blot (f) in the tumor tissues derived from sh-NC-infected or sh-circ_0026134-transduced H520 cells, 40 days after implantation. **p < 0.01 or ***p < 0.001
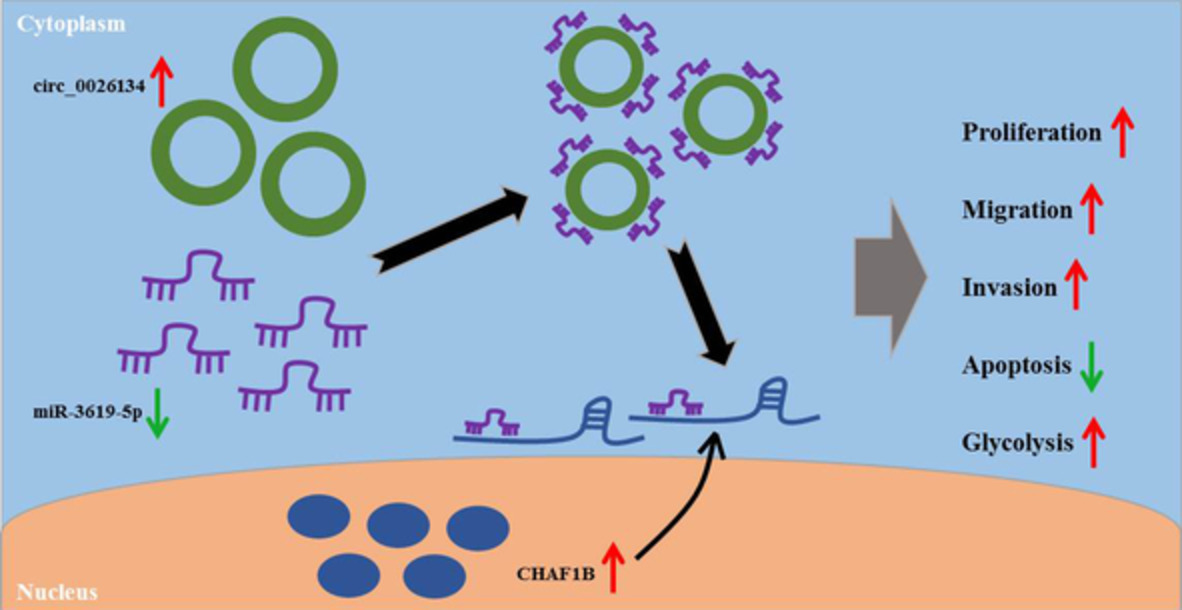
DISCUSSIONEmerging evidence has demonstrated that circRNAs can act as critical regulators in human carcinogenesis.4 However, the detailed actions of individual circRNAs largely remain to be elucidated. Circ_0026134, generated by the back-splicing of exons 1–4 of TUBA1C at chromosome 12:49658864-49667113, performs a potent oncogenic effect on NSCLC by functioning as miRNA sponges in the cytoplasm.10, 11 Here, we undertook to identify a novel circ_0026134/miRNA/mRNA regulatory network in NSCLC (Figure 8).

Schematic model of the circ_0026134/miR-3619-5p/CHAF1B axis in NSCLC progression. In NSCLC cells, circ_0026134 was overexpressed, and miR-0026134 overexpression reduced the level of miR-3619-5p. Then, the downregulation of miR-3619-5p resulted in an increase in the level of CHAF1B. Finally, the upregulation of CHAF1B enhanced cell proliferation, migration, invasion, glycolysis and repressed apoptosis, and thus promoted NSCLC progression
Recent studies have highlighted the antitumor role of miR-3619-5p in many cancers, such as bladder carcinoma, prostate cancer and cutaneous squamous cell carcinoma.21-23 The gain-of-function phenotype of miR-3619-5p validated its tumor suppressive activity in NSCLC, consistent with a previous study.16 In this study, we first demonstrated that circ_0026134 regulated miR-3619-5p expression by binding to miR-3619-5p. Recent studies have uncovered that several other circRNAs, such as circRNA zinc finger RNA binding protein and circFOXM1, are involved in human tumorigenesis by targeting miR-3619-5p.17, 24
CHAF1B, the p60 subunit of the chromatin assembly factor complex, has been reported to contribute to the progression of leukemia and hepatocellular carcinoma.25, 26 Moreover, CHAF1B is capable of promoting nasopharyngeal carcinoma radioresistance.27 CHAF1B was of particular interest in this study, considering its oncogenic property in NSCLC.28, 29 For the first time, we confirmed that CHAF1B was directly targeted by miR-3619-5p. Moreover, we highlighted the role of circ_0026134 as a post-transcriptional regulator of CHAF1B expression. Our data also showed that CHAF1B was a functionally important effector of circ_0026134 in affecting NSCLC development. The data of in vivo assays implied the regulation of circ_0026134 in tumor growth through the miR-3619-5p/CHAF1B axis, which would be further investigated in future work. Additionally, Chang et al. uncovered that circ_0026134 promoted NSCLC progression by inhibiting miR-1287 and miR-1256,10 which indicates that there may be other mechanisms that remain to be identified in the oncogenic effect of circ_0026134 on NSCLC. Future studies are required to determine how the novel regulatory network impacts NSCLC development in vitro and in vivo.
To conclude, our study identified a novel mechanism, the circ_0026134/miR-3619-5p/CHAF1B regulatory network, for the oncogenic effect of circ_0026134 on NSCLC. Our findings highlighted circ_00261345 as a potential therapeutic target against NSCLC.
CONFLICT OF INTERESTThe authors declare that there are no competing interests associated with the manuscript.
留言 (0)