
記住我


In everyday activities, we must continuously adjust our posture to maintain balance and avoid falling. The control of human balance and posture requires fast and robust coordination of neural ensembles distributed across multiple levels of the central nervous system (Bolton, 2015; Jacobs & Horak, 2007; Maki & McIlroy, 2007). Although the traditional view is that balance and posture are controlled by the brainstem, basal ganglia, and cerebellum, the cerebral cortex may interact with these structures to maintain balance during goal-directed movement with varying environmental demands (Jacobs, 2014; Nutt et al., 2011; Takakusaki, 2017).
The cerebral cortex presumably contributes to maintaining postural stability by detecting deviations from a stable postural state and by modulating or initiating appropriate corrective actions, either by adapting the excitability of subcortical postural circuits or by directly contributing to postural responses (Bolton, 2015). The likelihood of cortical contributions to reactive postural responses increases with the latency of the postural response (Jacobs & Horak, 2007). Yet, the cortical responses to external balance perturbations appear in the electroencephalogram (EEG) as early as 30 ms after perturbation onset. Robust cortical responses to balance perturbations appear with broad scalp distribution and rich spectral composition (Peterson & Ferris, 2018; Solis-Escalante et al., 2019; Varghese et al., 2017) and likely reflect cognitive and sensorimotor processes related to the integration of sensory information associated with sudden postural changes (Dietz et al., 1984; Dietz, Quintern, Berger, et al., 1985), and to the detection of a mismatch between expected and current postural stability (Adkin et al., 2006; Payne, Ting, et al., 2019).
The earliest cortical responses to balance perturbations appear over fronto-centro-parietal scalp areas as characteristic event-related potentials comprising a small positive peak (P1) and a large negative peak (N1), with respective latencies of 30–90 and 90–160 ms relative to perturbation onset (see Varghese et al., 2017 for a comprehensive review). These so-called perturbation-evoked potentials (PEP) P1 and N1 are modulated by the physical characteristics (i.e., displacement, velocity, acceleration, and duration) of the balance perturbations. The early P1 potential is thought to represent initial sensory afferences related to proprioception (Dietz et al., 1984; Dietz, Quintern, Berger, 1985) because the P1 potential is suppressed by ischemic deafferentation (Dietz, Quintern, Berger, 1985), suppressed by peripheral nerve stimulation (Staines et al., 2001), and presumably suppressed due to presynaptic inhibition during gait (Dietz et al., 1984; Dietz, Quintern, Berger, 1985; Dietz, Quintern, Berger, et al., 1985). The N1 potential increases with the intensity of the perturbation and its associated destabilizing effect (Dietz et al., 1989; Dietz, Quintern, Berger, et al., 1985; Goel et al., 2018; Mochizuki et al., 2010; Payne, Hajcak, et al., 2019; Staines et al., 2001), which suggests that the N1 potential is at least partially involved in the processing of the multisensory input associated with a sudden change in posture and postural stability. However, the N1 potential is unlikely to represent cortical contributions to early-phase reactive postural responses as demonstrated by its latency (~150 ms) and its weak correlation with fast reactive muscle responses (Dietz et al., 1989; Dietz, Quintern, Berger, et al., 1985; Mierau et al., 2015; Payne, Hajcak, et al., 2019). Instead, the N1 potential may represent cognitive and sensorimotor processes that modulate late-phase postural responses (e.g., stepping). Consistent with a possible cognitive function, the N1 potential is strongly affected by psychological factors such as perceived postural threat (Adkin et al., 2008; Mochizuki et al., 2010), the predictability of perturbation characteristics such as onset and intensity (Adkin et al., 2006; Mochizuki et al., 2008, 2009, 2010; Payne, Hajcak, et al., 2019), attention to concurrent tasks (Little & Woollacott, 2015; Quant et al., 2004), and habituation (Mierau et al., 2015; Payne, Hajcak, et al., 2019). For example, imposed changes to postural stability of the same magnitude elicit stronger N1 potentials under conditions of increased postural threat and reduced predictability (Adkin et al., 2008), whereas attention to a concurrent task or repeated exposure to balance perturbations gradually decreases the N1 potential (Mierau et al., 2015). These observations indicate that the N1 potential is internally regulated according to an expected deviation from a current stable posture.
The N1 potential could represent mechanisms of cognitive control (i.e., error detection and action monitoring) for self-regulation of performance via adaptive behavior. Interestingly, it has been proposed that the N1 potential represents a form of error detection (Adkin et al., 2006; Marlin et al., 2014; Payne, Ting, et al., 2019) because it shares several characteristics with classical error-related cortical responses. The error-related negativity (ERN) and the error-related potentials (ErrP) are cortical responses to the realization of an erroneous action, and have similar latencies and scalp topographies to those of the N1 potential (Chavarriaga et al., 2014; Crowley, 2013). Furthermore, the error-related responses (ERN/ErrP) scale with the magnitude and consequence of the perceived error and are modulated by prior knowledge about error occurrence (e.g., magnitude, consequence, and timing). This is comparable to how the N1 potential scales with analogous characteristics of a balance perturbation (i.e., perceived postural threat and onset predictability). Direct comparison of the N1 potential elicited by imposed postural changes (low-intensity balance perturbations) and the ERN/ErrP elicited by erroneous actions (incorrect left/right hand button press during a flanker task) showed that these responses arise from different cortical areas, i.e., the ERN/ErrP originates in the anterior cingulate cortex (ACC), whereas the N1 potential originates from the supplementary motor area (SMA; Marlin et al., 2014). The localization of the N1 potential to the SMA has been repeatedly confirmed (Goel et al., 2018; Mierau et al., 2015; Solis-Escalante et al., 2019) and interpreted as evidence in favor of a role of the N1 potential in sensorimotor processes (e.g., movement preparation and initiation) over mechanisms of cognitive control (Varghese et al., 2017). Nonetheless, it is important to mention that different aspects of cognitive control (e.g., decision conflict and response error) are associated with activity (including ERN/ErrP) from multiple structures in the posterior midfrontal cortex, including the SMA, pre-SMA, and the ACC (Bonini et al., 2014; Luu et al., 2000; Ridderinkhof et al., 2004). Therefore, it is possible that the N1 potential and the ERN/ErrP represent different aspects of a general action monitoring system (Payne, Ting, et al., 2019).
Action monitoring refers to the capacity to evaluate the outcome of our actions in order to detect errors and initiate corrective adjustments (Luu et al., 2000; Ridderinkhof et al., 2004). This implies that cortical markers of action monitoring are closely related to adaptive goal-directed behavior. Indeed, the amplitude of ERN/ErrP correlates with the magnitude of a perceived error and the required corrective response (Debener et al., 2005; Pereira et al., 2017). Similarly, the power of the midfrontal theta rhythm (3–7 Hz) correlates with error detection, response conflict (or uncertainty), and the associated behavioral adaptations (Cavanagh & Frank, 2014; Cohen & Donner, 2013). Besides the ERN/ErrP and the theta rhythm being both correlated with error detection and adaptive behavior, it has been proposed that the ERN/ErrP may be generated through phase resetting of the ongoing theta rhythm (Luu et al., 2004; Trujillo & Allen, 2007; Yeung et al., 2007), suggesting a close interrelation between the ERN/ErrP and the midfrontal theta rhythm. The ERN/ErrP and the midfrontal theta rhythm are considered cortical markers of action monitoring and may be part of a feedback control loop for top-down regulation of behavior. It remains to be established whether similar mechanisms take part in the control of balance and posture, where the neural activity at cortical levels of the postural control system could reflect action monitoring mechanisms for an internal assessment of postural stability that determines the need for late-phase balance recovery responses.
In this study we evaluated the association of the cortical responses elicited by balance perturbations with the intensity of the perturbation (as a form of perceived error), the ensuing reactive postural response (as necessary corrective actions), and the interaction between these factors. We were particularly interested in the interaction between perturbation intensity and reactive postural response (stepping vs. non-stepping) because it underlies a behavioral model of stepping probability and balance capacity, and this behavioral model may mirror the internal processes that regulate postural stability. We hypothesized that the cortical responses to balance perturbations would scale with perturbation intensity and its interaction with the type of postural response, suggesting that the cortical responses to balance perturbations follow the magnitude of the imposed change to postural stability and its associated corrective response. In this way, we investigated whether the cortical responses elicited by whole-body balance perturbations are consistent with known cortical markers of action monitoring.
We analyzed temporal and spectral parameters of these cortical responses, with special focus on the time period around the N1 potential. We used a wide range of perturbation intensities to investigate the cortical responses elicited by balance perturbations covering the extent of the transition between non-stepping and stepping responses. This was important because previous studies have been largely limited by the use of small sets of low-intensity perturbations that exclusively elicit non-stepping responses (Dietz et al., 1984, 1989; Dietz, Quintern, Berger, et al., 1985; Goel et al., 2018; Mochizuki et al., 2010; Payne, Hajcak, et al., 2019) or by the use of two distinct perturbation intensities (high - low) to elicit stepping and non-stepping responses (Mochizuki et al., 2010; Omana Moreno, 2017). Furthermore, we analyzed a wide range of spectral components to better understand the modulations of cortical rhythms with respect to the perturbation intensity and reactive responses. We anticipated that the power of the theta rhythm would be modulated by perturbation intensity and reactive responses, due to the known role of the midfrontal theta rhythm as cortical marker of action monitoring, but also because transient conditions of reduced postural stability (caused by external perturbations or natural sway) elicit a brief power increase of the theta rhythm in fronto-centro-parietal scalp areas (Peterson & Ferris, 2018; Slobounov et al., 2009; Solis-Escalante et al., 2019) and because the power of the theta rhythm covaries with postural demand (Hülsdünker et al., 2015; Mierau et al., 2017). Other spectral features were analyzed because perturbations to standing balance elicit a broadband power increase of frequencies between 3–17 Hz within 500 ms from the perturbation onset (Peterson & Ferris, 2018; Solis-Escalante et al., 2019; Varghese et al., 2014); yet, their association with perturbation intensity remains largely unexplored. Our analysis offered the possibility to identify specific cortical rhythms that may be associated with distinct cognitive and motor functions. An association of temporal or spectral parameters of the cortical responses with perturbation intensity and reactive postural responses would provide further evidence about the neural correlates of top-down regulation of reactive postural responses.
2 MATERIALS AND METHODS 2.1 ParticipantsEleven young able-body individuals participated in this study (age: 26 ± 3 years old, four female). None of the participants had self-reported history of neurological or neuromuscular disease or any other impairments that limited their involvement in the experiment. The experiments were undertaken with the understanding and written consent of each participant. The study protocol was approved by the Research Ethics Committee of the Radboud University Medical Center (Nijmegen, The Netherlands; Dossier 2018-4970). The experiments were conducted in accordance with the Declaration of Helsinki.
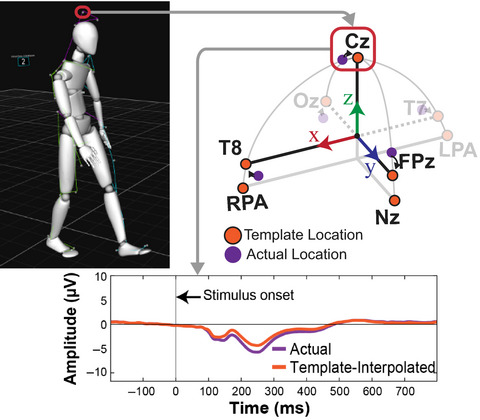
2.2 Experimental paradigmThe experiments were conducted with the Radboud Falls Simulator, a dynamic posturography system for investigating standing balance (Nonnekes et al., 2013). During the experiments, the participants stood in the middle of a movable platform with arms crossed and feet placed apart at shoulder width. Figure 1 illustrates the experimental setup and the trial timing.

Experimental setup and trial timing. Top: The participants stood in the middle of a movable platform with arms crossed and feet placed apart at shoulder width. Bottom: The balance perturbations were ramp-and-hold platform translations consisting of three phases: constant acceleration, constant velocity, and constant deceleration. At the end of the displacement the platform remained stationary for 2 s
The participants were instructed to maintain standing balance by keeping both feet in place, in response to sudden balance perturbations. The balance perturbations were ramp-and-hold translations of the movable platform consisting of three phases: constant acceleration (300 ms), constant velocity (500 ms), and constant deceleration (300 ms). At the end of the displacement the platform remained stationary for 2 s before gently returning to its initial position. The intensity of the perturbations was controlled by varying the acceleration of the translations from 0.125 to 2.5 m/s2 (increments of 0.125 m/s2, leading to 20 accelerations). The direction of the translation was either forward or backward, and thus there were a total of 40 different perturbations (20 accelerations × 2 directions). The higher perturbation intensities required the execution of reactive stepping to maintain standing balance. Forward translation of the platform elicited postural sway and an eventual step in the backward direction; similarly, backward translation of the platform elicited postural sway and an eventual step in the forward direction. Henceforth, we refer to the direction of the postural sway and eventual stepping response, unless specifically indicated as the direction of the platform translation. Participants were made aware of this and they were assured that stepping could not be avoided for a fair amount of perturbation intensities. Nonetheless, participants were encouraged to keep both feet in place throughout the experiment.
The perturbations were arranged into blocks of 10 forward and 10 backward translations with intensities uniformly distributed across the range of accelerations (same intensities in both directions per block). The order of the perturbations was randomized within each block and across participants. The inter-trial interval randomly varied between 3 and 5 s (with uniform distribution). Depending on the duration of preparation time and resting breaks, participants completed 120 or 160 experimental trials in one experimental session. Due to the arrangement of the perturbation blocks, each distinct perturbation was tested three to four times. Importantly, the participants could not predict timing onset, direction, or intensity of the perturbation.
To prevent fatigue, short pauses lasting 3–5 min were encouraged between blocks. Prior to the experiment, participants practiced with one block of perturbations to familiarize themselves with the task. The familiarization trials were not included in the analysis.
2.3 Data collectionWe recorded high-density EEG using an electrode cap with 126 Ag-AgCl electrodes (WaveGuard, ANT Neuro, The Netherlands). The electrodes were distributed across the scalp according to the five percent electrode system (Oostenveld & Praamstra, 2001). The ground electrode was placed on the left mastoid using an adhesive Ag-AgCl electrode. In addition, two-channel electrooculogram (EOG) was recorded using adhesive Ag-AgCl electrodes placed slightly above the nasion and at the outer canthus of the left eye. The ground electrode was used for both the EEG and the EOG channels. A biosignal amplifier (REFA System, TMSi, The Netherlands) recorded the EEG/EOG at 2048 Hz without any filters, except for a built-in antialiasing low-pass filter. The 128 signals (i.e., EEG and EOG) were referenced to the common average during acquisition. Ground reaction forces were recorded from two force plates (AMTI custom 6 axis composite force platform, Watertown, MA, USA; size: 60 × 180 cm each; sampling rate: 2,000 Hz) embedded in the movable platform. Each force plate recorded ground reaction forces from one foot. Synchronization triggers indicating the onset and offset of the platform movement were generated by the platform controller and simultaneously recorded with the EEG/EOG signals and the ground reaction forces.
Before beginning the experiment, EEG (and EOG) signals were recorded for a set of control conditions during quiet stance. These control conditions were short recordings (approx. one minute each) involving overt eye movement (blinking, lateral movement, eye rolling), head/neck movement (rotation, flexion/extension, lateral flexion), facial expressions (movements of mouth, lips, nose, and eyebrows), and jaw clenching; with an additional one minute of quiet stance with eyes open. These recordings were intended to assist the separation of sources of physiological noise by providing clear examples of their source activity that could be modeled as independent sources.
2.4 Detection of reactive stepping responsesThe ground reaction forces were exported to C3D format and later imported into MATLAB (The Mathworks, Inc.) for analysis. Reactive stepping responses were detected from the vertical component of the ground reaction forces using threshold detection. The vertical component of the ground reaction forces measures the force applied to each side of the movable platform, corresponding with each leg. During quiet stance the sum of the left and right ground reaction forces equals the bodyweight of the participants (mass in kg) multiplied by the acceleration of gravity on Earth (~9.8 m/s2). The vertical force components from each force plate were low-pass filtered at 20 Hz (5th order Butterworth IIR filters, zero-phase shift) and compared against a threshold of 10 N (~1 kg). Values below this threshold indicate that one of the feet has been lifted from one of the force plates. Reactive stepping responses were detected if they occurred within 1 s from perturbation onset; otherwise, the response was classified as non-stepping (feet-in-place). Participants were allowed to step with either leg.
2.5 EEG analysis 2.5.1 PreprocessingThe EEG was analyzed with MATLAB using custom scripts and incorporating functions from EEGLAB (Delorme & Makeig, 2004). The EEG was filtered between 1 and 200 Hz (consecutive high-pass and low-pass 5th order Butterworth IIR filters, zero-phase shift) and downsampled to 512 Hz. The EEG and EOG recordings from control conditions and experimental blocks were concatenated. Highly contaminated channels were identified by visual inspection and removed from the recordings. On average, 126 channels remained for analysis (SD ± 1.7). The remaining channels were re-referenced to the common average. The data were visually inspected for segments with cable movements or electrode disconnection, which were removed from the data.
2.5.2 Estimation of source-resolved activityIndependent component analysis (ICA) was used to estimate source-resolved brain activity from the high-density EEG (Gramann et al., 2014; Makeig et al., 2009) and to reduce the influence of other sources of physiological noise (e.g., electromyogram and electrocardiogram; Gwin et al., 2010; Kline et al., 2015; Oliveira et al., 2016; Snyder et al., 2015). This approach is in line with previous studies on cortical dynamics during whole-body movement and balance control (Gwin et al., 2011; Peterson & Ferris, 2018; Sipp et al., 2013; Solis-Escalante et al., 2019; Varghese et al., 2014). Because the EEG was referenced to the common average, a principal component analysis was used before ICA simply to remove the principal component with the lowest eigenvalue (null-space; Artoni et al., 2018).
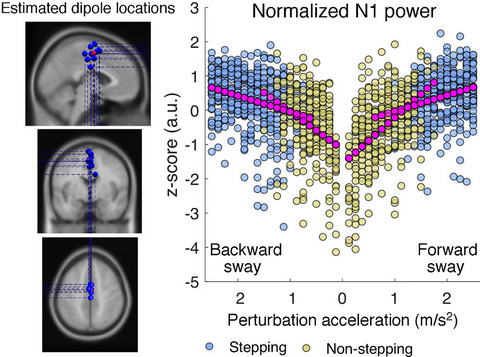
Following the ICA, the source-resolved activity was segmented into epochs from −2 to 9 s relative to perturbation onset. Per participant, one independent component (IC) was identified as the likely source of the N1 potential by inspection of the event-related potential associated with each IC. All candidate ICs were further evaluated as likely brain sources based on the residual variance of an equivalent current dipole fitted to their scalp projections. The equivalent current dipoles were fitted using a four-shell spherical head model and standard electrode positions (DIPFIT toolbox within EEGLAB, Oostenveld & Oostendorp, 2002). The equivalent current dipoles provide an estimation (limited in spatial resolution) of the likely location of the source-resolved N1, which assists the validation of a dipolar topography of the scalp projection and a physiologically plausible location (Kline et al., 2015; Snyder et al., 2015). Thus the objective of the source localization analysis was to provide additional information on the distribution of individual IC scalp maps, to answer the questions whether the scalp map has a dipolar distribution (indicated by its residual variance) and whether the scalp map is likely to represent a cortical source (indicated by its spatial location).
The location of the equivalent current dipoles calculated by the DIPFIT toolbox are given in Talairach coordinates. The corresponding Broadmann areas were found using the online application mni2tal (available at https://bioimagesuiteweb.github.io/webapp/mni2tal.html) from the Yale BioImage Suite Package (Lacadie et al., 2008).
2.5.3 Time and time-frequency domain cortical parametersThe signal of the estimated source-resolved N1 potential was analyzed to quantify single-trial amplitude and latency. A copy of the source-resolved signal was low-pass filtered at 30 Hz (5th order Butterworth IIR filter, zero-phase shift) and the single-trial amplitude and latency were identified as the largest negative peak within 300 ms from perturbation onset. The single-trial amplitude and latency were stored for analysis.
To quantify spectral parameters, the estimated source-resolved signal was analyzed in the time-frequency domain by convolving this signal with a set of complex Morlet wavelets, defined as complex sine waves tapered by a Gaussian (Cohen, 2019). The frequencies of the wavelets ranged from 2 to 50 Hz in 30 steps (logarithmically spaced). The full-width at half-maximum (FWHM) ranged from 800 to 200 ms, decreasing with increasing wavelet peak frequency. This corresponded to a spectral FWHM range of 1.7–7.2 Hz.
Event-related parameters were extracted from the single-trial source-resolved signal in time domain and the time-frequency domain for 101 time points within ±500 ms (time resolution: 10 ms), relative to the trial-specific N1 latency. Thus, there were 101 time domain parameters and 101 × 30 time-frequency domain parameters. All parameters were transformed to logarithmic power (10 log10 (|parameterx|2)), for consistency in analyses and interpretation of temporal and spectral features.
2.6 Trial rejectionAfter selection of the N1 component, the source-resolved activity was visually inspected once again for possible artifacts (e.g., movement artifacts or excessive contamination from muscular activity) within ±2 s from perturbation onset. Then, single-trials with N1 amplitudes or latencies beyond ±3 SD from the mean were rejected. Trial rejection was separately conducted for each participant. The remaining trials were time-locked to the N1 latency and visually inspected in the interval −1 to 1.5 s (relative to N1 latency). On average, there were 125 trials (SD ± 24) per participant.
2.7 Event-related potentials and spectral modulationsFor the purpose of visualization, grand average event-related potentials associated with stepping and non-stepping responses were computed in the forward and backward direction. The source-resolved signals were normalized on a trial-by-trial basis (z-score across time points), time-locked to the N1 latency, and averaged across trials from the same condition.
Similarly, the grand average event-related spectral modulations were computed per condition. Single-trial spectrograms were computed following the time-frequency analysis described in the previous section (i.e., convolution with complex Morlet wavelets). The spectrograms were transformed to logarithmic power and a trial-specific baseline was computed as the mean (log transformed) spectrum from the interval −1.5 to −0.5 s, relative to perturbation onset. The baseline was subtracted from its corresponding trial and the baseline-corrected spectrograms were time-locked to the N1 latency. Finally, time-frequency maps showing the mean event-related spectral modulations (i.e., power changes relative to baseline) were computed by averaging the spectrograms across trials from the same condition. The statistical significance of the spectral modulations was estimated for each time-frequency bin from its 95% confidence interval (bootstrap, n = 200).
2.8 Relation of cortical parameters with perturbation intensity and stepping behavior The effects of perturbation intensity and stepping behavior on the cortical parameters were analyzed with the model for general linear regression: where the regression coefficients β1 and β2 indicate the main effects of the perturbation intensity (i.e., acceleration: ACCEL) and the dummy-coded stepping behavior (STEP), respectively; and the regression coefficient β3 indicates the effect of their interaction (ACCEL × STEP). The null-hypothesis that there is no significant relation with the cortical parameters Cx corresponds to regression coefficients equal to zero. The null-hypothesis can be rejected if the confidence interval of a given regression coefficient does not include zero.
Regression analyses were conducted at group-level using pooled trials from all participants, after participant-specific normalization (z-score across trials) of the cortical parameters. The analyses were performed separately for forward and backward stepping directions, with time and time-frequency parameters. An additional regression analysis was conducted to determine the effects of perturbation intensity and stepping behavior on the N1 latency (after participant-specific normalization).
The significance of the regression analysis was evaluated with an F test and the significance of the regression coefficients with a t test. Statistical significance was assessed for critical α = 0.01. Given the multiple regression analyses computed in time and time-frequency domains, p-values were corrected for false discovery rate (FDR; Benjamini & Yekutieli, 2001).
3 RESULTS 3.1 Reactive stepping responses (behavioral analysis)Table 1 presents the total number of trials per condition and the mean latencies of the reactive stepping responses (foot-off detection). Importantly, the forward and backward directions refer to the direction of postural sway and eventual stepping. The conditions were defined on basis of postural sway direction (forward vs. backward) and the ensuing reactive response (stepping vs. non-stepping), irrespective of the perturbation intensity. These latencies are relative to perturbation onset and averaged across stepping responses at varying perturbation intensities. Figure 2 shows the distribution of trials over perturbation intensities (i.e., accelerations) and the estimated stepping probability (computed via logistic regression).
TABLE 1. Number of trials and average stepping response latency (ms) per condition Backward Forward Stepping Non-stepping Stepping Non-stepping TrialsFoot-off
latency
Trials TrialsFoot-off
latency
Trials S01 25 411.7 17 20 572.5 15 S02 31 598.5 23 31 632.5 22 S03 35 600.9 24 24 745.9 35 S04 41 318.2 18 31 387.8 27 S05 43 472.2 36 36 688.7 36 S06 51 448.5 22 35 607.7 38 S07 40 443.6 16 31 468.6 25 S08 45 306.3 9 27 386.7 31 S09 33 371.1 30 27 540.6 36 S10 41 499.2 37 45 450.4 31 S11 57 287.2 21 54 397.9 19 Pooled 442 422.4 253 361 521.8 315 SD (pooled) 170.1 172.8
Trial distribution and stepping probabilities (group-level). Top: Total trial count per acceleration and distribution of stepping (blue) and non-stepping (yellow) trials. The distribution of the total number of trials was near-uniform in the backward stepping (negative accelerations) and forward stepping (positive accelerations) direction. Consistent with anatomical and functional constraints, the proportion of stepping trials was higher in the backward direction (see text). Bottom: The stepping probability as a function of perturbation intensity was computed for each direction using logistic regression. Individual probability curves are shown in cold colors (blue to magenta) and the group-level probability is shown with a thick black line
There were 695 trials challenging postural stability in the backward direction and 676 trials challenging postural stability in the forward direction. The mean number of trials per participant was not significantly different between the two directions (two-tailed paired t test; t(10) = 1.71, p = .118) and the distribution of trials over intensities was close to uniform (Kolmogorov–Smirnov tests for uniform distributions between 0.125 and 2.500 m/s2; backward: D(695) = 0.051, p = .052; forward: D(676) = 0.054, p = .038; see Figure 2). In both directions, more than half of the trials elicited reactive stepping responses (backward: 63.3%, forward: 53.4%), but the proportion of stepping trials was significantly larger for the backward direction (chi-squared test; χ2 = 14.68, p = 1.27e−04). Consistent with these observations, the stepping probability models estimate that 50% stepping probability (at group level) corresponds to 1.02 m/s2 for the backward stepping and 1.28 m/s2 for the forward stepping direction; with the limits for 25% and 75% stepping probability at [0.87, 1.18] m/s2 and [1.10, 1.46] m/s2 respectively. The pooled data showed only non-stepping responses for perturbation intensities smaller or equal to 0.5 m/s2 in both directions. Similarly, stepping responses for perturbation intensities greater than 1.5 m/s2 for backward stepping and 1.75 m/s2 for forward stepping (see histogram in Figure 2). The mean stepping latency was significantly shorter for the backward stepping direction (two-tailed paired t test; t(10) = −4.33, p = .001).
3.2 Visualization of event-related cortical responsesIn Figure 3, the event-related potentials show the strong negative peak of the N1 potential (t = 0 s) and the characteristics of the cortical response to balance perturbations (Varghese et al., 2017); namely, a slow potential shift preceding perturbation onset, followed by P1 (positive) and N1 (negative) potentials and late potentials of varying latency and amplitude approximately within 400 ms after perturbation onset. The event-related spectral modulations show a broadband power increase over the frequencies of the theta, alpha, beta, and gamma rhythms, occurring shortly after perturbation onset and coinciding with the N1 potential. In general, the initial broadband power increase is followed by power decrease over the frequencies of the alpha and low-gamma rhythms. This spectral modulation pattern is characteristic of cortical responses to balance perturbations (Peterson & Ferris, 2018; Solis-Escalante et al., 2019; Varghese et al., 2017). The visualization of event-related cortical responses is meant to provide an overview of the time and time-domain characteristics of the conditions defined on basis of postural sway direction (forward vs. backward) and the ensuing reactive response (stepping vs. non-stepping), irrespective of the perturbation intensity.

Event-related potentials and event-related spectral modulations. Characteristic cortical responses to balance perturbations in time domain (middle row) and time-frequency domain (bottom row), shown relative to the peak amplitude of the N1 potential (t = 0 s) and in comparison with the distribution (top row) of perturbation onset (blue) and foot-off onset (pink) latencies. The vertical dashed line indicates the median latency of the perturbation onset (backward: stepping −171.9 ms, non-stepping −183.6 ms; forward: stepping −173.8 ms, non-stepping −183.6 ms) and the vertical dotted line indicates the median foot-off latency (backward: 202.6 ms; forward: 289.9 ms). The region of interest (ROI, shown with a gray band) extended from −500 to 500 ms relative to the N1 potential, including the period between median perturbation onset and foot-off latencies. The time domain plots show a typical N1 potential for each individual (blue to magenta) and the group-level average (thick black line
留言 (0)