
記住我


Higher concentrations of the omega-3 polyunsaturated fatty acids (n-3 PUFAs) eicosapentaenoic acid (EPA) and docosahexaenoic acid (DHA) in blood and adipose tissue have been associated with lower risk of cardiovascular events in the general population [1-4] and among patients with established cardiovascular disease [5-7]. The GISSI-Prevenzione trial demonstrated that supplementation with combined EPA and DHA after an acute myocardial infarction (AMI) reduced the risk of subsequent AMI and death [8]. Later trials conducted in the era of modern secondary prevention have, however, failed to demonstrate a clear benefit of mixed EPA and DHA supplementation after AMI [9-11]. In the OMega-3 fatty acids in Elderly patients with Myocardial Infarction (OMEMI) trial, we confirmed these neutral results even when using a higher dose (1.8 g) of mixed EPA and DHA than in previous trials [12].
In patients with hypertriglyceridemia, supplementation with very high dose icosapent ethyl (i.e., purified EPA) of 4 g significantly reduced the risk of cardiovascular events [13], and the magnitude of risk reduction was associated with the achieved serum EPA levels in the active treatment arm. A similar type of study testing the same high dose of mixed EPA and DHA found no significant risk reduction, and no association between risk and changes in EPA or DHA [14, 15].
Concerns related to an increased risk of incident atrial fibrillation (AF) from n-3 PUFAs supplementation have emerged from the results of recent trials [12–14, 16]. The underlying mechanism for this association and whether there is a dose-dependent gradient remain unknown.
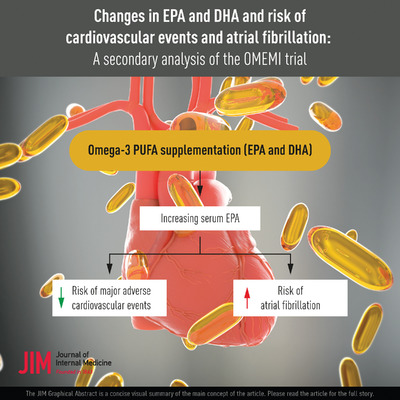
In the current prespecified substudy of OMEMI, we aimed to investigate changes in serum concentrations of EPA and DHA in association with the risk of major adverse cardiovascular events (MACE) and new-onset AF in patients treated for 2 years with mixed EPA and DHA.
Material and methodsThe OMEMI trial (NCT01841944) was a randomized, double-blind, parallel group, placebo-controlled trial testing the cardiovascular effect of 1.8 g/day of n-3 PUFAs in elderly patients with a recent AMI [12, 17]. Criteria for inclusion were age 70–82 years and hospitalization for AMI 2–8 weeks before randomization. Eligible patients were randomized in a 1:1 ratio to three capsules of n-3 PUFAs (total 1800 mg, comprising 930/660 mg EPA/DHA; Pikasol, Orkla Health, Norway) or matching placebo (corn oil). Treatment other than the intervention was standard secondary prevention according to current guidelines and by the discretion of the treating physician. Although patients were instructed not to use other n-3 PUFA supplements in the study period, one small spoon of cod liver oil was permitted for users due to local tradition for this in Norway. The OMEMI protocol was approved by the Regional Committee for Medical and Health Research Ethics (#2012/1422). All participants provided written informed consent and the trial was conducted in compliance with the Declaration of Helsinki and Good Clinical Practice.
Laboratory analysisVenous blood samples were drawn in the fasting state at randomization and the final visit (24 months). Serum was prepared within 1 hour by centrifugation at 2000× g for 10 min and kept frozen at −80°C. Fatty acid (FA) composition of serum phospholipids was analyzed by gas chromatography in thawed samples at the Lipid Research Laboratory (Aalborg University Hospital, Denmark), with results presented as percent weight (%wt) of total FAs in serum phospholipids [18]. Routine laboratory analyses were performed by conventional methods in core laboratories.
Outcome measuresThe primary outcome was a composite of MACE, including nonfatal AMI, unscheduled revascularization, stroke, hospitalization for heart failure (HF), or all-cause death, whichever occurred first. The secondary outcome was new-onset AF, which was screened for by hand-held single-lead rhythm monitoring for 30 s twice daily for 14 consecutive days following the 12-month visit (Zenicor Medical Systems AB, Stockholm, Sweden), in addition to standard 12-lead ECG and review of hospital records at each study visit (3, 12, and 24 months). Patients with known AF or new-onset AF between the index AMI and randomization were excluded from this analysis. The primary safety outcome was serious bleeding, defined as Bleeding Academy Research Consortium (BARC) classification ≥2 [12]. All outcomes were adjudicated by an independent endpoint committee.
Statistical analysisValues are reported as N (%) and median (quartiles 1 to 3 [Q1, Q3]) for skewed and mean ± SD for normally distributed variables. Categorical and continuous variables were compared using the chi-square test for binary variables, ANOVA for parametric continuous variables, and the Kruskal–Wallis test for nonparametric continuous variables. Clinical and laboratory variables were presented by quartiles of EPA and DHA levels at baseline and change from baseline to 24 months, and compared for trend across quartiles by linear and logistic regression. Absolute changes in EPA and DHA were calculated by subtracting the baseline level from the 24 month level, and ratios of change by dividing the 24 month level with the baseline level. Correlations between changes in EPA and DHA were calculated by Spearman's rho. Changes in EPA and DHA in serum phospholipids were assessed in association with the risk of MACE and the risk of new-onset AF by Cox proportional hazard regression models, stratified by treatment arm. The analyses conducted with respect to incident MACE and incident AF were conducted separately without censoring patients who experienced the other event, that is, patients who experienced MACE were not censored and still followed for AF subsequently. The Cox models were adjusted for covariates determined a priori based on clinical factors known to be associated with risk (i.e., age, sex, current smoking, body mass index [BMI], systolic blood pressure, New York Heart Association functional class [NYHA], preexisting hypertension, diabetes mellitus, and HF), in addition to baseline levels of each n-3 PUFA to account for regression to the mean. Restricted cubic spline models tested for 2–7 knots (best linear or nonlinear fit based on Bayesian Information Criterion), and adjusted for the same covariates as the Cox model, were used to plot the flexible relationship between changes in serum EPA and DHA as continuous variables and the incidence of MACE and AF. All statistical analyses were performed using Stata Software (v16, Stata Corp., College Station, TX). A two-sided p-value of <0.05 was considered statistically significant.
ResultsIn total, 1002 of the 1027 patients enrolled in the trial had available FA measurements at randomization. Their mean age was 74.7 ± 3.6 years. A total of 287 (28.6%) were female and 1000 (99.8%) were Caucasian.
Baseline EPA and DHA serum phospholipid levels and their association with outcomesEPA and DHA levels at baseline were median 2.5 (Q1–Q3 1.8–3.5) and 5.6 (Q1–Q3 4.8–6.6) %wt, respectively. Higher EPA and DHA levels were associated with intake of pretrial n-3 PUFA supplements, less frequent current smoking and diabetes mellitus, better NYHA functional class, higher left ventricular ejection fraction, lower plasma triglycerides and higher high-density lipoprotein (HDL)–cholesterol (Table 1; Table S1).
Table 1. Baseline characteristics by quartiles of baseline eicosapentaenoic acid (EPA) concentrations Baseline EPA Q1 Baseline EPA Q2 Baseline EPA Q3 Baseline EPA Q4 ≤1.82 1.84–2.52 2.53–3.51 ≥3.52 p-value Baseline EPA, %wt n = 253 n = 250 n = 251 n = 248 for trend Age, years 74.2 ± 3.5 75.3 ± 3.7 74.6 ± 3.6 74.8 ± 3.5 0.23 Female sex 71 (28.1%) 74 (29.6%) 73 (29.1%) 69 (27.8%) 0.93 Current smoker 38 (15.0%) 33 (13.2%) 23 (9.2%) 24 (9.7%) 0.027 Body mass index, kg/m2 26.4 ± 4.1 27.4 ± 9.8 26.8 ± 4.0 26.5 ± 3.9 0.85 Systolic blood pressure 135.8 ± 21.0 137.4 ± 19.7 137.2 ± 19.5 138.1 ± 18.8 0.23 Heart rate, per min 70.6 ± 42.5 66.1 ± 13.1 65.6 ± 12.0 66.5 ± 40.9 0.14 NYHA 3 or 4 31 (12.4%) 21 (8.4%) 19 (7.6%) 16 (6.5%) 0.020 Prev. LV ejection fraction, % 48.9 ± 9.0 49.3 ± 8.7 50.7 ± 8.7 51.2 ± 7.4 0.006 Medical history Hypertension 166 (65.6%) 137 (54.8%) 154 (61.4%) 146 (58.9%) 0.32 Diabetes mellitus 64 (25.3%) 53 (21.2%) 56 (22.3%) 35 (14.1%) 0.005 Prev. acute myocardial infarction 69 (27.3%) 74 (29.6%) 60 (23.9%) 54 (21.8%) 0.07 Prev. coronary revascularization 71 (28.1%) 70 (28.0%) 78 (31.1%) 74 (29.8%) 0.51 Prev. atrial fibrillation 38 (15.0%) 34 (13.6%) 36 (14.3%) 46 (18.5%) 0.27 Prev. heart failure 18 (7.1%) 19 (7.6%) 18 (7.2%) 9 (3.6%) 0.12 Index acute myocardial infarction STEMI 88 (34.8%) 96 (38.4%) 76 (30.3%) 75 (30.2%) 0.10 Troponin T maximum 678 (157, 2214) 844 (186, 3771) 603 (123, 2221) 479 (112, 1929) 0.021 Medications Aspirin 238 (94.1%) 239 (95.6%) 231 (92.0%) 236 (95.2%) 0.96 Statin 238 (94.1%) 241 (96.4%) 245 (97.6%) 243 (98.0%) 0.012 Beta blocker 220 (87.0%) 203 (81.2%) 207 (82.5%) 201 (81.0%) 0.12 n-3 PUFA supplement 55 (21.9%) 81 (32.5%) 122 (48.8%) 154 (63.1%) <0.001 Laboratory measurements Creatinine, umol/L 91 (77, 110) 87 (76, 105) 86 (77, 102) 84 (72, 97) <0.001 Hemoglobin A1c, % 5.9 (5.5, 6.5) 5.8 (5.5, 6.4) 5.8 (5.5, 6.3) 5.8 (5.5, 6.1) 0.12 Total cholesterol, mmol/L 3.65 (3.10, 4.20) 3.60 (3.10, 4.20) 3.55 (3.10, 4.10) 3.50 (3.10, 4.00) 0.02 HDL cholesterol, mmol/L 1.10 (0.91, 1.40) 1.20 (1.00, 1.57) 1.20 (1.00, 1.49) 1.30 (1.05, 1.56) <0.001 LDL cholesterol, mmol/L 1.92 (1.50, 2.40) 1.90 (1.50, 2.38) 1.87 (1.47, 2.30) 1.80 (1.50, 2.22) 0.022 Triglycerides, mmol/L 1.39 (1.00, 1.79) 1.14 (0.88, 1.55) 1.06 (0.81, 1.42) 0.92 (0.75, 1.18) <0.001 Abbreviations: HDL, high-density lipoprotein; LDL, low-density lipoprotein; LV, left ventricular; NYHA, New York Heart Association; PUFA, polyunsaturated fatty acids; STEMI, ST-elevation myocardial infarction.Serum concentrations of EPA and DHA at baseline (n = 1002), were not associated with incident MACE or all-cause death (N = 208): hazard ratio (HR) 0.93 (95% confidence interval [CI] 0.84–1.03), p = 0.18 and HR 0.93 (0.84–1.03), p = 0.15, respectively. This null effect persisted even after adjusting for age, sex, BMI, current smoking, systolic blood pressure, NYHA class, hypertension, diabetes mellitus, and HF (HR 0.99 [0.89–1.10], p = 0.82 for EPA and HR 0.96 [0.86–1.07], p = 0.44 for DHA). There were no associations between baseline serum EPA and DHA levels and new-onset AF (N = 43): HR 1.09 (0.89–1.33), p = 0.42 and HR 1.19 (0.96–1.43), p = 0.11, respectively. This was also consistent in adjusted models (HR 1.14 [0.92–1.40], p = 0.22 for EPA and HR 1.20 [0.97–1.50], p = 0.10 for DHA).
Changes in EPA and DHA levels during the studyFA measurements at the final 24-month study visit were available in 881 patients. Patients without follow-up samples included 55 nonsurvivors and 66 survivors who did not have measurements of EPA and DHA available (only 27 of these attended the final visit). Overall, patients without available blood samples at both time points were older, with more comorbidities and a greater incidence of MACE (Table S2). At the 24-month visit, median EPA was 3.5 (Q1–Q3 2.0–5.4) %wt and DHA 6.0 (Q1–Q3 4.9–7.1) %wt for the total population. In patients randomized to n-3 PUFAs, EPA increased by 2.4 (Q1–Q3 1.0–3.6) %wt, corresponding to a relative median 87% (Q1–Q3 32%, 166%) increase, and DHA increased by 0.9 (Q1–Q3 0.13–1.8) %wt, corresponding to a median 16% (Q1–Q3 2%, 33%) increase (Fig. 1). The on-treatment changes in EPA and DHA correlated moderately (rho 0.57, p < 0.001; Fig. S1). In the placebo group, there was a small decrease in both EPA, −0.3 (Q1–Q3 −1.1–0.5) %wt (−13% [Q1–Q3 -35%, +21%]), and DHA, −0.4 (Q1–Q3 −1.1–0.3) %wt (−8% [Q1–Q3 −18%, +6%]). Compared to placebo, EPA levels increased by median 100% and DHA by median 24% in the active treatment arm.

Changes in eicosapentaenoic acid (EPA) and docosahexaenoic acid (DHA) from baseline to 2 years in patients randomized to 1.8 g/day of n-3 polyunsaturated fatty acids (n-3 PUFAs) and in patients randomized to placebo.
Greater increases in EPA and DHA in the active treatment arm were associated with decreasing plasma triglycerides and increasing HDL-cholesterol concentrations throughout the study. (Table 2; Table S3). Patients with lower EPA and DHA concentrations at baseline experienced greater increases in EPA and DHA.
Table 2. Baseline values and absolute changes in serum lipids and fatty acid concentrations, by quartiles of change in eicosapentaenoic acid (EPA) in the n-3 PUFA arm (n = 438) EPA change Q1 n = 110 EPA change Q2 n = 110 EPA change Q3 n = 110 EPA change Q4 n = 108 p-value for trend Change in EPA (%wt) <1.0 1.0–2.4 2.5–3.6 >3.6 Baseline biomarkers HDL cholesterol, mmol/L 1.16 (1.00, 1.41) 1.27 (1.00, 1.51) 1.20 (1.00, 1.40) 1.20 (1.00, 1.58) 0.48 LDL cholesterol, mmol/L 1.80 (1.40, 2.10) 1.80 (1.40, 2.23) 1.90 (1.50, 2.30) 1.90 (1.48, 2.52) 0.01 Triglycerides, mmol/L 1.19 (0.89, 1.60) 1.04 (0.84, 1.45) 1.12 (0.88, 1.52) 1.13 (0.88, 1.51) 0.44 EPA, %wt 3.16 (2.17, 4.67) 2.92 (2.11, 3.76) 2.38 (1.83, 3.19) 2.09 (1.55, 2.92) <0.001 Docohexaenoic acid, %wt 5.8 (4.9, 6.7) 5.7 (4.9, 6.9) 5.6 (4.8, 6.5) 5.5 (4.7, 6.4) 0.05 Change in biomarkers HDL cholesterol, mmol/L 0.06 (−0.04, 0.29) 0.10 (−0.03, 0.28) 0.10 (−0.02, 0.30) 0.20 (0.05, 0.40) <0.001 LDL cholesterol, mmol/L 0.10 (−0.20, 0.28) −0.02 (−0.30, 0.30) −0.10 (−0.40, 0.30) 0.06 (−0.30, 0.38) 0.79 Triglycerides, mmol/L 0.05 (−0.28, 0.32) −0.07 (−0.24, 0.13) −0.10 (−0.40, 0.14) −0.21 (−0.45, −0.03) <0.001 n-3 PUFA supplement (n, %) n-3 PUFA suppl. baseline 49 (45.0) 50 (46.3) 39 (35.8) 42 (38.9) 0.18 n-3 PUFA suppl. study end 17 (15.9) 16 (15.1) 20 (18.5) 27 (25.7) 0.05 Abbreviations: HDL, high-density lipoprotein; LDL, low-density lipoprotein; PUFA, polyunsaturated fatty acids. Changes in EPA and DHA levels and their association with MACEIn patients with available FA samples at baseline and final study visit (n = 881), a total of 128 experienced MACE during follow-up—comprising of 54 with AMI, 34 nonscheduled revascularizations, 23 strokes, and 17 hospitalizations for HF as the first event. In patients randomized to n-3 PUFAs (n = 438), there was an association between greater increases in EPA levels and lower risk of MACE (N = 68): unadjusted HR 0.89 (95% CI 0.78–1.00) per %wt increase, p = 0.059 and HR 0.86 (0.75–0.99), p = 0.034 after adjusting for age, sex, BMI, current smoking, systolic blood pressure, NYHA class, hypertension, diabetes mellitus, HF, and baseline concentrations of EPA (Table 3; Fig. 2), and the association was linear (Table S4). Similarly, there was an association between the achieved EPA level (concentrations at the final study visit) and incident MACE in adjusted models: HR 0.86 (0.75–0.99) per %wt, p = 0.034. The lowest risk was seen in the top three quartiles of EPA increase, and these patients had a 61% lower risk of MACE compared to the lowest quartile (HR 0.39 [0.19–0.79], p = 0.009) (Figure S2). There was no significant association between changes in DHA and incident MACE in the active treatment arm: unadjusted HR 0.86 (0.70–1.05), p = 0.13 and adjusted HR 0.83 (0.66–1.05), p = 0.14. Similarly, there was no association between achieved DHA level and risk of MACE: adjusted HR 0.91 (0.74–1.10), p = 0.35. The ratio of changes in EPA and DHA was not associated with incident MACE (Table S4). There was no effect modification by treatment arm on the association between change in EPA and MACE (adjusted p for interaction = 0.30), while there was a borderline interaction for change in DHA and MACE (adjusted p for interaction = 0.05). In the placebo arm (n = 443), there were no significant associations between changes in EPA and DHA and incident MACE (N = 60; Table 3).
Table 3. Cox regression models of changes in EPA and DHA levels (absolute values, per percentage weight of total fatty acids increase) from baseline to 24 months in association with the risk of major adverse cardiovascular events (MACE) (n = 881) and new-onset atrial fibrillation (AF) in participants free of AF at baseline (n = 759) n-3 PUFAs Placebo HR (95% CI) p-value HR (95% CI) p-value MACE Delta EPA, unadjusted 0.89 (0.78–1.00) 0.059 1.02 (0.85–1.23) 0.85 Delta EPA, adjusteda 0.86 (0.70–0.99) 0.034 1.05 (0.84–1.31) 0.67 Delta DHA, unadjusted 0.86 (0.70–1.05) 0.13 1.16 (0.92–1.46) 0.22 Delta DHA, adjusteda 0.84 (0.66–1.06) 0.14 1.19 (0.92–1.53) 0.20 New- onset AF Delta EPA, unadjusted 1.31 (1.06–1.62) 0.012 0.91 (0.64–1.31) 0.63 Delta EPA, adjusteda 1.36 (1.07–1.72) 0.011 1.01 (0.69–1.50) 0.90 Delta DHA, unadjusted 1.29 (0.91–1.83) 0.16 0.75 (0.50–1.13) 0.16 Delta DHA, adjusteda 1.39 (0.90–2.13) 0.13 0.82 (0.51–1.33) 0.42 AF, atrial fibrillation; EPA, eicosapentaenoic acid; DHA, docosahexaenoic acid; HR, hazard ratio; MACE, major adverse cardiovascular events; PUFA, polyunsaturated fatty acids.
Changes in eicosapentaenoic acid (EPA) and incident rates of major adverse cardiovascular events (left panel, n = 438) and new-onset atrial fibrillation (right panel, n = 339 free of atrial fibrillation at study inclusion) in patients randomized to 1.8 grams per day of n-3 polyunsaturated fatty acids for 2 years. Models are adjusted for age, sex, current smoking, body mass index, systolic blood pressure, New York Heart Association class, preexisting hypertension, diabetes, heart failure, and baseline levels of EPA. The flexible associations were tested with 2–7 knots, and 2 knots (linear) yielded the best fit for both analyses using the lowest Bayesian Information Criterion. The histogram represents the distribution of patients by change in EPA (right Y-axis) and the black line represents the association between change in EPA and incident rate of each outcome (left Y-axis) with 95% confidence intervals as dashed lines.
Changes in EPA and DHA levels and their association with new-onset AFOf the 881 patients with FA samples available at both time points, 759 (86%) had no history of AF at randomization. During follow-up, a total of 43 (6%) patients had new-onset AF, of whom two were detected by thumb ECG following the 12-month visit. In patients randomized to n-3 PUFAs, there was a significant association between a greater increase in EPA and a higher risk of incident AF: adjusted HR 1.36 (1.07–1.72), p = 0.011. (Table 3; Fig. 2; Fig. S3), and the association was linear (Table S4). Similarly, achieved EPA serum phospholipid levels were associated with new-onset AF: adjusted HR 1.36 (1.07–1.72), p = 0.011. Changes in DHA were not significantly associated with incident AF in the active treatment arm: adjusted HR 1.29 (0.91–1.83), p = 0.16. Similarly, no associations were observed for achieved DHA levels: adjusted HR 1.29 (0.91–1.83), p = 0.15. The ratio of change in EPA was associated with incident AF in the active treatment arm: HR 1.35 (1.06–1.72), p = 0.01, while this was not significant for the ratio of change in DHA (Table S5). In patients randomized to placebo also there was no significant association between changes in EPA and DHA for incident AF.
Changes in EPA and DHA levels in association to bleedingSerious bleeding occurred in 90 (10.2%) of the 881 patients with FA samples available at both time points, of which 45 were in the active treatment arm. There was no association between changes in EPA or DHA and serious bleeding in the active treatment arm: OR 1.02 (0.77–1.33), p = 0.91, and OR 0.94 (0.71–1.23), p = 0.64 (Table S6). Similar results were present when analyzing the total study population.
DiscussionIn elderly patients with a recent AMI treated with 1.8 g/day of n-3 PUFAs, greater increases in serum phospholipid EPA were independently associated with lower risk of incident MACE and higher risk of new-onset AF. Despite tendencies in the same direction, there was no significant association between changes in DHA and cardiovascular events. In the OMEMI trial, patients treated with n-3 PUFA had a borderline significant 84% increased risk of new-onset AF, and we now extend these findings by showing an association between increases in EPA and AF risk in the active treatment arm. These data suggest that potential beneficial effects on MACE of increasing n-3 PUFA levels through supplements may be counteracted by an increased risk of AF.
Circulating levels of n-3 PUFAs at baseline and cardiovascular riskHigher circulating levels of EPA and DHA have consistently been shown to be associated with lower risk of cardiovascular events and all-cause death in large cohort studies and epidemiological studies [1–7, 19, 20]. In OMEMI, we found no significant association between baseline concentrations of EPA or DHA in serum phospholipids and cardiovascular risk. However, higher levels were associated with lower plasma triglycerides and low-density lipoprotein (LDL) cholesterol and higher HDL-cholesterol levels. Moreover, patients with higher serum levels of n-3 PUFAs were less likely to smoke, had less diabetes mellitus, higher functional class, and used more statins after the index AMI. These associations suggest that patients with higher baseline levels of n-3 PUFAs have fewer risk factors and fewer adverse health behaviors. This highlights the core challenge with clinical nutrition research—detangling association from causation.
Supplementation with EPA and DHA and cardiovascular riskThe n-3 PUFA dose used in the OMEMI trial was moderate, that is, higher than the majority of trials that were using <1 g/day [9-11], but lower than 4 g/day used in the recent landmark trials STRENGTH and REDUCE-IT [13, 14]; whereas STRENGTH and OMEMI, which used a carboxylic acid formulation of EPA and DHA, showed neutral results, REDUCE-IT demonstrated a striking 25% reduction in cardiovascular events from pure EPA (icosapent ethyl) [13, 14]. The cardiovascular benefits from pure EPA supplementation in the open-label JELIS [
留言 (0)