
記住我

Acute ischemic stroke (AIS) is one of the most common causes of acquired epilepsy in adults.1, 2 Many studies have attempted to identify the clinical risk factors for post-stroke epilepsy (PSE) and to develop prognostic tools, including the PSEiCARe3 and SeLECT scores.4 However, discovering biomarkers of epileptogenesis after stroke still faces many fundamental challenges. The causes and influential factors of PSE are multifactorial, not only just limited to the processes of stroke or post-stroke mechanisms but also the prevailing condition of the brain before the stroke.5, 6
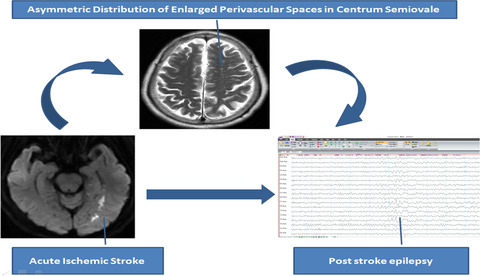
Perivascular spaces (PVSs) are interstitial fluid-filled cavities surrounding the small penetrating blood vessels7 in the brain and are believed to play an important role in glymphatic drainage of waste clearance and maintaining tissue homeostasis.8 There is emerging evidence that enlarged PVSs (EPVSs), indicative of dysfunction of glymphatic drainage,9 are a feature of brain disorders including small vessel disease,10 cognitive impairment,11 multiple sclerosis,12 and Parkinson's disease.13 It has been reported that 98.8% of AIS patients had observable EPVS when scanned within the first 7 days after stroke.14 EPVSs were found in the hippocampi of patients with temporal lobe epilepsy15, 16 and were more frequently observed in the epileptogenic cerebral hemisphere.17 This asymmetric distribution of EPVS has been reported in patients with post-traumatic epilepsy.18
These studies suggest that the asymmetric distribution of EPVS may be an imaging biomarker for the development of PSE, yet the specific relationship remains uncertain. The current study aimed to identify the risk factors for EPVS in AIS and to examine whether the EPVS was associated with the development of epilepsy after stroke. We hypothesized that there would be a direct relationship between the number of EPVS detected by MRI during the acute stage of ischemic stroke and the risk of developing PSE.
2 PARTICIPANTS AND METHODS 2.1 Study designThis is a case-control study. All patients admitted to the Nanjing Brain Hospital of Nanjing Medical University from Jan 1, 2018, to Oct 31, 2019, with AIS were screened (n = 1,465). Patients were followed up for at least 1 year post stroke or until the first occurrence of unprovoked seizures, whichever is sooner. This time point was chosen based on the observation that the incidence of late seizures is highest during the first year and typically peaks around 6–12 months after stroke.1, 19, 20 Age- and sex-matched healthy volunteers were selected as controls. Only AIS patients and healthy controls who had undergone MRI brain with appropriate sequences were included for PVS analysis.
This study was approved by the medical ethics committee of the Nanjing Brain Hospital. All participants or their family members or authorized legal representatives provided written informed consent.
2.2 Participants and groupsThe inclusion criteria were as follows: (1) any type of AIS patient; (2) MRI obtained within 2 weeks from the stroke onset; and (3) over 16 years old. Individuals were excluded based on the following criteria: (1) history or family history of seizures or epilepsy; (2) history of mental illness, CNS infectious diseases, neurological immune disorders, metabolic disorders, febrile symptomatic seizures, and alcohol/drug withdrawal or intoxication; (3) previous neurosurgery, brain tumor, or traumatic brain injury; (4) patients who were not fit to receive or refused MRI scans at the stage of stroke onset; (5) brain MRI showing one of the following abnormalities: contusion, intracranial hemorrhage, neoplastic lesion, infectious or inflammatory lesion, or hydrocephalus; (6) quality of MRI too poor for evaluation (eg, due to motion artifact). Finally, 312 of the 1,465 patients met these criteria.
Post-stroke epilepsy was defined according to the ILAE diagnostic criteria for epilepsy19, 21 as the occurrence of at least one seizure ≥30 days after the stroke (which constitutes a high recurrence risk) or ≥2 seizures ≥7 days (late seizures) after the stroke, during the follow-up of the first year from AIS onset (PSE group). The latter definition of PSE reflects the operational definition of epilepsy from ILAE21 and our clinical practice and was adopted in a previous study.22 The clinical events were evidenced by medical records (must include EEG findings).
Acute ischemic stroke patients without seizures during the follow-up period were included in the no-epilepsy AIS group.
The screening resulted in the identification of 312 AIS patients based on the inclusion criteria. 20 healthy controls from the medical examination center of our hospital were identified, with the age range (55–80 years). The participants with any known neurological condition or other diseases were excluded. This sample was necessarily much smaller than the AIS group due to the lower numbers of healthy individuals who are scanned at the hospital.
2.3 Baseline AIS characteristicsMedical records of the enrolled patients were reviewed for the relevant data, including age, sex, and National Institute of Health stroke scale (NIHSS) on admission. Causes of AIS were categorized as large-artery atherosclerosis, cardioembolism, small vessel occlusion, or other determined or undetermined causes. AIS treatments included anticoagulation or antiplatelet aggregation, intravenous thrombolysis, mechanical thrombectomy (MT), and bridged endovascular therapy with MT following thrombolysis. Based on the imaging findings, anatomical locations and the number of infarct lesions were recorded.
2.4 PVS scores and asymmetryPerivascular spaces were segmented manually by author N.Y, a neuroradiologist, with 5-year post-qualification experience. PVSs were assessed on T2-weighted MRI scans (resolution =1 × 1 × 6 mm, TR/TE/FA =7,411 ms/106 ms/90) acquired using a 3T MRI scanner (Siemens Verio) within 2 weeks after symptom onset of AIS.23 The total sequences of T1, T2, DWI, and FLAIR were used to differentiate and quantify PVS. EPVSs were defined as tubular linear when parallel or round ovoid dot-like structures were perpendicular to the imaging plane with a CSF-like signal intensity (hyperintense on T2-weighted images) and a diameter of <3 mm. Different from EPVS, lacunar infarction is usually between 3 mm and about 15 mm in diameter and has a central CSF-like hypointensity with a surrounding rim of hyperintensity on FLAIR images, which EPVS lacks.24 Figure 1 shows the examples of EPVS. For testing the inter-rater reliability of the method, MRI was initially reviewed by two trained raters (N.Y.and L.M.G. Pa radiologist with 2 years of experience) blinded to clinical details. Discrepant ratings were reviewed by a third experienced rater (M.L.).

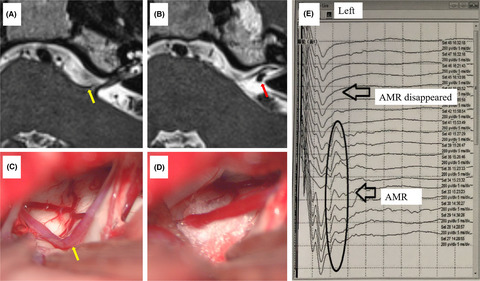
An example of PVS distribution in a patient with post-stroke epilepsy. This was a 65-year-old woman presenting with retarded response to callings. She experienced an unprovoked seizure 7 months later. (A) Axial DWI showed acute infarction of left mesial temporal lobe. (B) Axial T2 showed a significantly asymmetric distribution of PVS in CS with more in left side. A similar effect was not observed in BG (C) and MB (D). BG, basal ganglia; CS, centrum semiovale; MB, midbrain; PSE, post-stroke epilepsy
Enlarged PVSs in the infarct and contralateral hemispheres, or left and right for healthy controls were systematically assessed at three locations: basal ganglia (BG), centrum semiovale (CS), and midbrain (MB). The numbers of EPVS were graded as previously described25: for BG and CS, 0 = No, 1 = 1–10 EPVS (mild), 2 = 11–20 EPVS (moderate), 3 = 21–40 EPVS (frequent), 4=>40 EPVS (severe); for MB, 0 = No EVPS visible and 1 = EPVS visible. All relevant three slices for each location were reviewed, and the slice with the highest number of EPVS for the corresponding location was used for counting.
The assessment of EPVS asymmetry was modified from previously described methods.17, 18 The difference between the right and left side at each location was calculated as an asymmetry index (AI):
 , with 0≤AI≤1, J = region, L/R = left/right.where SJLand SJR are the number of EPVS in the left and right sides of the same observed region.
The total number of PVS of whole brain (ST) was defined the sum of the EPVS values in the three locations:
ST = SBG+ SCS+ SMB.
EPVS AI of the whole brain (AIT) was calculated as follows:
 , with 0≤AI≤1.
A higher AI value implies more asymmetric distribution of EPVS in the brain. As an unbalanced distribution of EPVS at some levels may be observed in healthy controls,17, 18 we used a threshold of AI ≥0.2 to define a high asymmetry in EPVS distribution, in accordance with Duncan et al 2018,18 indicating that >60% of EPVSs were in one hemisphere. Based on this cutoff, an AI score of 0 (<0.2) and 1 (≥0.2) was assigned to each brain region.
2.5 Statistical analysisTo measure inter-rater reliability, the second rater (L.M.G.P) counted EPVS on a subset of 30 cases (20 AIS patients and 10 controls) by the same method. The EPVSs of the remaining patients were counted by one rater (N.Y). The inter-rater reliability was assessed using simple kappa for categorical data (EPVS score in MB), the weighted kappa test for ordinal data (EPVS score in BG and CS), and intraclass correlation coefficients (ICCs) for continuous data (EPVS numbers in BG and CS). For group comparisons, we used Student's t-test for continuous variables, the chi-squared test for categorical data, and the Wilcoxon rank-sum test for ordinal variables. The Spearman rank-order correlation coefficient was used to evaluate the strength and direction of associations of EPVS characteristics with age, sex, NIHSS, stroke causes, infarct location, and AIS treatments.
Multiple logistic regression (forward stepwise: likelihood ratio) was used to identify predictors of PSE. In this model, the presence of PSE was the dependent variable, and EPVS characteristics, age, gender, NIHSS, stroke causes, infarct location, and AIS treatments, were included as independent variables. Purposeful variables in the logistic model were selected based on the unique variable test with p < 0.10 ahead. Multicollinearity was assessed between the independent variables using a linear regression method. All statistical analyses were performed using the SPSS, Version 16. p < 0.01was considered statistically significant, but if there were multiple comparisons between three or more subgroups, a p-value of <0.01/N after the Bonferroni correction was used to indicate the statistical significance (αB) to avoid type 1 error, where N was the number of subgroups.
3 RESULTS 3.1 Inter-rater agreement on EPVS numbers and scoresA total of 30 individuals from the AIS patients (n = 312) and healthy controls (n = 20) were evaluated by both raters to assess inter-rater reliability. Overall, there were moderate-to-good inter-rater agreements on the measurement for EPVS scores and numbers. The kappa values for EPVS scores ranged from 0.50 to 0.92 in the various brain regions examined, and the ICC for EPVS numbers ranged from 0.63 to 0.96. The kappa value was 0.77 (95% confidence interval [CI] 0.70–0.83) for right MB, 0.75 (95% CI 0.68–0.81) for left MB, 0.61 (95% CI 0.50–0.71) for right BG, 0.84 (95% CI 0.77–0.92) for left BG, 0.73 (95% CI 0.63–0.82) for right CS, and 0.73 (95% CI 0.63–0.83) for left CS. There was also good inter-rater agreement of the EPVS numbers between the two raters. The ICC and its 95% CI were 0.837 (0.75–0.90) for right BG, 0.94 (0.90–0.96) for left BG, 0.77 (0.69–0.85) for right CS, and 0.74 (0.63–0.82) for left CS, respectively.
3.2 EPVS characteristics between AIS patients and healthy controlsAmong 1,465 AIS patients during this study period, 312 AIS patients (120 females, 38.5%; mean age 67.46 ± 11.64 years) met the inclusion criteria. The consort diagram of the excluded patients is provided in Figure 2. The patients included were matched by 20 healthy participants (13 females, 65%) as the control group (mean age 61.00 ± 6.79 years; p = 0.015 compared with the AIS patients). The mean follow-up time for all the enrolled AIS patients was 19.3 months (range 12.1–36.3 months). Both the EPVS number and scores were significantly higher in the BG and CS of the AIS group compared to those of the control group. No differences of EPVS numbers or scores were found in MB between the two groups. The AI score was significantly different in BG between the two groups (p < 0.01), but there was no difference in the AI scores of MB. There was no statistical difference of AI scores in the CS, though there was with the AI values (Table 1).

Consort diagram of excluded patients. AIS, acute ischemic stroke; PSE, post-stroke epilepsy
TABLE 1. Comparison of EPVS characteristics between AIS patients and healthy controls Region Basal ganglia Centrum semiovale Midbrain GroupControls
(n = 20)
AIS
(n = 312)
p-valueControls
(n = 20)
AIS
(n = 312)
p-valueControls
(n = 20)
AIS
(n = 312)
p-valueEPVS number
(mean ± SD)
R 13.80 ± 4.05 24.78 ± 14.68 0.000 10.40 ± 3.84 21.38 ± 14.36 0.000 1.40 ± 1.23 0.98 ± 1.27 0.151 L 13.90 ± 4.69 24.58 ± 14.43 0.000 9.80 ± 3.11 19.55 ± 12.85 0.000 1.60 ± 1.23 1.06 ± 1.28 0.069 EPVS scores R 0 0 0 0.003 0 0 0.000 6 (30.0%) 156 (50.0%) 0.083 1 4 (20.0%) 40 (12.8%) 14 (70.0%) 86 (27.6%) 14 (70.0%) 156 (50.0%) 2 14 (70.0%) 124 (39.7%) 6 (30.0%) 88 (28.2%) 3 2 (10.0%) 100 (32.1%) 0 104 (33.3%) 4 0 48 (15.4%) 0 34 (10.9%) L 0 0 0 0.000 0 0 0.000 6 (30.0%) 148 (47.4%) 0.130 1 6 (30.0%) 44 (14.1%) 16 (80.0%) 78 (25.0%) 14 (70.0%) 164 (52.6%) 2 12 (60.0%) 102 (32.7%) 4 (20.0%) 118 (37.8%) 3 2 (10.0%) 118 (37.8%) 0 94 (30.1%) 4 0 48 (15.4%) 0 22 (7.1%) AI 0.08 ± 0.07 0.18 ± 0.15 0.003 0.06 ± 0.07 0.18 ± 0.15 0.001 0.27 ± 0.41 0.45 ± 0.45 0.067 AI scores 0 20 (100%) 192 (61.5%) 0.001 18 (90%) 202 (64.7%) 0.021 12 (60%) 140 (44.9%) 0.189 1 0 120 (38.5%) 2 (10.0%) 110 (35.3%) 8 (40.0%) 172 (55.1%) Note EPVS scores in BG and CS: 0 = no EPVS visible; 1 = 1–10 EPVS (mild); 2 = 11–20 EPVS (moderate); 3 = 21–40 EPVS (frequent); 4 => 40 EPVS (severe); PVS scores in MB: 0 = no EVPS visible; 1 = one or more EVPS visible. p values were from the comparison with control group. AI scores: 0 = AI < 0.2, 1 = AI ≥0.2. Abbreviation: AI, asymmetric index; L, left; R, right. 3.3 Relevant factors for EPVS characteristics of AIS patientsIn AIS patients, total EPVS numbers (BG, CS, and MB combined) increased with age (Pearson correlation, r = 0.22, p < 0.000). The scores and numbers of EPVS were not associated with stroke subtypes (duration time of symptoms before treatment, treatment methods after stroke, stroke causes stroke laterality, and infarct number) or severity (NIHSS at admission) (all p > 0.01).
The scores, numbers, and AI of EPVS at each observed region were not statistically different between in the unilateral stroke (n = 286) and bilateral stroke (n = 26) (all p > 0.01). Among the patients with unilateral stroke (n = 286), no significant differences of EPVS numbers (p = 0.61 in BG; t = 0.77, p = 0.44 in CS; t = 1.47, p = 0.14 in MB) and scores (p = 0.12 in BG and p = 0.24 in CS by the Kolmogorov-Smirnov test; p = 0.28 in MB by likelihood ratio) were found between the infarct side and the noninfarct side.
3.4 Clinical characteristics between AIS without epilepsy and with PSEFifty-eight (18.59%) of the 312 patients developed PSE with a median time of 36 days after stroke (range: 8 days-304 days). The mean follow-up time was 16.3 months (range: 12.2–25.1 months) for PSE patients and 19.2 months (range: 12.1–36.3 months) for the AIS patients without epilepsy. As shown in Table 2, compared to the nonepilepsy AIS group, the PSE patients were younger, had higher NIHSS at admission, higher proportions of cortical lesions, and higher proportions of large-artery atherosclerosis and cardioembolic strokes. There were no differences in sex distribution, stroke laterality, and infarct numbers between the AIS without epilepsy and PSE patients.
TABLE 2. Clinical characteristics of nonepilepsy AIS and PSE patientsNonepilepsy AIS
(n = 254)
PSE
(n = 58)
p-value αB Age (years) 68.29 ± 12.00 63.83 ± 9.16* 0.002 Gender Male 152 (59.8%) 40 (69.0%) 0.232 Female 102 (40.2%) 18 (31.0%) Duration of symptoms (days) 3.11 ± 3.46 3.06 ± 3.08 0.914 NIHSS at admission* 0 8 (3.1%) 0 (0%) 0.000 1–4 30 (11.8%) 0 (0%) 5–15 118 (46.5%) 22 (39.9%) 16–20 70 (27.6%) 18 (31.0%) 21–42 28 (11.0%) 18 (31.0%) Stroke laterality Left 148 (58.3%) 30 (51.7%) 0.045 0.003 Right 90 (35.4%) 18 (31.0%) Both 16 (6.3%) 10 (17.2%) Infarct number Unifocal 150 (59.1%) 26 (44.8%) 0.049 Multifocal 104 (40.9%) 32 (55.2%) Stroke region Single-lobe cortical 26 (10.2%) 18 (31.0%)* 0.000 Cerebellum 12 (4.7%) 2 (3.4%) Brainstem 34 (13.4%) 0 (.0%) 0.000 BG 50 (19.7%) 10 (17.2%) CS 82 (32.3%) 2 (3.4%) Multilobe cortical 46 (18.1%) 22 (37.9%)* PC+AC 4 (1.6%) 4 (6.9%) Stroke causes Large artery atherosclerosis 74 (29.1%) 30 (51.7%)* 0.000 Cardioembolism 24 (9.4%) 12 (20.7%) 0.000 Small-vessel occlusion 138 (54.3%) 8 (13.8%) Other causes 18 (7.1%) 8 (13.8%) AIS treatment Anticoagulated or platelet therapy 194 (76.4%) 40 (69.0%) 0.172 Thrombolysis 16 (6.3%) 8 (13.8%) 0.003 MT 26 (10.2%) 4 (6.9%) Thrombolysis and MT 18 (7.1%) 6 (10.3%) Abbreviations: BG, basal ganglia; CS, centrum semiovale; MT, mechanical thrombectomy; PC+AC, posterior circulation and anterior circulation stroke; PSE, post-stroke epilepsy. 3.5 EPVS characteristics between the AIS without epilepsy and PSE patientsAs shown in Table 3, there were no significant differences in EPVS scores of bilateral BG, CS, and MB between the PSE group and the nonepilepsy AIS group. There were also no significant differences on the total EPVS numbers and AI values between the PSE group and the nonepilepsy AIS group. The marked differences of AI score in the CS and midbrain region were found between the PSE group and the nonepilepsy AIS group (p = 0.004). There was no statistical difference of AI scores in the MB for the PSE and nonepilepsy AIS groups, though there was with the AI values. The AI score was not significantly different between groups in the other brain regions, or in the whole brain.
TABLE 3. Comparison of EPVS characteristics between patients with and without post-stroke epilepsy Region Basal ganglia Centrum semiovale Midbrain GroupNonepilepsy AIS
(n = 254)
PSE
(n = 58)
p-valueNonepilepsy AIS
(n = 254)
PSE
(n = 58)
p-value Nonepilepsy AIS (n = 254)PSE
(n = 58)
p-value EPVS number R 25.40 ± 15.00 22.03 ± 12.98 0.115 21.10 ± 14.41 22.59 ± 14.14 0.478 1.01 ± 1.27 0.86 ± 1.23 0.429 L 25.08 ± 14.34 22.41 ± 14.76 0.205 19.65 ± 13.17 19.14 ± 11.42 0.786 1.11 ± 1.31 0.86 ± 1.11 0.183 EPVS scores R 0 0 0 0.025 0 0 0.489 124 (48.8%) 32 (55.2%) 0.383 1 32 (12.6%) 8 (13.8%)
留言 (0)