
記住我

Autism spectrum disorder (ASD) affects the development of multiple cognitive and behavioral abilities. The diverse range of clinical issues associated with ASD hinders progress identifying neurodevelopmental mechanisms. Sensorimotor behaviors represent a promising target for advancing knowledge of neurodevelopmental mechanisms of ASD because they are frequently disrupted (Coll, Foster, Meilleur, Brambati, & Hyde, 2020), predictive of worse outcomes (Bal et al., 2020; Nebel et al., 2016), familial (Mosconi et al., 2010; Schmitt et al., 2019), and supported by well understood and highly specialized brain networks. Quantitative studies of sensorimotor behavior and brain function in ASD may advance a more mechanistic understanding of the disorder.
Individuals with ASD show a range of sensorimotor abnormalities including repetitive motor mannerisms (American Psychiatric Association, 2013), less precise saccadic eye movements (Johnson, Rinehart, White, Millist, & Fielding, 2013; Schmitt, Cook, Sweeney, & Mosconi, 2014; Takarae, Minshew, Luna, & Sweeney, 2004), increased postural sway (Bojanek, Wang, White, & Mosconi, 2020; Wang et al., 2016), and dyspraxia (MacNeil & Mostofsky, 2012). Multiple studies converge to suggest that individuals with ASD show reduced ability to integrate visual or multi-sensory feedback during motor behavior (Haswell, Izawa, Dowell, Mostofsky, & Shadmehr, 2009; Sharer et al., 2015). Consistent with this hypothesis, we have found that individuals with ASD show greater motor variability and reduced entropy during visually guided precision gripping implicating deficient visual feedback control of motor behavior (Mosconi et al., 2015; Neely et al., 2019; Wang et al., 2016).
During visually guided motor behavior (i.e., visuomotor behavior), visual feedback is processed in visual and posterior parietal cortices, including superior (SPL) and inferior parietal lobules (IPL), which project to premotor and primary motor cortices (M1; Caminiti, Ferraina, & Johnson, 1996; Vaillancourt, Mayka, & Corcos, 2006). Visuomotor behavior is supported by a subcortical circuit in which feedback information is relayed from posterior parietal cortex to cerebellum where error information is translated into reactive motor commands to M1 (Glickstein, 2000; Glover, Wall, & Smith, 2012; Stein & Glickstein, 1992). Posterior cerebellum and basal ganglia, including putamen and caudate, are involved in modulating motor output timing and amplitude (Prodoehl, Yu, Wasson, Corcos, & Vaillancourt, 2008; Spraker et al., 2012). The function of these networks is consolidated throughout childhood and early adulthood as evidenced by strengthening of long-distance cerebellar-cortical pathways and weakening of local functional circuits (Amemiya et al., 2019). Developmental studies of visuomotor network function in ASD identified increases in cerebellar–cortical functional connectivity in childhood (Stoodley et al., 2017) that become more severe during adolescence and adulthood (Holiga et al., 2019). Despite evidence that task-based functional magnetic resonance imaging (fMRI) approaches to assessing functional connectivity provide more robust predictors of behavioral trait dimensions than resting state (Greene, Gao, Scheinost, & Constable, 2018), few studies have assessed task-dependent functional connectivity of visuomotor networks in ASD or their variance across childhood and adulthood.
Several studies have assessed visuomotor network activation in ASD. Takarae, Minshew, Luna, and Sweeney (2007) reported reduced frontal and parietal eye field and cerebellar activation during saccades in adults with ASD relative to typically developing (TD) controls. Individuals with ASD also showed greater activity in frontal, striatal, and cerebellar regions suggesting increased involvement of cognitive control networks. Finger tapping studies have also documented aberrant frontal, parietal and cerebellar activity in ASD (Allen & Courchesne, 2003; Allen, Muller, & Courchesne, 2004; Mostofsky et al., 2009; Muller, Kleinhans, Kemmotsu, Pierce, & Courchesne, 2003; Muller, Pierce, Ambrose, Allen, & Courchesne, 2001). In the one known study to assess functional connectivity during motor behavior, Mostofsky et al. (2009) documented reduced cerebellar–thalamo–cortical functional connectivity alongside increased supplementary motor area activation and reduced cerebellar activation in ASD during finger tapping. While finger-tapping studies have been important for identifying gross motor impairment, studies of fine motor control, such as during precision gripping, allow for interrogation of the visuomotor system in a way that more accurately represents functional motor behaviors. We previously have described fMRI task activation increases in ventral premotor cortex and cerebellum during a precision gripping task in ASD (Unruh et al., 2019). While the majority of motor behaviors are guided by visual feedback, and visuomotor behaviors are impaired in ASD, no known fMRI studies have examined brain network function and connectivity in ASD during visually guided precision motor behavior.
Using fMRI, we assessed visuomotor network activation and functional connectivity during precision gripping. We predicted that, relative to TD controls, individuals with ASD would show increased grip force variability and reduced force entropy. Based on prior behavioral findings that visuomotor impairments in ASD are more severe at high visual feedback gain (Mosconi et al., 2015), we tested behavior and brain function across three visual gain levels. We predicted that increases in force variability and reductions in entropy would be more severe when visual feedback was amplified indicating deficits processing increased sensory information. Consistent with the overarching hypothesis that visuomotor deficits in ASD reflect alterations in dynamically adjusting motor behavior in response to sensory feedback, we predicted individuals with ASD would show reduced activation of visual cortex, posterior parietal cortex, and cerebellum during visuomotor control relative to TD controls. We also expected reduced parietal-cerebellar, parietal-striatal, and parietal-motor cortex functional connectivity in ASD during visuomotor behavior. Individuals were studied across a wide age range (9–35 years) so that age-associated differences in visuomotor behavior and brain network function could be examined. Consistent with prior resting state fMRI studies (Padmanabhan, Lynn, Foran, Luna, & O'Hearn, 2013), we predicted visuomotor brain dysfunctions relative to TD controls would be more severe at older ages.
2 MATERIALS AND METHODS 2.1 ParticipantsTwenty-seven participants with ASD and 30 TD controls were recruited from the community, and group-matched on age (range: 9–35 years), nonverbal IQ, and handedness (Table 1). IQ was assessed using the Wechsler Abbreviated Scale of Intelligence (WASI; Wechsler, 1999). ASD diagnoses were confirmed using the Autism Diagnostic Inventory-Revised (ADI-R; Lord, Rutter, & Le Couteur, 1994), the Autism Diagnostic Observation Schedule (ADOS-2; Lord et al., 1989) and expert clinical opinion using DSM-IV-TR criteria (American Psychiatric Association, 2000). Participants with ASD were excluded if they had a known genetic or metabolic disorder associated with ASD (e.g., fragile X syndrome, tuberous sclerosis). TD control participants were excluded if they had ever been diagnosed with ASD, or reported current or past psychiatric or neurological disorders, family history of ASD in first-, second- or third-degree relatives, or first-degree relative with a developmental or learning disorder, psychosis, or obsessive–compulsive disorder. No participants were taking medications known to affect motor control, including antipsychotics, stimulants, or anticonvulsants (Reilly, Harris, Keshavan, & Sweeney, 2005), nor had a history of head injury, birth injury, or seizure disorder. Participants' uncorrected far visual acuity was at least 20/40. Written informed consent was obtained for adult participants and parental consent was obtained for participants younger than 18 years. Minors provided written assent. Study procedures were approved by the local Institutional Review Board and abided by the Code of Ethics of the World Medical Association (Declaration of Helsinki).
TABLE 1. Demographic characteristics for individuals with ASD and TD controls ASD (N = 27) TD controls (N = 30) t p Age (years) 18.4 ± 6.7 (9–35) 18.9 ± 7.0 (10–35) 0.25 .804 Sex (% male) 88.9% 60.0% 6.12a .013* Handedness (% right-handed) 92.6% 86.7% 1.07a .587 Race 5.21a .266 % White 88.9% 83.3% – – % Black 3.7% 6.7% – – % American Indian or Alaska Native 3.7% 0% – – % Other or unknown 3.7% 0% – – Ethnicity 4.28 .233 % Hispanic/Latinx 14.8% 20% – – Verbal IQ 102.0 ± 19.7 (74–141) 112.7 ± 15.6 (86–149) 2.14 .038* Nonverbal IQ 100.8 ± 19.6 (59–127) 107.8 ± 13.1 (78–143) 1.47 .148 ADI-R (A) 19.9 ± 5.7 (7–28) – – – ADI-R (verbal B) 16.8 ± 3.8 (10–24) – – – ADI-R (C) 5.7 ± 2.4 (3–11) – – – ADOS-2 (total CSS) 7.0 ± 2.2 (3–10) – – – Right hand MVC (Newtons) 73.9 ± 19.6 (40–110) 63.3 ± 15.4 (40–110) −1.60 .112 Note: Values reported as mean ± SD (range). Abbreviations: ADI, Autism Diagnostic Interview—Revised; ADOS, Autism Diagnostic Observation Schedule; CSS, Calculated Severity Score; IQ, intelligence quotient. 2.2 Data acquisition 2.2.1 Visuomotor behavior data acquisitionParticipants used their right thumb and index finger to exert opposing forces on a custom fiber-optic force transducer (Figure 1a; Neuroimaging Solutions), constructed from rigid, nonmetallic material to ensure safety and consistent linearity, sensitivity, and accuracy inside the MR environment. The force signal was transmitted from the transducer via fiber-optic cable to a si425 Optical Sensing Interrogator (Micron Optics), which digitized the force data at 125 Hz. Customized software written in LabVIEW (National Instruments, Austin, TX) converted analog force data to Newtons (N) at a resolution of 0.025 N. Output from the force transducer was presented to the participant using a visual display through a projection system placed on the head coil and a mirror located 35 cm from the participant's eyes inside the MR environment (resolution: 640 × 480 pixels; refresh rate: 60 Hz).

(a) Grip configuration and force transducer. (b) Schematic representation of task condition blocks. Blocks are 26 s in duration. Each condition was repeated three times at each gain level, ending each run with a rest block. (c) Schematic representation of the visuomotor task. The red target bar turned green to cue the beginning of each trial. The white force bar moved upwards with increased force. The force bar traveled a greater distance per change in force for higher relative to lower gains. *Results from the motor only condition in which no visual feedback was provided are not reported due to participants' difficulties remembering to press
2.2.2 MRI data acquisitionMR scans were performed using a 3 Tesla scanner (General Electric Medical Systems, Milwaukee, WI) with a standard birdcage quadrature single channel head coil. Participants lay supine and their heads were stabilized using adjustable padding. Functional images were acquired using a T2* single shot gradient-echo echo-planar pulse sequence: repetition time (TR) = 2000 ms, echo time (TE) = 25 ms, flip angle = 90°, in-plane resolution = 3 × 3 mm, 64 × 64 acquisition matrix, field of view (FOV) = 200 mm, 33 axial slices, 3 mm thickness with 1 mm gap. An anatomical scan was acquired using a T1-weighted 3D inversion recovery fast spoiled gradient recalled pulse (SPGR) sequence: TR = 25 ms, TE = 3 ms, flip angle = 90°, in-plane resolution = 0.9 × 0.9 mm, 256 × 192 acquisition matrix, FOV = 24 × 24, 120 axial slices, 1.5 mm thickness with no gap. Both sequences covered the entire brain.
2.3 Experimental designParticipants completed a 30-min pre-fMRI training session completing at least one run of the fMRI task. The training session ensured participants understood the instructions and were able to complete the task without verbal cues, and also helped eliminate the transitory period of motor learning (Coombes, Corcos, Sprute, & Vaillancourt, 2010). Each participant's maximum voluntary contraction (MVC) was calculated before beginning the fMRI experiment. Participants produced their maximum force against a strain-gauge dynamometer over three trials (Sammons Preston, Rolyan, Bolingbrook, IL). MVC was estimated as the mean maximum value (Mosconi et al., 2015; Vaillancourt, Mayka, & Corcos, 2006).
Three fMRI task runs were administered. During each run, participants completed four task conditions with their right hand in the following order: (1) rest, (2) visuomotor, (3) vision, and (4) motor only. Each condition block was 26 s long. The condition series was administered three times, with an additional rest block at the end of each run (e.g., R-VM-V-M-R-VM-V-M-R-VM-V-M-R; Figure 1b). The duration of each run was 5:38. Each of the three runs followed the same sequence, but the visual gain of feedback was varied. The target force was fixed at 15% of the MVC. During the rest condition, participants viewed a horizontal white force bar and a parallel red target bar (Figure 1b,c). They were instructed to watch the static bars, and ensure they did not press the transducer. During the visuomotor condition, the red target bar turned green at trial onset, and the white force bar moved upwards with increased force and downward with decreased force. Participants were instructed to press when the red target bar turned green, and to keep pressing so that the white force bar stayed as steady as possible matching the green target bar. Vision only trials were administered to assess blood oxygenation level dependent (BOLD) responses to visual motion without force production. Participants viewed the green target bar and the moving force bar, but did not produce force. The force bar oscillated around the target bar, and participants were instructed to watch the screen. The oscillation frequency of the force bar was a 1-Hz sine wave with a small amount of white noise. The amplitude of oscillation matched the visual gain of the run being administered. The motor only condition was administered to assess BOLD responses to motor behavior without visual feedback. During this condition, the target bar remained green, but the force bar disappeared after 1.5 s. Participants were instructed to continue pressing with the same level of force used to reach the target. Due to participants' difficulties remembering to press during the motor only condition, these data are not reported here.
Visual gain was manipulated by changing the visual angle. Visual angle (α) was varied by altering the height of force fluctuations (H1) on the video display, relative to the distance between the participant's eyes and screen (D) using the following formula (Vaillancourt, Haibach, & Newell, 2006): Based on prior studies, we assumed that participants produced force at 6 N with a SD of 0.3 N (Mosconi et al., 2015; Slifkin & Newell, 1999). SD multiplied by six approximated the full range of estimated variance. H1 was varied to approximate three visual angles: 0.018° (low gain), 0.192° (medium gain), and 2.023° (high gain) to obtain values above and below one degree (Vaillancourt, Mayka, & Corcos, 2006). The order of administration of gain levels was counterbalanced across participants.
2.4 Data processing
2.4.1 Visuomotor behavior data processing
Based on prior studies, we assumed that participants produced force at 6 N with a SD of 0.3 N (Mosconi et al., 2015; Slifkin & Newell, 1999). SD multiplied by six approximated the full range of estimated variance. H1 was varied to approximate three visual angles: 0.018° (low gain), 0.192° (medium gain), and 2.023° (high gain) to obtain values above and below one degree (Vaillancourt, Mayka, & Corcos, 2006). The order of administration of gain levels was counterbalanced across participants.
2.4 Data processing
2.4.1 Visuomotor behavior data processing
To examine visuomotor performance, the behavior time series data were processed using a custom LabVIEW program (National Instruments, Austin, TX) (Elliott, Vijayakumar, Zink, & Hansen, 2007) and MATLAB (The MathWorks Inc., Natick, MA). Time series data for each fMRI task run were digitally filtered using a fourth-order Butterworth filter with a 30 Hz low-pass cutoff. To examine sustained force output, the first 2 s and last second of the force trace were excluded for each 26 s visuomotor block. The trace was then linearly detrended to account for changes in mean force over the course of the trial. Mean force was calculated as the average force output of the time series as a measure of individuals' ability to complete the task. The within-trial SD of the force time series was calculated to examine the amplitude of performance variability. To examine the time-dependent structure of the data, approximate entropy (ApEn) was calculated for each trial (Pincus & Goldberger, 1994; Vaillancourt, Slifkin, & Newell, 2001). ApEn reflects the predictability of future values based on previous values. For example, a sine wave has accurate short- and long-term predictability and corresponds to an ApEn near zero. Increases in signal complexity, reflective of the independence of each force value, returns an ApEn near two (e.g., white noise). The same algorithm and parameter settings (m = 2; r = .2*SD of the signal) were applied as in our previous work (McKinney et al., 2019; Mosconi et al., 2015; Slifkin, Vaillancourt, & Newell, 2000; Unruh et al., 2019).
2.4.2 fMRI data processingImaging data were processed using the Analysis of Functional Neuroimages software (AFNI; https://afni.nimh.nih.gov; Cox, 1996). MR data were rejected for head movement artifact and failure to comply with task instructions for seven participants' low gain condition (ASD: 4, TD: 3), four participants' medium gain condition (ASD: 3, TD: 1), and six participants' high gain condition (ASD: 4, TD: 2). Participants were included in group analyses if they successfully completed at least one gain condition. Anatomical images were skull-stripped and nonlinearly warped to Montreal Neurologic Institute (MNI) standard space (Fonov et al., 2011). Functional preprocessing steps followed our previously reported work (McKinney et al., 2020; Unruh et al., 2019). Slice-timing correction was applied. Consecutive volumes with >0.5 mm framewise displacement were censored. Motion censoring data are in Table S1. The percent of TRs censored (gain effect: F(2,95.21) = 0.74, p = .48) and average motion per TR after censoring (gain effect: F(2,95.64) = 2.48, p = .09) were similar across gain levels and groups (percent of TRs censored group effect: F(1,51.78) = 2.05, p = .16; average motion per TR group effect: F(1,51.91) = 1.48, p = .23). Group differences did not vary as a function of gain for either percent of TRs censored (group × gain interaction: F(2,95.21) = 0.31, p = .73) nor average motion per TR (group × gain interaction: F(2,95.63) = 0.74, p = .48).
Remaining functional volumes were rigidly aligned with anatomical data referenced to the minimum outlier volume and warped into standard space. Volumes were spatially smoothed to a 6 mm full-width half-maximum Gaussian kernel and scaled to the mean voxel time-series value of 100. Functional data were regressed using a block function with six motion parameters (X, Y, Z, roll, pitch, yaw) included as nuisance regressor terms. Regression outcomes represent the percent signal change (β) of each contrast of interest (visuomotor—rest; vision—rest; visuomotor—vision) and associated t-statistics.
Separate psychophysiological interaction (PPI), or task-dependent functional connectivity analyses (Cisler, Bush, & Steele, 2014; McLaren, Ries, Xu, & Johnson, 2012) were conducted for eight hypothesis-driven seed regions of interest (ROIs) identified from previous precision gripping studies (Spraker et al., 2012; Vaillancourt, Mayka, & Corcos, 2006), including bilateral IPL, SPL, cerebellar Crus I, and cerebellar lobules V/VI (Figure S1). Cortical ROIs were obtained using Brainnetome, a cortical atlas parcellated from resting-state functional connectivity data of 40 healthy, right-handed adults (Fan et al., 2016). Cerebellar ROIs were obtained using the spatially unbiased infratentorial template (SUIT) cerebellar atlas (Diedrichsen, 2006), created by averaging high-resolution cerebellar/brainstem scans of 20 adults. The average time series of each seed ROI was calculated. A canonical hemodynamic response function (HRF) was calculated for visuomotor, vision, and rest blocks, as were interactions between the ROI time series and visuomotor, vision, and rest functions (i.e., PPI regressors). For each seed region, the seed time series, the 3 HRFs, the 3 PPI regressors, and 12 motion regressors were included in regression models using AFNI's 3dDeconvolve program. Visuomotor-dependent functional connectivity for PPI contrasts of interest (visuomotor—rest) was calculated using AFNI's 3dcalc program.
2.5 Statistical analysisAge, IQ, and MVC were compared between groups (ASD vs. TD controls) using two-sided independent samples t-tests. Handedness and sex were compared between groups using chi-square tests. Non-normally distributed behavioral outcomes (force SD, ApEn) were log-transformed. A series of linear mixed effects models were performed to examine group differences in behavioral outcomes across visual gain levels (low, medium, and high). Mixed effects models were used to estimate missing data and model within subject variation in outcome measures. Age and sex were included as covariates in each model.
Group differences in brain activation and visuomotor-dependent functional connectivity were identified with linear mixed effects modeling using AFNI's 3dLME program (Chen, Saad, Britton, Pine, & Cox, 2013). Separate 2 (group) × 3 (gain) models with group × gain and group × age interaction terms were examined for visuomotor—rest, vision—rest, and visuomotor—vision contrasts. Sex was included in each model as a covariate of no interest. A group-level mask (3dmask_tool) was applied to all 3dLME output to include voxels present in at least 50% of the data sets. Auto-correlation function (ACF) estimates derived from residual data were averaged across the sample and entered into AFNI's 3dClustSim program to estimate family-wise error correction at α < .05. Based on this, we report significant clusters with at least 57 contiguous voxels (1,539 mm3) at voxel-wise p < .005 for group contrasts and group interactions. To better differentiate large clusters of activation observed in main effect tests of visual feedback gain, a more stringent voxel-wise threshold of p < .001 and 23 contiguous voxels (621 mm3) was used to achieve corrected α < .05.
Linear mixed effects models were conducted to examine relationships between brain outcomes and behavioral and clinical variables. Maximum BOLD signal for individual participants for each significant cluster in group-contrast analyses was extracted using the clusters as masks. Comparison variables included force SD and ApEn (both groups); and clinical measures (ASD only), including scores for the ADOS (overall calculated severity score) and ADI (diagnostic algorithm scores for each subscale). Due to the exploratory nature of these analyses, we report as significant all relationships with uncorrected p < .05.
3 RESULTS 3.1 Visuomotor behavior performanceIndividuals with ASD and controls showed similar MVCs (Table 1; ASD: range: 40–110 N; TD: range: 34–88 N). Mean force was similar across gain levels (gain main effect: F(2,104.31) = 0.06, p = .94) and groups (Figure 2a; group main effect: F(1,52.15) = 1.67, p = .20). There was no interaction of group by gain level for mean force (group × gain interaction: F(2,104.37) = 0.10, p = .91). Mean force was greater in older participants (age main effect: F(1,52.14) = 11.14, p < .005), though age-associated increases in mean force were similar across groups (group × age interaction: F(1,51.99) = 0.61, p = .44).

Results of the mixed effects models for behavioral force measures, controlling for age and sex. (a) Mean force was not different in individuals with ASD and TD controls, nor did it scale with gain. (b) Force SD significantly decreased with increasing gain (gain main effect), and was higher in individuals with ASD overall (Group main effect). There was also a significant interaction of gain and group, such that individuals with ASD showed greater force SD compared to TD controls at high gain, but not at low or medium gain. (c) Approximate Entropy (ApEn) significantly increased with increasing gain (gain main effect), and also was reduced in ASD relative to TD controls (Group main effect). No gain by group interaction was observed, though post-hoc group comparisons are presented for ease of comparison
Force SD decreased with increases in visual gain (Figure 2b; gain main effect: F(2,103.82) = 80.10, p < .001). Individuals with ASD showed elevated force SD compared to TD controls (group main effect: F(1,52.60) = 6.99, p = .01; Figure 2b), and group differences varied as a function of gain (group × gain interaction: F(2,103.90) = 3.39, p = .04). Post-hoc analyses revealed that individuals with ASD showed increased force variability compared to TD controls at high gain (t98.3 = 3.70, p < .005), but not at low (t102.6 = 1.41, p = .72) nor medium gain (t106.7 = 1.40, p = .73). Force SD decreased as a function of increased age (age main effect: F(1,52.54) = 5.70, p = .02). Age-associated differences were similar across groups (group × age interaction: F(1,52.33) = 0.13, p = .72).
ApEn increased with increases in visual gain (Figure 2c; gain main effect: F(2,104.66) = 129.16, p < .001). Individuals with ASD showed reduced ApEn (i.e., reduced force entropy) compared to TD controls (Figure 2c; group main effect: F(1,51.75) = 8.33, p < .01), and the magnitude of this difference was similar across gain levels (group × gain interaction: F(2,104.75) = 1.45, p = .24). Increased age was associated with greater ApEn (age main effect: F(1,51.87) = 9.53, p < .005), and age-associated increases in ApEn were similar across groups (group × age interaction: F(1,51.60) = 1.05, p = .31).
3.2 Brain activation resultsBrain activation results are described as contralateral (i.e., left hemisphere) or ipsilateral (i.e., right hemisphere) relative to motor behavior with the right hand. In the visuomotor—rest contrast, BOLD activation of multiple regions of the visuomotor network scaled with increases in visual gain, including bilateral posterior parietal cortex (V5, SPL), bilateral primary (M1) and premotor cortex, bilateral cerebellar Crus I, bilateral middle cingulate cortex, contralateral (i.e., left, relative to the right hand used in the experiment) middle occipital gyrus, and ipsilateral (i.e., right) supramarginal gyrus. Figure S2 and Table S2 show brain regions with BOLD activation that scaled with visual gain during visuomotor behavior (gain main effect).
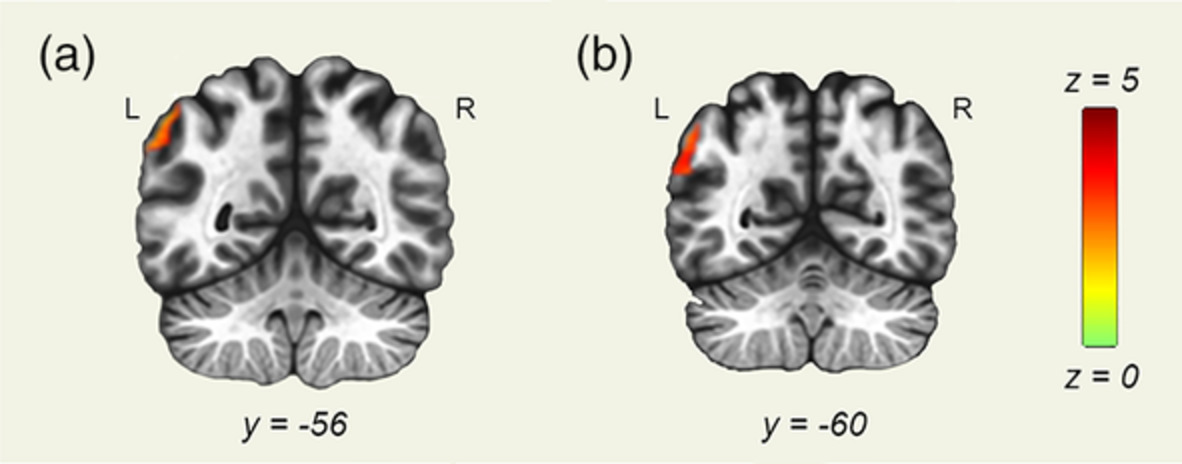
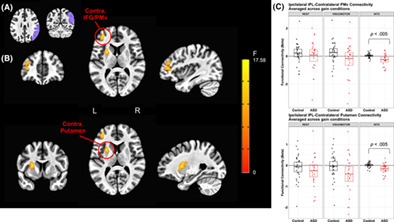
Five regions showed significant group × gain level effects (Figure 3; Table 2), including bilateral SMA, bilateral SPL, contralateral middle frontal gyrus (MFG), and contralateral inferior frontal gyrus (IFG). Except for contralateral IFG, brain activation in these regions scaled with gain level more strongly in individuals with ASD relative to TD controls resulting in increased activation in ASD compared to TD at high gain (Table S3). For contralateral IFG, this pattern of activation was similar, although the groups were not significantly different at high gain. Additionally, there was a significant group × age effect in bilateral medial visual cortex (F(1,50) = 15.30, p < .005). Activation in bilateral V1 increased with age in ASD, but decreased with age in TD controls.

(a) Axial slices showing regions with activation that scaled with gain level for visuomotor—rest contrasts for individuals with ASD more than for TD controls. The color bar ranges from F = 0 to F = 15.64, with an activation threshold of α < .05, corrected for multiple comparisons. (b) Individuals with ASD show increased SMA activation relative to TD that scaled in severity with increases in gain. (c) Ipsilateral (right) superior parietal lobule activation was greater in ASD compared to TD, especially during high gain
TABLE 2. Brain regions showing significant group × visual gain interactions in activation in the linear mixed effects model (3dLME), controlling for age and sex Cluster size (mm3) Peak z-value Peak activation location (MNI) α Low gain Med gain High gain X Y Z Visuomotor—rest SMA 5,157 −1.95 2.45 6.39 1 7 52 <.01 IL SPL 2,592 −2.27 3.66 3.97 25 −56 52 <.01 CL SPL 2,430 −3.13 2.96 3.92 −32 −53 67 <.01 CL IFG 1863 −3.60 2.81 3.05 −50 19 −2 <.02 CL MFG 1728 −2.64 2.98 4.62 −56 16 34 <.03 Vision—rest N.S. – – – – – – – – Visuomotor—vision N.S. – – – – – –
留言 (0)