
記住我


Pancreatic ductal adenocarcinoma (PDAC) is a common cause of cancer-related mortality among men and women worldwide, with a 5-year overall survival (OS) of only 3%.1, 2 At time of diagnosis, the majority of the patients present with locally advanced or metastatic disease.3 Only one-fifth of the patients is able to undergo resection.2, 4 However, resection alone does not overcome the risk of local or distant recurrent disease in the majority of patients.5
A beneficial effect of adjuvant chemotherapy on the risk of recurrence and OS in PDAC was first shown by Oettle et al in 2007.6 Ever since, several randomized controlled trials have studied the efficacy of various adjuvant chemotherapeutics in patients with PDAC who underwent resection.7-11 For many years, gemcitabine monotherapy (GEM) has been the preferred adjuvant treatment in Western countries.12, 13 Based on promising results in the metastatic setting, the use of combination therapies has emerged.14-17 In 2017, the ESPAC-4 trial compared adjuvant gemcitabine plus capecitabine (GEMCAP) with GEM alone.10 The median OS for patients treated with GEMCAP was 28.0 months compared to 25.5 months for patients treated with GEM (hazard ratio [HR]: 0.82, 95% confidence interval [CI] 0.68-0.98, P = .032) with an acceptable level of treatment-related adverse events. The secondary analysis and long-term results confirmed the survival benefit as well as the decreased risk of developing local recurrence with GEMCAP treatment.18, 19 In 2018, Conroy et al showed the longest estimated survival thus far, with a median OS of 54.4 months in patients receiving adjuvant modified FOLFIRINOX (fluorouracil, leucovorin, irinotecan and oxaliplatin) compared to 35.0 months with GEM (HR: 0.64, 95% CI 0.48-86, P = .003).11 This evident survival advantage came at the cost of increased chemotherapy-related adverse events in patients treated with modified FOLFIRINOX (mFOLFIRINOX). As a consequence, international guidelines recommend adjuvant mFOLFIRINOX only in patients with a good performance status.12, 20-22 In patients with impaired performance status, both adjuvant GEM and GEMCAP can be offered as alternative treatment. In the Netherlands, GEM was approved as adjuvant therapy in 2008 and recommended in the national guideline published in 2011.23, 24 In the 2019 guideline update, the option GEMCAP was added for patients unfit for mFOLFIRINOX.20, 25
Evidence on the added value of capecitabine to adjuvant GEM monotherapy in PDAC is limited to the ESPAC-4 trial. Since clinical trial results cannot always be reproduced in real-world setting, our study aimed to assess whether adjuvant GEMCAP is associated with superior OS compared to adjuvant GEM in a Dutch nationwide cohort.
2 METHODS 2.1 Data collectionThis retrospective study used data from the nationwide Netherlands Cancer Registry (NCR). The NCR is a population-based registry including all patients with a newly diagnosed malignancy in the Netherlands since 1989, notified by the nationwide automated pathological archive (PALGA) and supplemented with the National Registry of Hospital Care (DHD-LBZ). Information on patient and tumor characteristics, treatment and clinical outcomes are routinely extracted from the medical records using standardized definitions by trained administrators of the NCR. Patient characteristics included sex, age, performance status and information on comorbidities according to the Charlson Comorbidity Index.26 Tumor characteristics included the origin and morphology of the tumor classified according to the International Classification of Diseases for Oncology (ICD-O-3, pp. 69-218), tumor size, number of positive lymph nodes, resection margin status (≥1 mm as R0), tumor differentiation grade, TNM classification and corresponding disease stage.27, 28 For our study, the TNM classification was converted to the 8th edition of the American Joint Committee on Cancer for all patients, using pathological tumor size and number of positive lymph nodes.29 The definitions of pT1 and pT4 were identical between the 7th and 8th edition, and were therefore used for uniform staging. pT2 and pT3 definitions differed between both editions and thus staging of these tumors was based on tumor size according to the 8th edition. Treatment specifications included type and timing of surgery, number of cycles and type of adjuvant treatment. Clinical outcomes included survival data, which was obtained by annual linkage with the nationwide Municipal Personal Records Database including the vital status of all Dutch inhabitants. Follow-up was completed until 1 February 2021.30
2.2 Study populationFor the current study, all patients aged ≥18 years with PDAC (ICD-O C25 excluding C25.4, see Table S1 for morphology codes) diagnosed from 2015 to 2019 who underwent a resection were selected from the NCR. Additional inclusion criteria were treatment with adjuvant GEM monotherapy or adjuvant GEMCAP. All patients who received at least one cycle were included. Exclusion criteria were metastatic (stage IV) disease, a resection with macroscopic residual tumor (R2), and neoadjuvant therapy and adjuvant chemotherapy received outside of the Netherlands.
2.3 Treatment and outcome measuresThe primary endpoint was OS, measured from start of chemotherapy until death from any cause. Patients alive at last follow-up were censored. Secondary endpoints included the annual number and proportion of patients receiving GEMCAP or GEM, the number of adjuvant chemotherapy cycles, the number of patients who switched to other adjuvant chemotherapy and the percentage of patients who completed the planned six adjuvant treatment cycles.
2.4 Statistical analysisClinicopathologic characteristics were summarized for all patients and for GEMCAP and GEM separately. Data were presented as frequencies with proportions for categorical variables and median with interquartile range (IQR) for continuous variables. For categorical variables, the χ2 test was used to compare the treatment groups as appropriate. For continuous variables, the Wilcoxon rank sum test was used. Median follow-up was calculated with the reverse Kaplan-Meier method. OS was estimated using the Kaplan-Meier method and difference in survival between the two treatment groups was analyzed using the log-rank test. In addition, univariable and multivariable Cox regression analyses were performed to assess the treatment effect expressed as HR with corresponding 95% CI, corrected for known and available prognostic factors (sex, age, WHO performance status, location, pathological tumor size, lymph nodes, resection margin and tumor differentiation). Multiple imputation of missing data was performed using 25 imputed datasets with variable estimates obtained with the use of Rubin's rules. Imputation was performed for WHO performance status (n = 279), tumor size (n = 213), resection margin (n = 20) and tumor differentiation (n = 109). The proportional hazards assumption was assessed by visualization of Schoenfeld residuals and the log(−log[survival]) vs log of survival time graph. The proportional hazards assumption was not violated for any of the included variables. Results of the Cox regression analyses were presented as HR with 95% CI. Furthermore, the treatment effect of GEMCAP vs GEM was assessed in prespecified subgroups using a Cox regression model with subgroups based on sex, age, WHO performance status, comorbidities, tumor location, stage, pathological tumor size, lymph nodes, resection margin and tumor differentiation. Interaction was tested by adding the interaction term in the model with the P-value of the interaction term as indicator of possible interaction. The χ2 test was used to compare the proportion of patients who completed at least six cycles of adjuvant chemotherapy and the proportion of patients who received three or less cycles of adjuvant chemotherapy between the two treatment groups. All tests were two-sided and values <.05 were considered statistically significant. All analyses were performed using R software, version 3.4.3.
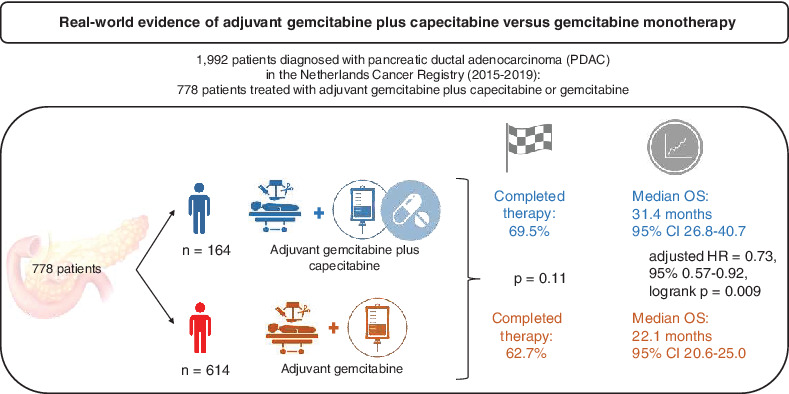
3 RESULTSThe NCR database contained data on 1992 patients who underwent resection for PDAC in the period 2015 to 2019. After applying the prespecified eligibility criteria, 778 patients were included, of whom 164 (21.1%) received adjuvant GEMCAP and 614 (78.9%) received adjuvant GEM (Figure 1). Fifty-four percent of the patients were male, the median age was 67 years (IQR 59-72) and 60.7% of the patients had WHO performance status 0 (Table 1). Most patients were diagnosed at stage II (41.0%), followed by stage III (36.5%) and stage I (22.5%). No statistically significant differences in characteristics were seen between treatment groups. Median time (IQR) from resection to start of adjuvant chemotherapy was 54.0 days (42.0-71.0) for patients treated with GEMCAP and 52.0 days (42.2-64.0) for patients treated with GEM (P = .332).

Selection of the study population. GEM, gemcitabine monotherapy; GEMCAP, gemcitabine with capecitabine
TABLE 1. Baseline characteristics N Overall 778 GEMCAP 164 GEM 614 P-value Sex, n (%) .077 Male 420 (54.0) 78 (47.6) 342 (55.7) Female 358 (46.0) 86 (52.4) 272 (44.3) Age, years (median [IQR]) 67.0 [59.0, 72.0] 66.0 [58.0, 71.0] 67.0 [60.0, 72.0] .118 WHO performance status, n (%) .455 WHO 0 303 (60.7) 62 (64.7) 241 (59.8) WHO 1 161 (32.3) 26 (27.1) 135 (33.5) WHO 2-3 35 (7.0) 8 (8.3) 27 (6.7) Concurrent conditions, n (%) .559 None 332 (48.2) 73 (50.7) 259 (47.5) Any 357 (51.8) 71 (49.3) 286 (52.5) Tumor location, n (%) .505 Other 148 (19.4) 34 (21.2) 114 (18.9) Head 615 (80.6) 126 (78.8) 489 (81.1) Type of resection, n (%) .452 Pancreatectomy 647 (84.6) 127 (83.6) 520 (84.8) Body/tail resection 110 (14.4) 22 (14.5) 88 (14.4) Total pancreatectomy 8 (1.0) 3 (2.0) 5 (0.8) Time to adjuvant chemo (days), (median [IQR]) 52.0 [42.0, 64.8] 54.0 [42.0, 71.0] 52.0 [42.2, 64.0] .332 Pathological tumor stagea, n (%) .889 I 134 (22.5) 38 (23.9) 96 (22.0) II 244 (41.0) 64 (40.3) 180 (41.3) III 217 (36.5) 57 (35.8) 160 (36.7) Pathological tumor size, n (%) .156 <30 mm 245 (42.0) 75 (47.2) 170 (40.1) ≥30 mm 338 (58.0) 84 (52.8) 254 (59.9) Lymph nodes, n (%) .912 Negative 199 (25.6) 43 (26.2) 156 (25.4) Positive 579 (74.4) 121 (73.8) 458 (74.6) Resection marginb, n (%) .054 R0 424 (55.9) 74 (48.7) 350 (57.8) R1 334 (44.1) 78 (51.3) 256 (42.2) Tumor differentiation, n (%) .086 Well 93 (13.9) 24 (16.9) 69 (13.1) Moderate 408 (61.0) 92 (64.8) 316 (60.0) Poor/undifferentiated 168 (25.1) 26 (18.3) 142 (26.9) Note: Percentage of missing data (overall/GEMCAP/GEM): sex (0%/0%/0%), age (0%/0%/0%), WHO performance status (36%/41%/34%), concurrent conditions (11%/24%/11%), location (2%/2%/2%), type of resection (2%/7%/0%), time to adjuvant chemo (0%/0%/0%), pathological tumor stage (24%/3%/29%), pathological tumor size (27%/1%/3%), lymph nodes (0%/0%/0%), resection margin (3%/7%/1%) and tumor differentiation (14%/13%/14%). Abbreviations: GEM, gemcitabine; GEMCAP, gemcitabine with capecitabine; IQR, interquartile range; WHO, World Health Organization.The number of patients receiving GEM decreased and the administration of GEMCAP increased from 2015 to 2018, although the absolute number of patients receiving GEMCAP decreased in 2019 (Figure 2).
 Number of patients receiving gemcitabine with capecitabine (GEMCAP) or gemcitabine monotherapy (GEM) over time [Color figure can be viewed at wileyonlinelibrary.com]
3.1 Overall survival
Number of patients receiving gemcitabine with capecitabine (GEMCAP) or gemcitabine monotherapy (GEM) over time [Color figure can be viewed at wileyonlinelibrary.com]
3.1 Overall survival
The median follow-up time for patients alive at last follow-up was 33.5 months for patients treated with GEMCAP and 50.8 months for patients treated with GEM. Median OS for patients treated with GEMCAP was 31.4 months (95% CI 26.8-40.7) compared to 22.1 months (95% CI 20.6-25.0) for patients treated with GEM (unadjusted HR: 0.71, 95% CI 0.56-0.90, P = .004; Figure 3).
 Overall survival, by type of adjuvant chemotherapy. Hazard ratio for death: 0.71 (95% CI: 0.56-0.90), log-rank P = .0038*. GEM, gemcitabine monotherapy; GEMCAP, gemcitabine with capecitabin [Color figure can be viewed at wileyonlinelibrary.com]
Univariable analyses showed that besides treatment, the location of the primary tumor, tumor size, lymph node involvement, resection margin and tumor differentiation were all associated with OS (Table 2). Independent predictors of survival were tumor size, lymph node involvement, resection margin, tumor differentiation and treatment (GEM vs GEMCAP; HR: 0.73, 95% CI 0.58-0.93, P = .010).
TABLE 2. Univariable and multivariable cox regression analysis of overall survival Number of patients Univariable analysis Multivariable analysis HR (95% CI) P value HR (95% CI) P value Treatment GEM 614 1 [Reference] 1 1 [Reference] 1 GEMCAP 164 0.71 (0.56-0.90) .004a 0.73 (0.58-0.93) .010a Sex Male 420 1 [Reference] 1 1 [Reference] 1 Female 358 0.97 (0.82-1.16) .767 0.98 (0.82-1.17) .810 Age <65 years 310 1 [Reference] 1 1 [Reference] 1 ≥65 years 468 0.96 (0.79-1.16) .656 0.94 (0.79-1.13) .538 Performance status WHO 0 303 1 [Reference] 1 1 [Reference] 1 WHO 1 161 1.18 (0.95-1.46) .179 1.08 (0.87-1.35) .486 WHO 2-3 35 0.93 (0.58-1.50) .934 0.93 (0.58-1.49) .754 Tumor location Other 148 1 [Reference] 1 1 [Reference] 1 Head 615 1.29 (1.03-1.62) .029a 1.25 (0.99-1.58) .062 Pathological tumor size <30 mm 245 1 [Reference] 1 1 [Reference] 1 ≥30 mm 338 1.70 (1.39-2.09) <.001a 1.54 (1.26-1.89) <.001a Lymph nodes Negative 199 1 [Reference] 1 1 [Reference] 1 Positive 579 1.83 (1.48-2.27) <.001a 1.56 (1.25-1.94) <.001a Resection margin R0 424 1 [Reference] 1 1 [Reference] 1 R1 334 1.44 (1.21-1.71) <.001a 1.38 (1.15-1.65) <.001a Tumor differentiation Well 93 1 [Reference] 1 1 [Reference] 1 Moderate 408 1.57 (1.17-2.10) .003a 1.50 (1.11-2.03) .008a Poor/undifferentiated 168 2.35 (1.72-3.21) <.001a 2.12 (1.54-2.93) <.001a Note: Imputation of missing data: sex (0%), age (0%), WHO performance status (36%), location (2%), pathological tumor size (27%), lymph nodes (0%), resection margin (3%) and tumor differentiation (14%). Abbreviations: CI, confidence interval; GEM, gemcitabine; GEMCAP, gemcitabine with capecitabine; HR, hazard ratio; WHO, World Health Organization.Subgroup analyses demonstrated comparable or superior survival with adjuvant GEMCAP in almost all subgroups (Figure 4). A significant interaction was found between tumor location and treatment (P = .02), with a significant benefit of GEMCAP in patients with a tumor located in the pancreatic head (HR: 0.65, 95% CI 0.50-0.85, P = .002), but no significant benefit of GEMCAP in patients with a tumor located outside of the pancreatic head (HR: 1.22, 95% CI 0.74-2.01, P = .44). The positive effect of GEMCAP on OS was found in both patients with a positive resection margin (HR: 0.70, 95% CI 0.51-0.97, P = .034) and patients with a negative resection margin (HR: 0.67, 95% CI 0.47-0.96, P = .029).

Forest plot of the treatment effect on overall survival in prespecified subgroups. *Significant interaction term of tumor location with adjuvant chemotherapy in unadjusted multivariable model including tumor location and adjuvant chemotherapy, P = .02
3.2 TherapyThe proportion of patients completing six cycles of adjuvant chemotherapy was 69.5% in the GEMCAP group and 62.7% in the GEM group (P = .11; Table 3). The proportion of patients receiving three or less cycles was 14.7% in the GEMCAP group and 21.4% in the GEM group (P = .06).
TABLE 3. Number of completed chemotherapy cycles in patients treated with gemcitabine with capecitabine (GEMCAP) or gemcitabine (GEM) Number of cycles (%)a
留言 (0)