
記住我


Cervical cancer is the fourth leading cause of cancer death in women, with an estimated 570 000 new cases and 311 000 annual deaths; thus, it is still a major threat to women’s health, worldwide. Squamous cell carcinoma and ADC are two major histological subtypes accounting for approximately 75%-90% and 10%-25% of cervical cancers, respectively.1-3 The total incidence of cervical cancer has declined in many high-income countries due to successful screening and vaccination programs. This is mainly due to the decline of SCC. However, the relative and absolute rates of ADC have risen over the last few decades, particularly with increased prevalence among young women. The increase in ADC is alarming as many studies associate ADC with a worse prognosis than SCC.3-5 The persistent infection of HR-HPVs, such as HPV16 and HPV18, is responsible for the majority of cervical cancers, including almost all SCC, and approximately 85% of ADC. The natural history of HR-HPV infection and cervical SCC development is well established. The HPV infection initially causes low-grade abnormalities (low-grade SIL) that can later progress to precancerous lesions (high-grade SIL) as the infection persists. Understanding the relationship between morphological changes in the HPV-infected tissues and the risk of carcinogenic progression has greatly facilitated the elimination of SCC by effective screening.6 In contrast, cytology and endoscopy examination criteria of endocervical dysplasia or ADC in situ, presumed precursor ADC lesions, are obscure and less advanced.7 Therefore, we need a better understanding of the carcinogenesis of ADC to develop effective screening and/or treatment.
Almost all cervical cancers arise in the TZ, which develops between the columnar epithelium of the endocervix and stratified squamous epithelium of the ectocervix. The TZ is formed by replacing columnar epithelium with metaplastic squamous cells mediated by reserve cells. Bipotent stem cells variably present under the columnar epithelium next to the SCJ of the TZ. Although the cellular origin of different pathological types has always been controversial, Herfs et al reported the discovery of SCJ cells, a residual embryonic cell population located at the SCJ that are progenitors for reserve cells.8, 9 Furthermore, the specific gene expression profiles of SCJ cells remain positive in all HPV-related neoplastic tissues and cervical cancer cell lines, including SCC and ADC, strongly supporting the notion that SCJ cells are the cell origin of HPV-driven cervical carcinogenesis. However, what dictates the histopathology for cervical SCC and ADC originating from the same cells is not understood.
In previous works, we generated an in vitro carcinogenesis model of cervical SCC with normal human cervical keratinocytes immortalized with ectopic TERT expression, such as HCK1T, by introducing the expression of HPV16 E6 and E7, c-MYC (MYC), and oncogenic HRASG12V (HRAS).10, 11 To study the carcinogenesis of ADC from the same cell origin, HCK1T cells conditionally expressing the combination of HPV oncogenes and genetic alterations commonly found in ADC and potential lineage-specifying factors were generated and the cell lineage characteristics were studied in monolayer and organoid cultures and tumors in mouse xenografts. The results highlighted an important role of FOXA2 in the determination of the ADC fate from initiating tumor cells.
2 MATERIALS AND METHODS 2.1 Construction of lentivirus vectors and production of recombinant lentivirusesLentiviral vectors CSⅡ-TRE-Tight-16E6E7-T2A-MYCT58A-P2A-HRASG12V (-KRASG12V), CSⅡ-TRE-Tight-18E6E7-T2A-MYCT58A-P2A-KRASG12V, CSII-TRE-Tight- POU5F1-T2A-HNF4α-bsd, CSII-TRE-Tight-FOXA2-puro, and CSII-TRE-Tight-FOXA2-bsd were constructed by using the Gateway system according to the manufacturer’s instructions (Invitrogen, Life Technologies). Destination vectors CSII-TRE-Tight-RfA-bsd and CSII-TRE-Tight-RfA-puro were constructed by inserting an RfA-PGK-bsd or RfA-PGK-puro segment from pDEST-CMSCVpuro or pDEST-CMSCVbsd between EcoRI and HpaI sites of CSII-TRE-Tight. The F2A fragments in pENTR221-16E6E7-F2A-MYCT58A-F2A-HRASG12V (-KRASG12V) were replaced with T2A or P2A, respectively, and a 16E6E7 segment was replaced with an 18E6E7 by InFusion reaction according to the manufacturer’s instructions (Takara Bio). The entry vectors pENTR201- HNF4α and pENTR201- FOXA2 were provided by Dr Goshima and pENRT-221-POU5F-T2A-HNF4α was constructed by inserting the PCR amplified fragment of T2A-HNF4α to pENRT-221-POU5F using InFusion reaction.12 CSII-TRE-Tight-puro-SMAD4mi designed to express a puromycin-resistant gene and a SMAD4-specific microRNA targeting the 5′- AGAAATCAGACAGCATCCTTT-3' sequence from the TRE tight promoter was constructed as described previously.11 The recombinant lentiviruses were produced and the virus titers were determined as previously described.11
2.2 Cell culture and generation of cell linesThe generation of HCK1T cells was previously described.10 HCK1T cells were cultured in serum-free EpiLife Medium (Thermo Fisher Scientific) with supplements described previously. HCK1T cells conditionally expressing 16E6E7-T2A-MYCT58A-P2A-HRASG12V (-KRASG12V) or 18E6E7-T2A-MYCT58A-P2A-KRASG12V were generated by infecting a corresponding recombinant lentivirus described above at an MOI of 10 to HCK1T-tetOFF that was previously described.11 Tetracycline-inducible expression of FOXA2, POU5F1, and HNF4α or SMAD4mi was introduced by infection with a corresponding recombinant lentivirus at MOI of 3 followed by drug selection with 0.5 µg/mL puromycin (Clontech Laboratories) or 0.5 µg/mL blasticidin-S (Wakenyaku).
2.3 Gene expression profile data collection and analysisThe gene expression profile data from 287 primary tumors of cervical tissues were collected from the TCGA cervical squamous cell carcinoma and endocervical adenocarcinoma (TCGA-CESC) data collection (https://cancergenome.nih.gov/). The expression of FOXA2, POU5F1, and HNF4α in SCC and ADC was compared. The statistical difference was evaluated using the Wilcoxon rank-sum test.
2.4 Cell proliferation assayThe cells cultured in the presence of 100 ng/mL DOX were seeded on 96-well plates at 3000 cells/well with or without 1000 ng/mL DOX. The cells were fixed at days 1, 3, 5, and 7 with cold methanol and subjected to sulforhodamine B assay.13 A microtiter plate reader determined the optical density of dissolution at the absorbance of 570 nm. At least three independent experiments were carried out, and mean values at each time point are presented.
2.5 Western blot analysisWhole-cell extracts were collected, and the protein concentration was measured using a DC assay following the manufacturer’s instructions (Bio-Rad Laboratories). Equal amounts of total protein were separated through SDS-PAGE and subjected to western blot analysis as previously described.11, 14 The chemiluminescent images were acquired using LAS-3000 and the band intensities were measured by Multigauge software (FujiFilm Holdings). The band intensities of the indicated proteins were normalized by the band of vinculin and the protein levels in indicated cells relative to that in HCK1T-tetOFF cells were calculated. The average values of three independent experiments are indicated. The primary Abs used are listed in Table S1.
2.6 Organoid cultureThe method we used for the organoid culture was based on the Matrigel bilayer organoid culture developed by Maru et al.15 Briefly, the cells (10 000 cells/well) were plated onto a Matrigel (Corning) layer in a 24-well plate (Falcon; Corning) and incubated overnight at 37°C in the organoid medium. The following morning, a 100-µL Matrigel mixture was overlaid to sandwich the cells on top of the bottom Matrigel layer. Once the top Matrigel layer was solidified, 500 µL organoid medium was added. The organoid medium was refreshed every 2 days, and organoids were formalin-fixed at approximately day 14.
2.7 Mouse xenograftsAll surgical procedures and care of the animals were carried out under the institutional guidelines and approved. A 100-μL volume of cells (106 cells) in a 1:1 mixture of Matrigel (Corning) was subcutaneously inoculated into female BALB/c nude mice (Japan SLC). The tumor size was measured two to three times per week using calipers, and the tumor volume was estimated using the formula: V = (LW2)/2, where V represents volume (mm3), L represents the largest diameter (mm), and W represents the smallest diameter (mm). Mice were killed when the average tumor volume reached 600 mm3. All mice whose tumors did not attain 600 mm3 were killed on day 100. Doxycycline was given to the recipient mice through drinking water (1 mg/mL in 5% sucrose).16
2.8 Immunohistochemical and AB/PAS stainingThe FFPE sections were deparaffinized in xylene and rehydrated through a graded ethanol series (100%–70%). The FFPE sections were then incubated in methanol containing 0.3% H2O2 to inhibit endogenous peroxidase activity. For the head-induced antigen retrieval, the deparaffinized sections were immersed in citrate buffer (pH 6.4) or Tris-EDTA buffer (pH 9) and incubated at 95℃ for 20-30 minutes. After blocking using 2.5% horse serum in PBS, the sections were incubated with a primary Ab overnight at 4℃ and subjected to chromogenic detection using an ABC Universal Kit Peroxidase, RTU Kit with DAB as instructed by the manufacturer’s protocol (Vector Laboratories). The sections were counterstained with hematoxylin. Primary Abs used are listed in Table S2. The AB/PAS staining was carried out following the standard protocol (Muto Pure Chemicals).
2.9 Scoring method and statistical analysisThe images were taken using a Keyence microscope (BZ-9000) at 20× magnification under bright-field conditions. For quantification, images were analyzed using ImageJ software (https://imagej.nih.gov/ij/) and its open-sourced plugins. Multiple images per section from multiple tumors with the same cells were chosen randomly. For p40 and Ki-67, the positive and negative cells were subjected to software-based identification using ImageJ plugin Trainable Weka Segmentation. The positive rate is the ratio of the positive nuclei to the total number of nuclei per image. For CK18, CK14, and MUC5AC, the plugin IHC profiler was used in detecting the DAB-derived cytoplasmic staining, and the positive rate was automatically assigned.17 For AB/PAS staining, each image was divided into 0.2 × 0.2-inch grids, a total of 713 grids per image, and the positive staining was measured by manual counting. The positively stained grids and the grids containing unstained tumor tissues were counted separately. The positive rate is the ratio of positively stained grids to the total number of counted grids. P values were computed using Student’s t test or Welch’s correlation coefficient.
3 RESULTS 3.1 Generation of human cervical keratinocyte cell lines conditionally expressing the defined oncogenes and factors that could influence cell lineageA tet-inducible polycistronic lentivirus vector expressing E6 and E7 of HPV16 or HPV18 in combination with oncogenic KRAS (KRASG12V) and c-MYC (MYCT58A) was transduced to HCK1T-tetOFF cells, which express a tet-controlled transactivator as previously described (Figure 1A).11, 16 By analyzing TCGA data, we discovered significantly higher expression of three transcription factors, FOXA2, POU5F1, and HNF4α, which have been implicated as lineage-determining factors in other tissues, in ADC compared to SCC (Figure 1B).18-20 The TCGA study of cervical cancer also revealed that the activation of KRAS and the inactivation of SMAD4 are more enriched in ADC than in SCC.21 Therefore, HCK1T cells conditionally expressing HPV16E6E7 or HPV18E6E7, MYCT58A, and KRASG12V (HCK1T-tre16EMR or HCK1T-tre18EMR) were further transduced using a lentivirus vector carrying tet-inducible expression of FOXA2, a microRNA targeting SMAD4 (SMAD4mi), or PH. As indicated in Figure 1C,D, the expression of all transgenes, E6, MYCT58A, KRASG12V, FOXA2, and PH was induced, whereas SMAD4 expression was decreased when DOX was removed. Interestingly, we noted a moderate increase in endogenous FOXA2 levels in HCK1T on the expression of E6E7 of HPV16 or HPV18, MYCT58A, and KRASG12V. Therefore, the levels of endogenous FOXA2 were compared in HCK1T cells expressing E6 alone, E6E7, or EMR using western blotting (Figure 1E). The expression of E6 of HPV16 and HPV18 alone was sufficient to increase the endogenous FOXA2 level. No further increase was observed in cells expressing E6E7 or EMR, suggesting that E6 is primarily responsible for increased endogenous FOXA2 level.
 Generation of human cervical keratinocyte cell lines conditionally expressing the defined viral and cellular oncogenes and potential lineage-determining factors. A, Schematic illustration of a single polycistronic lentiviral vector, which induces the expression of E6 and E7 of human papillomavirus (HPV)16 or HPV18, MYCT58A and KRASG12V (EMR) under the control of tetracycline (tet)-responsible promoter. Ψ, packaging signal; 2A, 2A peptide sequences; CMVmini, CMV minimal promoter; LTR, long terminal repeat; TRE, tet-responsive elements. B, Expression profiles of FOXA2, POU5F1, and HNF4α in cervical squamous carcinoma and adenocarcinoma in The Cancer Genome Atlas. P value was computed using the Wilcoxon rank-sum test. **P ≤ .01, ***P ≤ .001. C, D, Western blot analyses to verify the tet-responsible expression of the transgenes. HCK1T-tre16EMR or HCK1T-tre18EMR were further transduced with a lentivirus expressing FOXA2, a microRNA targeting SMAD4 (SMAD4mi) or POU5F and HNF4α (PH) from tet-responsible promoter. The indicated cells were cultured with or without doxycycline (DOX; 1000 ng/mL) for 5 d, and the whole-cell lysates were collected. The expression of the transgenes was detected using a specific Ab as indicated on the left of the panels. Vinculin was also detected as a loading control. E, Western blot analysis for endogenous FOXA2 in HCK1T cells expressing the indicated genes. HCK1T lines expressing E6 or E6 and E7 through retrovirus (LXSN)-mediated transduction were described elsewhere.10, 14 Levels of FOXA2 in the indicated cells relative to that in HCK1T-tetOFF cells are indicated at the bottom. Average values of three independent experiments are shown
3.2 Expression pattern of squamous cell markers in HCK1T cells expressing E6E7 of HPV16 or HPV18, MYCT58A, and KRASG12V with or without factors that could influence cell lineage
Generation of human cervical keratinocyte cell lines conditionally expressing the defined viral and cellular oncogenes and potential lineage-determining factors. A, Schematic illustration of a single polycistronic lentiviral vector, which induces the expression of E6 and E7 of human papillomavirus (HPV)16 or HPV18, MYCT58A and KRASG12V (EMR) under the control of tetracycline (tet)-responsible promoter. Ψ, packaging signal; 2A, 2A peptide sequences; CMVmini, CMV minimal promoter; LTR, long terminal repeat; TRE, tet-responsive elements. B, Expression profiles of FOXA2, POU5F1, and HNF4α in cervical squamous carcinoma and adenocarcinoma in The Cancer Genome Atlas. P value was computed using the Wilcoxon rank-sum test. **P ≤ .01, ***P ≤ .001. C, D, Western blot analyses to verify the tet-responsible expression of the transgenes. HCK1T-tre16EMR or HCK1T-tre18EMR were further transduced with a lentivirus expressing FOXA2, a microRNA targeting SMAD4 (SMAD4mi) or POU5F and HNF4α (PH) from tet-responsible promoter. The indicated cells were cultured with or without doxycycline (DOX; 1000 ng/mL) for 5 d, and the whole-cell lysates were collected. The expression of the transgenes was detected using a specific Ab as indicated on the left of the panels. Vinculin was also detected as a loading control. E, Western blot analysis for endogenous FOXA2 in HCK1T cells expressing the indicated genes. HCK1T lines expressing E6 or E6 and E7 through retrovirus (LXSN)-mediated transduction were described elsewhere.10, 14 Levels of FOXA2 in the indicated cells relative to that in HCK1T-tetOFF cells are indicated at the bottom. Average values of three independent experiments are shown
3.2 Expression pattern of squamous cell markers in HCK1T cells expressing E6E7 of HPV16 or HPV18, MYCT58A, and KRASG12V with or without factors that could influence cell lineage
To examine the impact on cell lineage through the expression of introduced genes, the endogenous levels of squamous cell markers ΔNp63α and CK14 and columnar cell markers CK18 and CK7, were compared (Figure 2A-C). Interestingly, the levels of ΔNp63α were decreased upon exogenous expression of FOXA2 with EMR, whereas ΔNp63α levels remained grossly comparable in cells expressing EMR or EMR with SMAD4mi. In contrast, the levels of CK14 were decreased, whereas the expression levels of CK18 and CK7 were increased when the SMAD4 level was decreased. We also generated HCK1T-tre16EMR and HCK1T-tre18EMR containing tet-inducible FOXA2 and SMAD4mi, HCK1T-tre16EMR + S + F, and HCK1T-tre18EMR + S + F, respectively, by a serial transduction. When the expression of exogenous FOXA2 and SMAD4mi was simultaneously induced, ΔNp63α and CK14 levels were both reduced, while CK18 and CK7 was increased. These results suggest that the squamous cell properties of HCK1T expressing EMR are partially suppressed through exogenous expression of FOXA2 or the reduction of SMAD4. No apparent difference in the levels of ΔNp63α, CK18, or CK7, was observed upon simultaneous expression of POU5F1 and HNF4α or a single expression of either one (data not shown), indicating that these transcription factors are most likely not involved in cell lineage determination of cervical cancer.

Expression pattern of squamous cell markers in HCK1T cells conditionally expressing E6 and E7 of human papillomavirus (HPV)16 or HPV18, MYCT58A, and KRASG12V (EMR) with or without cellular factors possibly affecting cell lineage. A-C, Western blot analyses for endogenous expression levels of ΔNp63α, cytokeratin (CK)14, CK18, and CK7. A, C, HCK1T-tre16EMR or -tre18EMR with FOXA2, microRNA targeting SMAD4 (SMAD4mi), or POU5F and HNF4α (PH). B, HCK1T-tre16EMR and HCK1T-tre18EMR were serially transduced with a FOXA2 expressing lentivirus and a SMAD4mi expressing lentivirus (+F + S). The whole-cell lysates were obtained from the indicated cells cultured in the presence or absence of doxycycline (DOX; 1000 ng/ml) for 5 d. Vinculin was detected as a loading control. Levels of lineage-specific markers in the indicated cells relative to that in HCK1T-tetOFF cells are indicated at the bottom. Average of three independent experiments is shown. D, E, Sulforhodamine B assay for cell proliferation. Cells were cultured in the presence (+) or absence (−) of 1000 ng/mL DOX. Mean value of at least three independent experiments was plotted with ± SD. Student’s t test was used to calculate the P value; *P ≤ .05, **P ≤ .01, ***P ≤ .001. ns, no significant difference (P > .05)
We showed that the expression of the defined four oncogenes (16EMR) from a single vector promotes cell proliferation of human pancreatic ductal epithelial cells in our previous study.16 Consistently, the expression of the defined four oncogenes, 16EMR as well as 18EMR, significantly accelerated cell growth in the absence of DOX compared to that in the presence of DOX, verified that the expression of the defined oncogenes from a single vector was sufficient to augment cell proliferation of HCK1T cells (Figure 2D,E). Exogenous FOXA2 expression resulted in reduced cell proliferation of HCK1T-tre16EMR and HCK1T-tre18EMR, whereas reduction of SMAD4 resulted in further acceleration of cell growth in the absence of DOX. We previously reported that the reduction of ΔNp63 expression by siRNA impairs HCK1T proliferation.22 Therefore, the reduced proliferation of these cells with exogenous FOXA2 expression could be due to the reduced levels of ΔNp63. Several studies have shown that SMAD4 mediates TGF-β signaling and TGF-β can suppress proliferation of keratinocytes in an autocrine as well as paracrine fashion. It is conceivable that the SMAD4 reduction in these cells abrogated TGF-β-mediated suppression of HCK1T.23, 24
3.3 Generation of organoid cultures with HCK1T expressing E6E7 of HPV16 or HPV18, MYCT58A, and KRASG12V with or without exogenous FOXA2 and/or SMAD4miTo recapitulate relevant in vivo-like cell differentiation, organoid cultures were generated. The FFPE sections of organoids produced in the absence of DOX with HCK1T-tre16EMR and HCK1T-tre18EMR with or without FOXA2 (+F) and/or SMAD4mi (+S) were subjected to H&E staining and IHC. It has been shown that organoids derived from normal ectocervix are dense spherical bodies consisting of differentiated inner cells outlined with a single layer of ΔNp63α and CK14-positive proliferating cells, showing inwardly directed stratified squamous cell differentiation. Alternatively, organoids from the endocervix formed hollow cystic-like structures with a single columnar cell layer.25, 26 Organoids generated with those HCK1T cell lines mainly displayed dense spherical structures with a few containing cystic-like shapes (Figure 3A). Interestingly, we found that organoids with exogenous FOXA2 expression contain cells with intracytoplasmic mucin-like substances (Figure 3A, arrows). The deep blue/purple color by AB/PAS staining verified that these cells were indeed mucin-producing cells, a signature for ADC (Figure 3A, arrowheads). The ratios of organoids with mucin-producing cells in total organoids were 12.6% and 13.49% in HCK1T-tre16EMR and HCK1T-tre18EMR with exogenous FOXA2 alone (+F), respectively, and 26.67% and 22.55%, respectively, in the organoids expressing FOXA2 with SMAD reduction (+S + F). In contrast, few to no organoids of HCK1T-tre16EMR or HCK1T-tre18EMR with or without SMAD reduction contained the mucin-producing cells. Immunohistochemistry was carried out for cell lineage-specific markers ΔNp63α (also known as p40), CK14, MUC5AC, and CK18. In line with PAS/AB staining results, CK18 and MUC5AC expression were clearly increased in the organoids expressing exogenous FOXA2 with and without SMAD4 reduction while the increased levels of CK18 but not MUC5AC were observed in organoids with SMAD4 reduction only. MUC5AC is one of the secreted mucins expressed on mucosal surfaces, including endocervical epithelium. Multiple studies have highlighted that MUC5AC is expressed in cervical ADC but not in SCC.26-28 Together, these results suggest that exogenous FOXA2 can induce differentiation or conversion of HCK1T toward the columnar cell lineage from the squamous cell lineage. The increased presence of the mucin-producing cells in organoids expressing FOXA2 with SMAD4 reduction compared to exogenous FOX2 alone implies that the reduction of SMAD4 might facilitate columnar lineage differentiation driven by FOXA2. However, IHC for ΔNp63α (p40) and CK14 revealed that the squamous epithelial markers are present in all organoids, regardless of exogenous FOXA2 and SMAD4 reduction. In most organoids, the p40-positive cells were distributed in the outermost cells. Additionally, p40-positive staining in inner cells of some organoids was found. In the case of CK14, the expression was detected throughout organoids, not limited to outermost cells. Cells positive for Ki-67, a proliferation marker, were detected in the outermost cells in most organoids with some organoids containing Ki-67-positive inner cells. These results indicate that the squamous cell features were not entirely diminished in the cells with exogenous FOXA2 and SMAD4 reduction. Furthermore, elevated cell proliferation and suppressed squamous cell differentiation seen in organoids with expression of EMR were consistent with observations seen in other in vitro carcinogenesis models, such as raft cultures, potentially corresponding to early events in carcinogenesis.29, 30

Organoid cultures to recapitulate in vivo-like differentiation. Organoids were generated with the indicated HCK1T cell lines in the absence of doxycycline. Formalin-fixed paraffin-embedded sections of organoids were subjected to H&E staining and Alcian blue/periodic acid-Schiff (AB/PAS) staining (A) or immunohistochemistry for p40 (ΔNp63α), cytokeratin (CK)14, CK18, MUC5AC, and Ki-67 (B). Fractions of AB/PAS-positive organoids were calculated based on manual counting and indicated in (A). Arrows indicate mucin-like substance. Scale bar, 100 µm
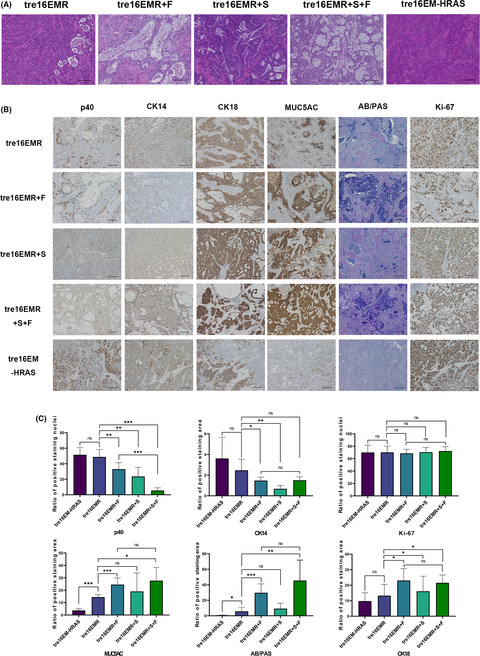
3.4 Histopathological features of tumors in mouse xenograftsTo investigate the tumorigenicity and histopathology of tumors in vivo, mouse xenograft experiments were carried out, with HCK1T-tre16EMR and HCK1T-tre18EMR with or without the expression of exogenous FOXA2 (+F) and/or SMAD4mi (+S). Additionally, mouse xenografts with HCK1T-tre16E6E7-MYC-HRASG12V (HCK1T-tre16EM-HRAS) were generated as an HCK1T-based SCC model. Results of the tumor formation in vivo are summarized in Table 1. All the cell lines formed tumors in nude mice without DOX treatment, whereas no tumor was formed in the mice with DOX treatment, indicating that all of the generated cell lines are tumorigenic, and their tumor-forming abilities depend on the expression of the defined oncogenes. The H&E staining of tumors with HCK1T-tre16EM-HRAS revealed that histopathological characteristics of the tumors resemble moderate to poorly differentiated SCC (Figure 4A). The tumors with HCK1T-tre16EMR or HCK1T-tre18EMR also displayed mainly SCC-like morphology (Figure S1 for HPV18) with a small number of cavity-like structures with apoptotic cell fragments inside, a morphological alteration rather associated with ADC. In the tumors with exogenous FOXA2 or SMAD4mi, the ADC-associated histological features were clearly present, including intracytoplasmic mucin and gland-like structures consisting of columnar-shaped cells. Particularly, the proportion of structures resembling ADC was extensive and contained predominantly well-formed glandular-like structures with extravasated mucin imparting a colloid-like appearance in the tumors with exogenous FOXA2. The expression patterns of lineage-specific markers in the tumors were examined using AB/PAS staining and IHC for p40 (ΔNp63α), CK14, MUC5AC, CK18, and Ki-67 (Figure 4B,C). By and large, all the features associated with columnar cell lineage were markedly increased in tumors with exogenous FOXA2 compared to tumors with EMR or EM-HRAS. Quantification of the positive ratios indicated differences that were statistically significant for all three markers. In EMR tumors with SMAD4mi, the positive region of columnar cell markers was also increased, although the increase was rather moderate. There was no additional increase of columnar cell markers in EMR tumors expressing exogenous FOXA2 and SMAD4mi compared with EMR tumors with exogenous FOXA2 alone. In contrast, the positive staining of p40 and CK14 was significantly diminished in the tumors with EMR expressing exogenous FOXA2 or SMAD4mi compared to tumors with EMR only. In EMR tumors with SMAD4mi, loss of p40-positive cells was more prominent than EMR tumors with exogenous FOXA2. Furthermore, p40-positive cells almost completely disappeared in EMR tumors expressing exogenous FOXA2 and SMAD4mi. No difference was detected for Ki-67 staining among all tumors. These trends were consistent with tumors with 18EMR (Figure S1). RNA sequencing analysis for mRNA isolated from 16EMR xenografts indicated a distinct set of genes was differentially expressed in the tumors with exogenous FOXA2 or SMAD4 reduction (Appendix S1, Dataset S1). Together, these results indicate that cervical ADC can be developed from HCK1T cells expressing E6E7 of HPV16 or HPV18, MYCT58A, and KRASG12V with exogenous FOXA2 expression and SMAD4 reduction, and that the overexpression of FOXA2 and the reduction of SMAD4 induce columnar cell properties through independent pathways. The subtle increase was detected for the positive staining of columnar cell markers in tumors with EMR compared to EM-HRAS, consistent with a small number of cavity-like structures. However, no significant difference was observed for squamous cell markers p40 and CK14 between tumors with KRASG12V and with HRASG12V.
TABLE 1. Summary of tumor formation in cervical cancer xenografts Cells Tumor formationa HCK1T tet-off -tre HPV16E6E7-MYCT58A – HRASG12V 8/8 (39) -tre HPV16E6E7-MYCT58A – KRASG12V 8/8 (59) -tre HPV16E6E7-MYCT58A – KRASG12V + FOXA2 8/8 (48) -tre HPV16E6E7-MYCT58A – KRASG12V + SMAD4mi 5/8 (95) -tre HPV16E6E7-MYCT58A – KRASG12V + SMAD4mi + FOXA2 5/8 (100) -tre HPV16E6E7-MYCT58A – KRASG12V (DOX +) 0/4 (100) HCK1T tet-off -tre HPV18E6E7-MYCT58A – KRASG12V 3/4 (100) -tre HPV18E6E7-MYCT58A – KRASG12V + FOXA2 3/4 (100) -tre HPV18E6E7-MYCT58A – KRASG12V + SMAD4mi 4/4 (100) -tre HPV18E6E7-MYCT58A – KRASG12V + SMAD4mi + FOXA2 4/4 (100) -tre HPV18E6E7-MYCT58A – KRASG12V (DOX+) 0/4 (100) Notes Incidence of tumor formation within 100 days of observation period. a(Number of tumors)/(number of transplantations) are indicated. Mice were killed when the average tumor volume reached >600 mm3. Mice whose tumors did not attain 600 mm3 were killed at day 100 and tumors were collected. Numbers in parentheses indicate the time (d) until mice were killed.
Histopathology of tumors formed in mouse xenografts. A, B, Representative microscopic images of H&E staining (A) or Alcian blue/periodic acid-Schiff (AB/PAS) staining and immunohistochemistry (IHC) with indicated Abs (B) for the tumors in mouse xenografts generated with HCK1T-tre16EMR, HCK1T-tre16EMR expressing FOXA2 (+F) and/or SMAD4mi (+S), and HCK1T-tre16EM expressing HRASG12V (HRAS). Scale bar, 100 µm. C, Quantification of the expression of lineage-specific markers detected using IHC in tumors with indicated cells (n > 3). Mean values from at least three independent tumors were plotted. Error bars indicate ± SD. P values were evaluated using Student’s t test. *P ≤ .05, **P ≤ .01, ***P ≤ .001. ns, not significant (P > .05)
4 DISCUSSIONIn this study, we developed an in vitro model of cervical ADC from the same cells as an in vitro SCC model by introducing the expression of E6 and E7 of HPV16 or HPV18, c-MYC, and oncogenic KRAS with ectopic expression of FOXA2 and the reduced expression of SMAD4. This is the first in vitro carcinogenesis model for cervical ADC.
Forkhead box A2 plays vital roles in a wide spectrum of biological processes, including development, metabolism, and tumorigenesis as it has pioneering activity that binds and opens condensed chromatin, facilitating subsequent binding of other transcription factors.18, 31, 32 Barrett’s esophagus is characterized by the replacement of esophageal stratified epithelium with intestinal-like columnar epithelium and is considered to be a precursor lesion associated with ADC in gastric SCJ, the region reminiscent of SCJ in the cervix. Analogous to our results, Wang et al reported that upregulation of FOXA2 by the SHH signal induces expression of MUC2, an intestinal mucin found in Barrett’s esophagus.33 Similarly, we found that mRNA levels of SHH were significantly higher in ADC than in SCC in the TCGA dataset of cervical cancer (data not shown). It was also indicated that FOXA1/FOXA2 drive gastric differentiation and suppress squamous identity in an NKX2-negative, KRASG12D driven mouse lung ADC model.34 Although it is unknown whether FOXA2 is involved in the cell lineage specification at endo- and exocervical junctions, it has been shown that conditional knockout of FOXA2 in the neonate uterus inhibits uterine gland genesis, resulting in aglandular adult mice.35, 36 Therefore, it is plausible that FOXA2 regulates glandular epithelium formation in the endocervix, and its suppression is critical for TZ formation through metaplasia. The reversal of its suppression and de novo upregulation of FOXA2, potentially by SHH, might occur during ADC development. Interestingly, endogenous FOXA2 levels were increased in HCK1T cells upon the expression E6 of HPV16 and HPV18 (Figure 1E). It was previously reported that HPV16 E6 and NFX1-123, a transcription factor, target FOXA2 for upregulation in human foreskin keratinocytes and that the expression of NFX1-123 and FOXA2 is increased in cervical cancer cells.37, 38 Thus, E6 of HPV16 and HPV18 with NFX1-123 could transcriptionally upregulate FOXA2 during HPV-driven ADC development. However, the E6-induced FOXA2 upregulation is not sufficient to account for the predominant upregulation of FOXA2 in ADC, as E6 is also present in SCC. Other mechanisms to elicit additional FOXA2 upregulation could be critical for ADC development.
In the xenograft tumors with reduced SMAD4, gland-like structures, the reduced presence of ΔNp63α, and increased CK18 were clearly observed, suggested that the SMAD4 inactivation might facilitate ADC development. SMAD4 is a tumor suppressor, meditating TGF-β signaling. The TGF-β/SMAD4 signaling pathway is involved in a broad range of cellular processes, such as cell proliferation, differentiation, and apoptosis, thus, the inactivation of SMAD4 has been reported in various cancers, including cervical cancers, and is generally associated with increased aggressiveness of the cancers.39-41 In the TCGA study, the inactivation of other TGF-β signaling-related genes was rather more frequent in SCC than in ADC, implying that SMAD4 plays a role in the cell lineage determination independently of TGF-β receptors. Interestingly, Laronda et al reported that SMAD4 mediates BMP4 signaling, members of the TGF-β superfamily, to induce ΔNp63α-positive vaginal squamous epithelial cells from ΔNp63α-negative undifferentiated MDECs during vaginal development. Mesenchymal BMP4 and activin A signals led to SMAD4/RUNX1-dependent transcriptional activation of ΔNp63α in MDECs, inducing squamous cell identity. Once induced, ΔNp63α expression was maintained in a SMAD4/RUNX1-independent manner.42, 43 Consistently, the SMAD4 reduction did not affect the ΔNp63α level in HCK1T cells with EMR in a monolayer culture. However, the loss of ΔNp63α-positive area was apparent in tumors with reduced SMAD4. It is possible that the tumor stroma might maintain ΔNp63α expression through BMP4, and such a signal is attenuated through the reduction of SMAD4. Notably, a significant difference of RUNX1 expression between SCC and ADC in TCGA data was not found (data not shown).
Human papillomavirus 18 is predominantly detected in ADC compared to SCC. The prevalence of HPV16 and HPV18 is 56.8% and 11.6%, respectively, in SCC, whereas the prevalence is 36.1% and 34.9%, respectively, in ADC (https://hpvcentre.net/). Some researchers have speculated that HPV18 might prefer to infect cells with potential for glandular differentiation at the TZ.44 Our results clearly indicated that ADC and SCC can be developed from the same cells, consistent with the notion that SCJ cells are the cell-of-origin for HPV-driven cervical SCC as well as ADC. In our current model, no apparent difference between HPV16 and HPV18 was detected in histopathological characteristics of the organoids or tumors. To generate an in vitro carcinogenesis model for ADC, we introduced the combination of the gene alteration and differentially expressed genes overrepresented in ADC. It is possible that potential difference in predisposition to ADC development between HPV18 and HPV16 is overridden by the potent combination of these host alterations. We hope to elucidate the molecular mechanisms underlying the association of HPV types with histopathology of cervical cancer using our model by examining different combinations of viral and host factors in the future.
Our in vitro model translated the information from the genomic study into biological significance in the determination for histopathological phenotypes of cervical cancer. We believe this model provides a valuable tool for the investigation of specific alterations in the carcinogenesis of cervical ADC and for development of potential therapeutics in the future.
ACKNOWLEDGMENTSWe would like to thank Takako Ishiyama for her technical assistance and Dr Hiroshi Yoshida (Division of Diagnostic Pathology, National Cancer Center Hospital) for histopathology consultation. This work was supported in part by JSPS KAKENHI (JP18K09307) and in part by AMED under Grant Number JP21fk0108106h0003 to TN.
CONFLICT OF INTERESTThe authors have no conflict of interest.
留言 (0)