
記住我


Cartilage lacks inherent regenerative capacity, which makes it an important target for tissue engineering-based therapies.1, 2 A need for cartilage reconstruction in the head and neck area occurs commonly and due to a variety of causes, such as trauma, tumor resection, or congenital malformations.3-5 The current gold standard for replacement of damaged or lacking cartilage tissue is autologous transplantation from unaffected sites—typically, auricle or costal cartilage. While this approach is effective, the disadvantages, such as tissue shortage and donor site morbidity, are obvious. Besides, tailoring the transplant shape is often necessary but limited by the predefined anatomy of the donor site. In articular cartilage, traumatic injuries leading to chondral or osteochondral defects commonly occur and represent a high-risk factor for subsequent development of posttraumatic osteoarthritis.6-8 Susceptibility of the articular cartilage to degenerative changes combined with its limited ability for recovery has made the application of tissue engineering-based therapies an effective approach for the treatment of such structural lesions.1, 2, 7
The application of decellularized extracellular matrices (DECM)-based materials to facilitate the regeneration of damaged tissues is an emerging promising approach.9 Xenogeneic tissues used for decellularization are cost-effective and readily obtainable. The key benefits of DECM materials are naturally occurring composition and ultrastructure of ECM proteins (e.g., collagen), which provide an adequate mechanical and chemical environment to the cells in the affected tissue.10, 11 In articular cartilage, DECM materials can facilitate the regeneration of cartilage defects by providing necessary cues for chondrogenic stem and progenitor cells (CSPCs) and/or resident mesenchymal stromal cells.2, 12-14 Furthermore, until the replacement of xenogeneic tissue with native cell-secreted ECM, the DECM scaffold can take on a supportive function, which is particularly important for supportive anatomical structures, such as the nasal septum.15 To this aim, our group has developed a decellularized cartilage matrix from the porcine nasal septum (decellularized nasal septal cartilage–DNSC).16, 17 The matrix has been extensively characterized for decellularization efficiency, cyto- and biocompatibility, as well as the suitability for operative handling in an animal model.18, 19 Furthermore, the potential of DNSC to stimulate cartilage regeneration has been demonstrated in a rabbit model.19
Host immune response is a determining factor for the successful outcome of the transplantation.20, 21 Unlike immune-privileged orthopedic sites, transplantation in the area of head and neck can evoke strong inflammatory reactions, resulting in scaffold resorption and poor stability of the transplant and thus requiring additional precaution with respect to immunogenicity of the transplanted material.4 Particularly for xenogeneic transplants, early and aggressive host immune response is of general concern and can be detrimental to the success of transplantation.22, 23 While studies in animal models are indispensable for the basic estimation of biocompatibility, the assessment of species-specific immune response to a biomaterial can be of critical value.20 Macrophages are the principal cells of innate immunity and have a central role in the foreign body reaction (FBR) and the formation of fibrous capsule.24, 25 According to the existing paradigm, M1 macrophages, which are responsible for the initial acute inflammatory reaction to the transplanted material, are replaced with M2 macrophages at later remodeling phases of wound healing and fibrous capsule formation.26 M1 macrophages secrete acute inflammatory cytokines, such as Interleukin-1 beta (IL-1β) and tumor necrosis factor alpha (TNF-α), while M2 macrophages are characterized by the high expression of mannose receptor CD206 and production of chemokine CCL18.27 In vitro, interferon-gamma (IFNγ) and/or bacterial lipopolysaccharide (LPS) can be applied to differentiate macrophages into pro-inflammatory M1 type (classical activation pathway), while IL-4 leads to the alternative activation of macrophages, resulting in the M2 phenotype.27 M2 activity is crucial for the remodeling of the extracellular matrix, tissue repair, and clearance of the tissue microenvironment.28-30
More recently, the importance of macrophage polarization has been appreciated in the context of the constructive remodeling of ECM-based degradable biomaterials, which do not elicit a conventional FBR.22, 31 Based on the existing paradigm, the initial acute inflammatory reaction contributes to the degradation of the transplanted matrix, which in turn, leads to the recruitment of progenitor cells.9 A timely switch toward M2 macrophages then further facilitates remodeling of the ECM. In an ideal case, the process of constructive remodeling resolves into a complete or partial replacement of the xenogeneic material with a functional native tissue, as opposed to fibrous encapsulation.32 While both, acute inflammatory M1 and remodeling M2 macrophages contribute to constructive remodeling, the persistence of the M1 phenotype or overly active M1 reaction is associated with a poor prognosis of DECM transplantation.24
In this study, we evaluated the response of primary human monocyte-derived macrophages (MDMs) to the xenogeneic DNSC with the primary goal of ensuring the absence of an aggressive and persistent M1 response to the scaffold. To exclude batch-to-batch variation, throughout the study, we used DNSC derived from a single decellularization procedure, as well as DNSC scaffolds derived from separate decellularization procedures (i.e., random batch, denoted as DNSCn). For reference, we compared DNSC with two other porcine ECM-based, clinically applied materials with documented macrophage response patterns. Particularly, we chose porcine small intestine submucosa (SIS) due to its well-known benign immune host response both in vitro and in vivo.33, 34 For further comparison, we used Parietex™ Composite (PRTX), a polyester coated with a layer of porcine collagen, which has been described as evoking a strong mixed M1 and M2 response.35-37 Furthermore, to modulate the immune reaction to the DNSC, we functionalized the scaffold by loading it with IL-4, thereby reducing the M1 response to the material and inducing an early shift toward the M2 phenotype.
2 MATERIALS AND METHODS 2.1 Porcine DNSC scaffoldsProcessed and sterile porcine DNSC was prepared and provided by the Institute of Bioprocess Engineering of the University of Erlangen, Germany, as previously described.16, 17 Scaffolds derived from a single decellularization procedure (single batch) were used throughout the study and are denoted as DNSC. Additionally, to test for the batch-to-batch variation, precut, quality-controlled DNSC scaffolds derived from separate decellularization procedures (random batch, DNSCn) were used. Endotoxin levels below 0.06 EU ml−1 were confirmed using PyroGene™ Recombinant Factor C Endotoxin Detection Assay (Lonza, Switzerland) for all batches used.
2.2 Isolation of primary human monocytesBuffy coats from healthy donors were obtained from the Institute of Transfusion Medicine and Immunology, Red Cross Blood Service of Baden-Wuerttemberg-Hessen, Faculty of Clinical Medicine Mannheim, University of Heidelberg, Germany in accordance with the standards of the local ethics committee. Peripheral blood mononuclear cells (PBMCs) were isolated by Ficoll–Paque PLUS (GE Healthcare biosciences AB, Sweden) density gradient centrifugation. CD14-positive monocytes were isolated using magnetic cell isolation (CD14 MicroBeads, Miltenyi Biotech, Germany) according to the manufacturer's instructions. Briefly, PBMCs derived from buffy coats were resuspended in 60 μl MACS separation buffer (Miltenyi Biotec) per 107 total cells. 20 μl of FcR Blocking Reagent (Miltenyi Biotec) and 20 μl of MicroBeads conjugated to monoclonal anti-human CD14 antibodies were added to the cell suspension. Following a 15-min incubation at 4°C (refrigerator), cells were washed with 2 ml MACS separation buffer and centrifuged at 300g for 10 min. Afterward, 500 μl MACS separation buffer was added per 108 cells, and the cell suspension was passed through a 30 μm nylon mesh to remove any cell aggregates. The cell suspension was passed through LS magnetic column (Miltenyi Biotec) attached to a MACS separator (Miltenyi Biotec) retaining the labeled cells within the column. The cells were then flushed out of the magnetic column with 2–3 ml of MACS separation buffer and subsequently passed through MS magnetic columns for additional purity. A portion of the isolated cells was labeled with PE-conjugated antibody against human CD14 (Clone # 134620, R&D systems, Bio-Techne GmbH, Germany) and 7-AAD Staining Solution (Miltenyi Biotec) for dead cell exclusion. The purity of the CD14 population (<95%) was confirmed by flow cytometry (BD FACSCanto™ II, BD Biosciences, Germany).
2.3 Macrophage culture on DNSC and reference materialsDesiccated DNSC scaffolds were suspended in EtOH 70% for 1 h to ensure handling sterility. Commercially available porcine SIS was purchased as a clinically approved product–Biodesign® ENT Surgical Reinforcement Graft (Cook Medical, IN, USA) and Parietex™ composite (Covidien, Ireland) was kindly donated by the Otorhinolaryngology Department of the Ulm University Clinic. All DNSC scaffolds and reference materials were rehydrated in Macrophage Serum-free Medium (SFM 1x, ThermoFisher Scientific, Germany) supplemented with 10 ng ml−1 recombinant Human M-CSF (PeproTech, Germany) and 1% PSA (Penicillin–Streptomycin-Amphotericin B, Biological Industries, Israel) overnight before use in cell culture experiments. DNSC was then sliced into approximately 0.5 cm2 and approximately 1 mm thick pieces using a sterile microtome blade. DNSCn scaffolds were provided as discs (diam. = 5 mm, height = 1 mm) and were used without any further handling after the rehydration. SIS and PRTX were similarly cut into 0.5 cm2 pieces using sterile surgical scissors. Two 0.5 cm2 DNSC scaffolds, two disc-shaped DNSC, or two pieces of SIS or PRTX per well were then placed into 24-well cell culture plates (Sardstedt, Germany) for each experiment. An empty well was used as a negative control (designated tissue culture polystyrene–TCPS). Freshly isolated CD14+ cells were suspended in SFM containing 10 ng ml−1 M-CSF and 1% PSA at a density of 1 × 10⁶ cells ml−1 and cultured in 1 ml medium per well. Alternatively, to evaluate the response of MDMs to the respective matrices in pro- and anti-inflammatory conditions, all conditions were reproduced using the same cell suspension further supplemented with 100 ng ml−1 IFNγ or 5 ng ml−1 IL-4 (both PeproTech), as previously established.38, 39 The cells were harvested at culture days 1, 4, and 6 for flow cytometry and qPCR analysis. Separate well plates were used for each time point. Independent experiments with five healthy donors were performed.
2.4 Microscopy and quantification of spindle-shaped cellsThe MDMs were monitored by phase-contrast microscopy (Zeiss Axio Observer) throughout the cell culture period and micrographs were acquired at the respective time points (day 1, 4, and 6) prior to harvesting the cells (Zeiss Axiocam 503, both Carl Zeiss Microscopy GmbH, Germany). To quantify the percentage of spindle-shaped cells, the acquired micrographs were analyzed using the cell counter plugin on Image J version 1.52i (National Institutes of Health, USA) by counting spindle-shaped and round cells on a defined area of 300 μm2 at the edge of the respective scaffold.
2.5 Cell culture with DNSC particlesIn a separate experiment, DNSC was scraped using a file to generate DNSC particles (DNSCp). The equivalent of an 0.5 cm2 scaffold piece (⁓ 3 mg) of DNSCp was then suspended in the SFM medium (supplemented as described above) to simulate a degraded scaffold, as well as increase the cell-scaffold contact area. Freshly isolated MDMs were cultured in the presence or absence of DNSCp. Similar to the main experiment, medium with or without additional supplementation with 100 ng ml−1 IFNγ or 5 ng ml−1 IL-4 was used to mimic pro- and anti-inflammatory environments. Cells were cultured, harvested, and analyzed similarly as described in the previous section. Independent experiments with three healthy donors were performed.
2.6 Live/dead stainingLabeling of live and dead cells was performed using a two-component LIVE/DEAD® Viability/Cytotoxicity Assay Kit for mammalian cells (Invitrogen Molecular Probes, ThermoFisher Scientific), consisting of Calcein AM and Ethidium homodimer-1 (EthD-1) for labeling of live and dead cells respectively. After 24 h of culture with DNSC or on TCPS, MDMs were resuspended in SFM medium containing 2 μM Calcein AM and 4 μM of EthD-1 for 40 min 37°C, 5% CO2, and 95% humidity and visualized by fluorescence microscopy (Zeiss Axio Observer). Images were processed using ZEN software version 2.3 (Carl Zeiss Microscopy GmbH). To quantify the percentage of viable and dead cells, the acquired micrographs were analyzed using the cell counter plugin on Image J version 1.52i (National Institutes of Health, USA) by counting the cells on a defined area of 300 μm2 at the edge of the scaffold or central part of the image from TCPS. Images acquired from two different wells were used for the quantification.
In a separate experiment, a similar labeling procedure was performed after culturing freshly isolated CD14+ monocytes for 5 h with DNSC or on TCPS, to ensure early analysis before the occurrence of phagocytosis of dead cells. The cells were analyzed by confocal laser scanning microscopy (Leica TCS SP5 MP, Leica Microsystems GmbH, Germany). Images were processed using ImageJ version 1.52i.
2.7 Flow cytometry analysisTo harvest MDMs on culture days 1, 4, and 6, the cells were detached by incubating on ice for 30 min and washing each well twice with 500 μl of MACS separation buffer. The harvested cells were then centrifuged at 300g for 10 min and resuspended in a staining mix consisting of MACS separation buffer and optimal concentration of staining reagents as estimated by titration–1:40 of FcR blocking reagent (Miltenyi Biotec), FITC-conjugated anti-CD38 antibody, and 1:100 of APC-conjugated anti-CD206 (both Biolegend, San Diego, CA, USA). The cells were incubated for 30 min in the dark at 4°C, washed with 300 μl MACS separation buffer, and centrifuged for 10 min at 300g. Lastly, the stained cells were resuspended in MACS separation buffer containing 7AAD (dilution 1:100) and processed for flow cytometry analysis (BD FACSCanto™ II). In the experiment with DNSCp, cells were centrifuged by density gradient centrifugation after harvesting to remove the debris of scaffold particles before the staining. Appropriate controls, such as FMO (fluorescence minus one) and unstained sample, as well as corresponding isotype controls (FITC- and APC-conjugated mouse IgG1, both Biolegend) were used to estimate background staining.
2.8 Quantitative reverse transcription PCR (RT-qPCR)For RT-qPCR, mRNA of the cultured cells was isolated and purified using RNeasy Mini Kit (QIAGEN, Netherlands), according to the manufacturer's instructions, and stored at −80°C for later use. RNA concentration was estimated on a TECAN NanoQuant Plate™ (Tecan Austria GmbH, Austria) using a spectrophotometer (Infinite 200 PRO, Tecan Austria GmbH) by measuring the absorbance at 260 and 280 nm. The mRNA sample was then treated with DNAse (Promega, Germany) for 30 min at 37°C to eliminate any residual DNA contamination and cDNA was synthesized from 100 ng of total RNA in a volume of 20 μl using the SensiFASTTM cDNA Synthesis Kit (Bioline, Meridian Bioscience, Germany) according to the manufacturer's instructions. Subsequently, qPCR was performed using FastStart Essential DNA Probes Master mix, primers listed in Table 1, and the corresponding probes from the Universal Probes Library on a Roche LightCycler® 96 Instrument (all Roche Diagnostics GmbH, Germany). The cycling protocol recommended by the manufacturer was used −10 min preincubation at 95°C followed by 45 cycles of 10 s at 95°C and 30 s at 60°C. For IL-6, gene expression was measured using TaqMan™ Gene Expression Assay (Hs00174131_m1, Thermo Fischer Scientific, Germany). All reactions were performed in duplicate. The expression of all genes was calculated using the 2-(∆Cq) method relative to the average of 4 reference genes—beta-actin (ACTB), glyceraldehyde 3-phosphate dehydrogenase (GAPDH), beta-2-microglobulin (B2M), and ribosomal protein L4 (RPL4).
TABLE 1. Summary of investigated genes, specific primers, and used probes Gene UPL probe # Primer forward Primer reverse IL1B 10 AAAGCTTGGTGATGTCTGGTC AAAGGACATGGAGAACACCACT TNF 40 CAGCCTCTTCTCCTTCCTGAT GCCAGAGGGCTGATTAGAGA CCL18 84 ATGGCCCTCTGCTCCTGT AATCTGCCAGGAGGTATAGACG ACTB 11 ATTGGCAATGAGCGGTTC CGTGGATGCCACAGGACT GAPDH 60 AGCCACATCGCTCAGACAC GCCCAATACGACCAAATCC B2M 42 TTCTGGCCTGGAGGCTATC TCAGGAAATTTGACTTTCCATTC RPL4 30 CCAAAAACGATACGCCATCT GAACTTCCTCAATACGATGACCTT 2.9 MultiplexFor multiplex analysis, the cell culture supernatants were collected at culture days 1, 4, and 6 and centrifuged twice at 400g at 4°C for 5 min to remove any residual cells. A subsequent centrifugation step was performed at 10,000g at 4°C for 10 min to get rid of cellular debris. The supernatants were then split into three aliquots and stored at −80°C until further use. Multiplex assay was performed using a premixed Magnetic Luminex assay for detection of CCL18, IL-6, TNF-α, and IL-1β (R&D systems, Bio-Techne) according to the manufacturer's instructions. All reactions were performed in duplicate. Measurements were acquired using the MAGPIX System and analyzed using Luminex xPONENT® Software 4.0 (both Luminex).
2.10 Migration assayTo analyze directed cell migration, a modified, 48-well Bodyen Chamber and polycarbonate filters with 8 μm pores (NeuroProbe Inc., Baltimore, MD, USA) were used. The assay was performed as previously described.40 Human CSPC cultures from osteoarthritis patients undergoing knee joint replacement were established with the approval of the local ethics committee (votum No. 89/14) as described previously.41 Trypsinized articular CSPCs were suspended in SFM supplemented with M-CSF (2 × 10⁵ cells ml−1). The lower chamber compartment was filled with undiluted supernatants of MDMs cultured with DNSC or on TCPS, whereby SFM served as a control (basal migration). The same supernatants, which were used for cytokine concentration analysis, were used for the migration study. After covering with polycarbonate filter, 50 μl of cell suspension containing 10,000 cells was added to the upper compartments, followed by incubation for 4 h at 37°C, 5% CO2, and 95% humidity. Non-migrated cells (upper side of the filter) were removed with a cell scraper and migrated cells (lower side) were fixed with 4% formaldehyde, followed by staining with Giemsa solution (Merck, Germany). The results were shown as the chemotactic index (CI), constituting the average number of migrated cells in stimulated wells divided by the average number of migrated cells in the respective control. The mean basal migration was 41.9 cells per well. Independent experiments with supernatants from three MDM donors were conducted. 2–4 replicates per sample were analyzed depending on the available amount of supernatant.
2.11 Uptake and release studiesFor the uptake studies, two different batches of desiccated scaffolds were precut into 0.5 cm2 cubes, placed in a 24-well plate, and rehydrated for 24 h in 1 ml SFM supplemented with 10 ng ml−1 M-CSF and 1% PSA, as well as IL-4 at various concentrations (see Results Sections 3.5 and 3.6). After 24 h, the leftover medium was collected into Eppendorf tubes and stored at −80°C for later analysis. The well plates, as well as the collection tubes, were previously passivated with 10 mg ml−1 BSA (MilliporeSigma, Germany) for 1 h. The size of the rehydrated DNSC scaffolds was adjusted to the dimensions used in the cell culture experiments. Afterward, the scaffolds were briefly washed with SFM to remove any residual IL-4 and transferred to a new passivated 24-well plate. The IL-4-loaded scaffolds were then suspended in fully supplemented SFM free of any IL-4. The medium was collected into passivated Eppendorf tubes after 3, 24, and 96 h and stored at −80°C until further analysis. The supernatants from both loading and release experiments were analyzed using Human IL-4 Quantikine ELISA Kit (R&D systems, Bio-Techne) according to the manufacturer's instructions. All reactions were performed in duplicate. Furthermore, to estimate the exact concentration of IL-4 used in the cell culture experiments and account for any errors during the cytokine stock preparation, SMF supplemented with 5 ng ml−1 IL-4 was prepared in three separate passivated Eppendorf tubes and analyzed by ELISA. For cell experiments with IL-4-loaded DNSC, the loading was performed similarly as described above. However, unlike the release experiment, 24-well plates used for the cell culture study were not passivated to avoid any interference with cell adhesion or alterations of cell culture conditions potentially caused by the BSA (e.g., sequestration of the cell-secreted factors). Independent experiments with two healthy donors were conducted.
2.12 Immunohistochemistry of IL-4-loaded DNSCThe distribution of IL-4 within DNSC was evaluated by immunohistochemical staining (IHC) of IL-4-loaded scaffolds. To ensure sufficient staining intensity, a higher IL-4 concentration consisting of 10 μg ml−1 of the cytokine was used as compared to the experiments with ELISA. Following the loading for 24 h as described above, DNSC scaffolds were washed with DPBS to remove any residual cytokine, fixed with 4% neutral buffered formalin, embedded in paraffin, and sectioned at 5–7 μm. The tissue sections were subjected to antigen retrieval with citrate buffer pH 6.0 at 80°C for 20 min and incubated with endogenous peroxidase blocking solution (Dako, Agilent Technologies, Germany) for 30 min, followed by blocking with 10% normal sheep serum for 30 min. Next, the sections were incubated with a primary antibody against human IL-4 (Epigentek, Biocat, Germany) 1:100 at 4°C overnight and washed in PBS 0.1% Tween 20 before adding secondary antibody (biotinylated anti-rabbit IgG) for 45 min. The sections were then washed again before the application of streptavidin-biotinylated horseradish peroxidase complex (GE Healthcare) and visualized with 3-amino-9-ethylcarbazole (AEC) peroxidase substrate solution (ScyTek Laboratories, Germany).
2.13 StatisticsAll data were analyzed using GraphPad Prism version 5.03 for Windows (GraphPad Software, CA, USA) and displayed as mean SD unless indicated otherwise. One-way analysis of variance (ANOVA) and Tukey's post-hoc multiple comparison test were used to analyze multiple samples. One-tailed Mann–Whitney U test was used to compare individual samples when variances between the samples differed significantly based on the results of Bartlett's test for homogeneity of variances. Asterisks denote statistical significance as follows: * (p < .05), ** (p < .01), *** (p < .001).
3 RESULTS 3.1 DNSC induces phenotypical changes in MDMsTo ensure that the viability of macrophages was not affected by DNSC, we performed live/dead staining after approximately 5 h (Figure S1A) and 24 h of MDM culture with the scaffolds (Figure 1A). Overall, no qualitative differences in cell viability were observed as compared to the MDMs cultured on TCPS (negative control). Similarly, quantification of the viable and dead cells did not reveal any difference between DNSC and TCPS after 24 h (Figure S1C). Furthermore, no significant differences in MDM viability were observed after 24 h culture with DNSC and the control matrices by flow cytometry (Figure S1D).

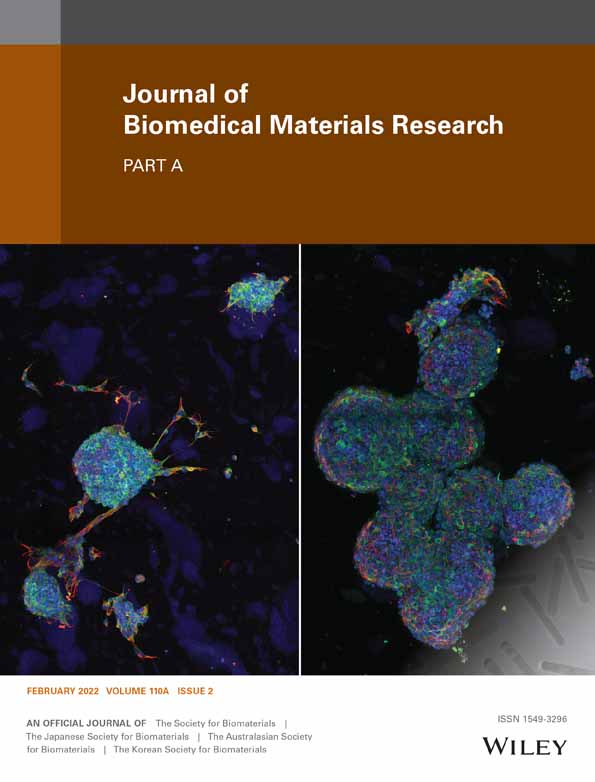
Macrophage phenotype. (A) Live (green) and dead (red) staining of macrophages cultured for 24 h with DNSC or on TCPS. Phase-contrast images displaying the same region show the scaffold edge, visible as a cell-free dark region on the fluorescent images. Scale bar 50 μm. (B) Percentage of spindle-shaped cells after 24 h of culture on DNSC and the control conditions. Mean ± SD of 5 MDM donors. *p < .05, ***p < .001, ANOVA. (C) An overlay of representative flow cytometry plots of the different culture conditions depicting the expression of CD206 (M2 marker) and CD38 (M1 marker). The adjunct histograms show higher fluorescence intensity of CD206 on DNSC, especially at culture days 1 and 4. The expression of CD38 is negligible in all conditions. (D) Graphs depicting the influence of IL-4 treatment on the increase of CD206 median fluorescence intensity (MFI) on culture days 1, 4, and 6. Note the steep increase of CD206 with IL-4 treatment in all control conditions and the delayed and reduced increase on DNSC and DNSCn matrices (blue). Data expressed as the mean of the MFI values from five MDM donors in untreated and IL-4-treated samples, the error bars were omitted to emphasize the overall effect of the treatment. DNSC, a constant batch of Decellularized Nasal Septal Cartilage used for all donors; DNSCn, random batch of DNSC per each donor; PRTX, Parietex™ composite; SIS, small intestine submucosa; TCPS, tissue culture polystyrene
Clustering of macrophages around the scaffolds became evident already after 5 h, where distinct groups of viable cells were found at the edges of the scaffold (Figure S1A). After 24 h of culture, macrophages were found in close contact with DNSC and exhibited a more spindle-shaped morphology as compared to the reference matrices (Figure S1B), possibly reflecting migratory behavior of MDMs toward the scaffold. Somewhat similarly, spindle-shaped cells were also found on PRTX, while the cells on TCPS and SIS were mostly round. Quantification of spindle-shaped cells revealed that the morphological change was consistently present across various donors and various DNSC batches (DNSCn), suggesting that MDMs specifically reacted to the scaffold (Figure 1B). Later in the culture, visual differences between MDMs on different matrices became less apparent (not shown).
Flow cytometry analysis of MDMs cultured with DNSC revealed an increase of the M2 marker CD206 already at culture day 1 as compared to the other matrices (Figure 1C). The difference in CD206 expression gradually became less pronounced on days 4 and 6. The expression of M1 marker CD38 was negligible in all conditions at every time point in the culture. Therefore, CD38 was not useful for distinguishing macrophage activation status across various matrices. Furthermore, CD38 was also found to be expressed on freshly isolated monocytes, albeit lost upon their differentiation into macrophages (Figure S1F,E). However, the marker still proved helpful in distinguishing the untreated MDMs from classically activated M1 macrophages (i.e., IFNγ-treated), a part of which were similarly positive for CD206 but, at the same time, co-expressed CD38 (Figure S1E).
As expected, IL-4 caused an increase in the expression of the M2-characteristic CD206 marker but this increase was markedly slower on DNSC compared to all the other conditions, starting only at day 4 of the culture (Figure 1D). The viability of MDMs was not influenced by IL-4 on any matrix (Figure S1D).
3.2 DNSC causes an increase in the production of pro-inflammatory cytokinesTo evaluate macrophage response to DNSC, we cultured MDMs with DNSC or the control matrices and tested the cell culture supernatants after 1, 4, and 6 days for the presence of classical M1 inflammatory cytokines, such as IL-1β, TNF-α, and IL-6, as well as chemokine CCL18 characteristically produced by the M2 macrophages. MDMs responded to DNSC by an increased secretion of IL-1β, TNF-α, and IL-6 (Figure 2A). Consistent with the previous reports,35 neither SIS nor TCPS caused the inflammatory response, whereas PRTX led to an increase in the secretion of IL-1β, and to a lesser degree, TNF-α, and IL-6. However, unlike DNSC, the amounts of inflammatory cytokines secreted by MDMs in response to PRTX were usually only slightly higher in comparison to TPCS or SIS, showing no significant differences (Figure 2A). In contrast, MDMs responded to DNSC with a significant increase of pro-inflammatory cytokine production on culture day 1 amounting up to a 5-fold difference in the secretion of IL-1β, 19-fold in TNF-α, and 17-fold in IL-6, as compared to TPCS.

The inflammatory response of macrophages. (A) The secretion of M1 (IL-1β, TNF-α, IL-6) and M2 (CCL18) inflammatory factors on culture days 1, 4, and 6. Data are expressed as the mean of five individual donors. The error bars are ± SD of the highest value, that is, day 1 for M1 cytokines and day 6 for CCL18. Onetailed Mann–Whitney U test was used to compare the conditions individually to TPCS control; *p < .05, **p < .01. (B) RT-qPCR of MDMs cultured with DNSC and the control matrices for 1, 4, and 6 days. Mean ± SD of five individual donors. One-tailed Mann–Whitney U test was used to compare the conditions individually to DNSC and DNSCn, *p < .05, **p < .01. All RT-qPCR data were calculated as the gene expression (2-ΔCq) relative to the average of four reference genes (GAPDH, ACTB, B2M, RPL4). DNSC, decellularized nasal septal cartilage; MDMs, monocyte-derived macrophages; RT-qPCR, reverse transcription PCR; TCPS, tissue culture polystyrene
On culture days 4 and 6, the secretion of M1 inflammatory cytokines on DNSC gradually reduced, albeit differences to the reference cultures remained visible. In contrast, at later time points, the production of M2 chemokine CCL18 was increased on DNSC, reaching up to 8-fold difference to that on TPCS by culture day 6 (Figure 2A). Approximately a 2-fold increase in the secretion of CCL18 was also visible on PRTX as compared to the TCPS control, whereas SIS and TCPS showed no visible differences. Furthermore, albeit nonsignificant, a difference in the levels of CCL18 secretion was detectable between DNSC and DNSCn, suggesting some degree of batch-to-batch variation.
Consistent with the results of the multiplex analysis, gene expression of the inflammatory markers revealed similar patterns of high IL1B (IL-1β) expression at the beginning of the culture period and increasing CCL18 expression by culture days 4 and 6 (Figure 2B). Differences in the gene expression of these factors across matrices were generally comparable with those in the protein secretion levels. Here too, the difference between the expression of CCL18 in response to DNSC and DNSCn highlighted some degree of variation between DNSC batches. The results of gene expression analysis of TNF-α (TNF); however, did not reflect the levels of the secreted TNF-α protein and were relatively similar across the culture conditions. However, the lack of correlation between mRNA levels and protein secretion of TNF-α has been previously reported.27 Importantly, the addition of IL-4 to the culture medium completely antagonized the production of all M1 cytokines at every time point and in all conditions including DNSC (Figure 3A). Furthermore, IL-4 stimulated the polarization of macrophages toward M2, as evidenced by the increase in CCL18 expression.

IL-4-mediated attenuation of the inflammatory response. (A) Resulting change in the relative expression of inflammatory cytokines following the IL-4 treatment. Colored lines depict changes in the production of M1 (red) and M2 (blue) inflammatory factors on DNSC and DNSCn. Data are expressed as the mean of five individual donors, the error bars were omitted to emphasize the overall effect of the treatment. (B) The influence of macrophage supernatants on the migration of healthy human CSPCs. MDMs were cultured with DNSC or on TCPS in the absence or presence of IL-4. Data are shown as mean ± SD of 3 CSPCs donors; *p ≤ .05 depicts the significance of DNSC untreated versus DNSC + IL-4 derived from culture day 1. †p ≤ .05 shows significance for DNSC untreated vs. DNSC + IL-4 derived from culture day 4. Both One-tailed Mann–Whitney U test. DNSC, decellularized nasal septal cartilage; IL-4, interleukin-4; MDMs, monocyte-derived macrophages; TCPS, tissue culture polystyrene
Overall, MDMs reacted to the DNSC scaffold by the secretion of type 1 inflammatory cytokines at the initial stages, which was retained to some degree throughout the culture but could be effectively antagonized by the addition of IL-4 to the culture medium. However, by the end of the culture, a decrease in the levels of M1 pro-inflammatory cytokines was accompanied by the production of M2 factor CCL18, signifying the phenotypical switch of MDMs toward M2.
3.3 DNSC particles evoke similar inflammatory response patterns in MDMs as the intact scaffoldsBiophysical aspects, such as pore size and scaffold shape, can influence macrophage response to the matrix.24, 26, 35 To exclude the influence of these factors on macrophage polarization, as well as increase the matrix-to-macrophage contact surface, we prepared fine particles from DNSC (DNSCp, see Materials and Methods, Section 2.5), which were then suspended in the SFM for macrophage culture. Similar dynamics of inflammatory reaction were observed with the scaffold particles as previously seen with the intact DNSC matrices. Particularly, MDMs responded to DNSC particles with increased secretion of IL-1β, TNF-α, and IL-6 at the beginning of the culture, which gradually decreased by culture days 4 and 6 (Figure S2A). Comparable observations were made by RT-qPCR analysis (Figure S2B). As with the intact DNSC, MDMs reacted to DNSCp by the production of CCL18 on both gene expression and protein levels by days 4 and 6. Consistent with the previous experiments, macrophages did not display any reactivity toward TCPS. Overall, culturing MDMs in the medium containing DNSCp did not lead to any major changes in the reactivity of macrophages to the matrix.
3.4 Macrophage-secreted factors inhibit the migratory activity of CSPCsCartilage regeneration and deposition of new cartilage ECM is mostly directed by CSPCs, which are characterized by high-migratory capacity.12, 13, 42 The migratory phenotype is thought to be crucial for the regenerative properties of CSPCs.12, 42 Inflammatory factors, such as TNF-α and IL-1β are known to inhibit the migratory activity of CSPCs.41 Since the unhampered activity of CSPCs would be a prerequisite for the efficient remodeling of DNSC in vivo, we inquired if factors produced by macrophages in response to the DNSC could potentially interfere with the migratory capacity of CSPCs. Such interference would in turn delay the repopulation and remodeling of DNSC by CSPCs after transplantation. To this end, we tested the influence of supernatants from MDMs cultured with the DNSC on the migratory activity of CSPCs.
The supernatants from MDMs cultured with the DNSC significantly inhibited the migratory activity of CSPCs, whereas supernatants from TCPS cultures did not have such an effect (Figure 3B). Furthermore, the inhibitory effect of the supernatants on CSPC migration reflected the gradual decrease in the production of M1 inflammatory cytokines, being less pronounced in supernatants obtained from culture days 4 and 6. Importantly, cell culture supernatants containing IL-4 did not have any negative effect on CSPC migration and even slightly enhanced it. This too was in line with the observed attenuation of M1 inflammatory cytokine production by IL-4.
3.5 IL-4 can bind to the DNSC matrixAs previously mentioned, IL-4-induced increase of CD206 expression was delayed on DNSC as compared to the control conditions (Figure 1D). Based on this observation, we hypothesized that IL-4 could be binding to the DNSC, thereby causing the depletion of the cytokine and resulting in the delay of the IL-4-induced effect. Given that IL-4 can effectively antagonize the inflammatory response of MDMs to DNSC, the binding of IL-4 to the matrix could be an advantage for reducing the inflammatory reaction. To test if DNSC can deplete IL-4 from the medium, we incubated 0.5 mm pieces of two different DNSC batches in SFM containing 0.6 μg ml−1, 0.3 μg ml−1, or 0.15 μg ml−1 IL-4 (i.e., loading medium) for 24 h. For consistency, among them was the constant DNSC batch used throughout our experiments on the MDM inflammatory response. We then analyzed the loading media for IL-4 content using ELISA to assess if the cytokine concentration was reduced after the incubation. To account for the stock solution and/or pipetting errors, as well as any technical discrepancies during the ELISA measurement, we further tested the exact IL-4 concentration in the initial loading media, using the resulting values to estimate the amounts of the depleted IL-4.
In all loading media, approximately 60% of the initial IL-4 was depleted (Figure S3A). To see if any IL-4 can be released from the DNSC, we then transferred the scaffolds to a new well plate and suspended them in the SFM medium not containing any IL-4. The release of the cytokine was still detectable after 96 h, constituting a total of ≤65% of the depleted IL-4 for scaffolds loaded with 0.6 and 0.3 μg mL−1 of the cytokine and 38% for the scaffolds incubated with 0.15 μg ml−1 IL-4 (Figure S3A). Furthermore, to check the distribution of the bound factor within the scaffold, we performed immunostaining of the IL-4-loaded DNSC and found an evenly distributed staining for IL-4 across lacunae of the cartilaginous matrix (Figure 4A). Together, these results indicated that DNSC can reversibly bind IL-4, which is released over course of several days.

Loading of DNSC with IL-4 and modulation of macrophage response. (A) Immunohistochemistry of DNSC against IL-4 after 24 h of loading with 10 μg ml−1 cytokine. An even distribution of the staining across lacunae in the central part of the scaffold is visible. Scale bar 100 and 500 μm. (B) The amount of recovered IL-4 in the medium after culturing MDMs for 24 h with two different batches of DNSC (Batch A and B) preloaded with 5 or 25 ng ml−1 cytokine for 24 h. As a control, cells were cultured on TCPS in SFM supplemented with 5 ng ml−1 IL-4. Comparable levels of the released IL-4 relative to the soluble control were detected. Mean ± SD two experiments. (C) The secretion of inflammatory cytokines after 24 h of culture with untreated DNSC, DNSC preloaded with 5 or 25 ng ml−1 IL-4, or on TCPS with and without IL-4 supplementation. DNSC, decellularized nasal septal cartilage; IL-4, interleukin-4; MDMs, monocyte-derived macrophages; SFM, serum-free medium; TCPS, tissue culture polystyrene
3.6 Estimation of the optimal IL-4 loading and release for DNSC functionalizationWe next decided to test if IL-4 released from the cytokine-loaded DNSC would attenuate the inflammatory response of MDMs toward the matrix, as previously observed with the soluble IL-4. We, therefore, intended to culture MDMs with the IL-4-loaded DNSC for 24 h, when the production of M1 inflammatory factors was typically most acute. However, as the first step for this experiment, we had to estimate the concentration of IL-4 released after 24 h, which would be comparable to the concentration of the soluble IL-4 used throughout the study (5 ng ml−1). Based on the observed loading and release dynamics described above, the uptake with the lowest tested loading concentration (ELISA measurement 154.85 ng ml−1) constituted ~69% (107 ng ml−1). After 24 h, approximately 30% of the uptake concentration was released from the scaffold (32 ng ml−1) (Figure S3A,B). Furthermore, to make the estimation as exact as possible, we proof-tested the concentration of soluble IL-4 used in our experiments by ELISA. As measured in three separately prepared samples, IL-4 in the supplemented medium constituted on average 3.73 ng ml−1 (i.e., ~75% of 5 ng ml−1, which was the presumed concentration; Figure S3B). Considering these calculations, we approximated that the loading of DNSC with 25 ng ml−1 should have led to the release of the cytokine comparable to the amo
留言 (0)