
記住我


In recent years, artificial intelligence (AI), especially deep learning, has revolutionized the field of dentistry. AI technology has been widely applied for orthodontic tasks, including the identification of cephalometric landmarks,1-13 the determination of orthodontic treatment plans,14-23 the determination of the degree of maturation of the cervical vertebra 24, 25 and categorization of lateral cephalometry.26 Among these orthodontic tasks, AI has been successfully applied in the identification of landmarks,23 because lateral cephalograms are still essential for the diagnosis and planning of treatment in modern orthodontic, and the identification of anatomical landmarks based on a visual assessment of the lateral cephalograms remains a task that requires specially trained experts. A fully automated cephalometric analysis reduces the workload during routine clinical services and gives orthodontists more time for optimal treatment planning.
Thus far, various methods, such as knowledge-based techniques with edge tracking,27-29 a fuzzy system,30 pattern-matching techniques,4, 31 a model-based approach7 and neural networks,1, 3, 5, 9, 12, 13 have been developed and are available. The evaluation method varies among the studies, and the distance between the positions located by the system and positions located by an orthodontist/orthodontist was reported to be <2 mm,2, 11, 27, 28, 30, 31 with varying confidence ellipses 4, 6, 12 (linear and angular measurements of <2 mm and <2° are defined as ‘successful’13, 29), and most studies have shown that AI systems that recognize landmarks are clinically acceptable.
While these studies validated the clinical applicability of AI systems, hardly any studies examined the validity according to a variety of different images of cephalograms. When orthodontists use systems in the clinical setting, different types of patients and the detailed characteristics of the images used as testing samples should be considered. The applicability of the system to various images, taking patient-oriented differences into consideration (eg, dental and skeletal maturation (age), metal orthodontic appliances that are related to the artefact, cleft lip and/or palate, negative overjet and ethnicity) and image-oriented differences (eg, vendors or apparatus settings), is important information for orthodontists.
Thus, part I of the present study focuses on patient-oriented variations. The aim of the present study was to determine whether AI systems that recognize cephalometric landmarks can applied in the evaluation of various patient groups (ie, those with permanent dentition, those with mixed dentition, those with cleft lip and palate, those with orthodontic appliances and those with negative overjet), and to determine the patient-related factors associated with identification errors. For this purpose, the present study employed a recently developed AI system.32
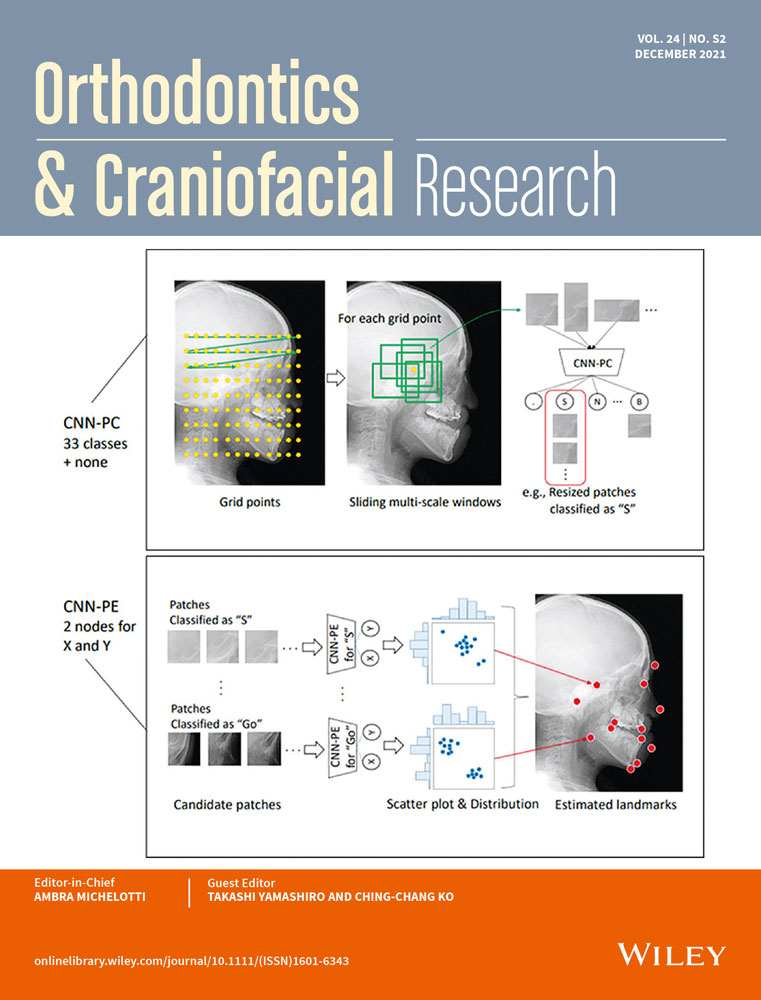
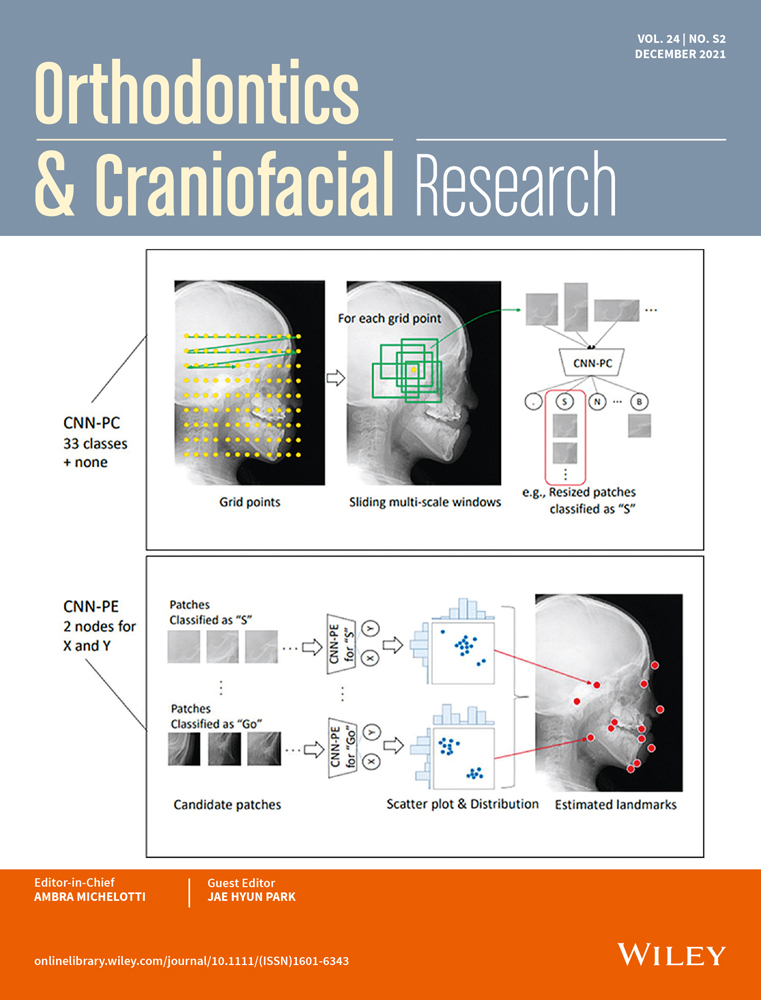
2 MATERIALS AND METHODS 2.1 Architecture of the previously developed systemThe system employed in the present study, which performs automatic recognition of anatomic landmarks on lateral cephalograms, is shown in Figure 1. Briefly, the system performance is divided into two major tasks: the training (model learning) phase and the landmarking (recognition) phase. In the training phase, two deep convolutional neural networks for landmark patch classification (CNN-PC) and landmark point estimation (CNN-PE) were used. In the landmarking phase, landmarks in a given cephalogram were estimated using trained neural networks. Details of the system are shown below and have been reported elsewhere.32

System architecture. The structure of CNN-PC and CNN-PE (convolutional neural networks for patch classification and point estimation)
2.1.1 Training PhaseThe dataset contained multi-scale image patches, including landmarks with their names and locations, as illustrated in Figure 1. The landmark name and location were used as labels during the training of neural networks for patch classification and point estimation, respectively. The definitions of the landmarks are shown in Appendix A1. Patches with various rectangular shapes, the width and height of which were within the range of 64-256 pixels, were extracted and resized to 64 × 64 pixels. The point location was stored as a set of X and Y coordinates in the patch, which are not the coordinates of the original cephalogram. In addition, data augmentation operations for the patches were performed during training through a rotation operation and gamma-correction.4
2.1.2 Structure of deep neural networksThe CNN-PC consisted of a set of three convolutions and pooling layers and two fully connected layers with a softmax layer. Rectified Linear Unit (ReLU) activation was performed after each convolution, and the Adam optimizer33 was used for learning. Similarly to the CNN-PC, a CNN-PE has a two-node layer for estimating X and Y coordinates, instead of a softmax layer. Multiple CNN-PEs, each of which was trained using patches for the corresponding landmark, were prepared.
2.1.3 Landmarking PhaseIn this phase, landmark points for a given cephalogram were estimated using trained neural networks. This phase consisted of two steps: patch classification and point estimation. First, given a cephalogram, the system sets grid points as illustrated in Figure 1 (top right). For each grid point, the system cropped multiple patches using multi-scale windows and classified them by CNN-PC. The classified and resized patches were stored as candidate patches of the corresponding landmarks. Second, given a set of candidate patches, the X and Y coordinates were estimated by the corresponding CNN-PE for each landmark. An example plot of the estimated coordinates is illustrated in Figure 1 (bottom right) as a 2D scatter plot with its distribution. Based on the scatter plot, one median point was computed as a landmark point. Before computation, points for which the Euclidean distance from the median was greater than two times the standard deviation (ie, ±2σ) were omitted as outliers.
2.2 SamplesThe protocols for the present study were approved by the Research Ethics Committee, Osaka University Dental Hospital (project ID: H30-E14). Digital lateral cephalograms were obtained from 1785 Japanese orthodontic patients (828 male and 957 female patients; mean age, 12.2 ± 5.4 years; age range, 5.4-56.5 years) who had visited the university dental hospital between 2010 and 2018 for orthodontic treatment. Patients were consecutively enrolled. The diagnosis of these patients was malocclusion without any surgery in 43.0% of cases, jaw deformity requiring orthognathic surgery in 7.0% of cases, and unilateral cleft lip and palate in 48.9% of cases. Among the patients, 28.9% wore orthodontic appliances (eg, a lingual arch, edgewise appliance). All images were recorded in DICOM format using a cephalometric scanner (CX-150 W; Asahi Roentgen Ind. Co., Ltd.). The original cephalogram size was 2100 × 2500 pixels with a pixel spacing of 0.1 mm. The landmark points (ie, ground true values) of 17 hard tissue and 9 soft tissue landmarks were visually identified by one of the authors (JL), and double-checked by another author (CT), as gold standard values. Author JL was a graduate student and CT was a faculty (a 20 years experienced orthodontist) of the orthodontic department. The dataset of the cephalogram, landmark name and landmark location were used for system development and system evaluations.
2.3 AnalysesFrom all samples, eight subgroups that consisted of >50 patients in each subgroup were extracted according to the four criteria (permanent dentition or mixed dentition; patients with or without cleft lip and/or palate; cases using orthodontic appliances or not using orthodontic appliances; negative overjet or positive overjet), as shown in Table 1. In each subgroup, 30 cephalograms were randomly selected and used to test the system's performance, and the remaining 1755 cephalograms were used for model learning. The identification errors were determined based on the Euclidian distances between the estimated landmark point and the gold standard. The median identification error was calculated for all landmarks in each subgroup. Furthermore, the success or failure of the assessment by the system was evaluated using confidence ellipses (α = 0.99) created in a previous study.4 In short, when a system-identified point was located within a confidence limit of α = 0.99, the landmark identification was considered successful. The success rates for the recognition of the landmark were defined as the proportion of total samples that could be successfully recognized by the system. The success rates were calculated for all landmarks in each subgroup. This series of processes in the selection of test samples, model learning using the remaining samples and the evaluation of the system using error and success rates in test samples was repeated five times for each subgroup.
TABLE 1. Inclusion criteria for groups 1 to 8, and the demographic data for each group Group 1 Group 2 Group 3 Group 4 Group 5 Group 6 Group 7 Group 8 Permanent dentition (−) (+) (−) (+) (−) (+) (−) (+) Cleft lip and/or palate (−) (−) (+) (+) (+) (−) (−) (−) Orthodontic appliances (−) (−) (−) (−) (+) (+) (−) (−) Overjet (+) (+) (±) (±) (±) (+) (−) (−) # of patients 335 170 316 99 94 69 145 54 Male 40% 37% 57% 51% 54% 29% 44% 46% Age (years) 10.0 ± 1.3 16.4 ± 2.4 8.4 ± 1.6 14.9 ± 0.7 9.0 ± 1.5 24.1 ± 8.0 10.0 ± 1.4 16.8 ± 3.0 Note (+) in the ‘permanent dentition’ rows indicates that ‘cases of the permanent dentition were included’; (−), ‘cases of mixed dentition and primary dentition were included’. (+) in the ‘cleft lip and/or palate’ rows indicates that ‘cases of cleft lip and/or palate were included’; (−) ‘cases of cleft lip and/or palate were not included’. (+) in the ‘orthodontic appliances’ rows indicates that ‘cephalograms taken from patients with orthodontic appliances were included’; (−) ‘cephalograms taken from patients with orthodontic appliances were not included’. (+) in the ‘overjet’ rows indicates that ‘cases of positive overjet were included’; (−), ‘cases of negative overjet were included’.To examine differences in identification errors and success rates among the subgroups, multiple comparisons were conducted with a Kruskal-Wallis test followed by Turkey's multiple comparison post hoc test. Further, to directly determine the effect of dental age, cleft lip and/or palate, the presence of orthodontic appliances, and positive or negative overjet on the success rate of the AI system, a multiple linear regression analysis was conducted (P < .05).
All experiments were performed in Ubuntu 16.04 LTS with a quad-core 3.6GHz CPU, 128GB RAM and Nvidia P100 GPU. Training the proposed CNN models took 10 seconds per epoch for 128 batches.
3 RESULTSFigure 2 shows the mean identification errors in each group (a) and the success rate (b). Groups 4 and 5 showed significantly greater identification errors (1.50 ± 0.52 mm) in comparison with group 7 (1.32 ± 0.37 mm); the success rates of groups 4 and 5 (85%-86%) were significantly smaller in comparison with groups 1, 6 and 7 (90%-91%); the success rate of groups 3, 4 and 5 (85%-87%) were significantly smaller in comparison with group 7 (91%). These results indicate that cephalograms in cases with cleft lip and/or plate showed worse accuracy when the AI was used for automatic recognition of cephalograms.

The median total error (A) and success rate (B) in each group. A multiple comparison was conducted with the Kruskal-Wallis test followed by Tukey's multiple comparison post hoc test. † indicates a significant difference in comparison with group 7; * indicates a significant difference in comparison to groups 1 and 6
Appendix A2 showed the identification errors for each landmark in groups 1-8. For the hard tissue landmarks, the median identification error for each landmark ranged from 0.97 mm for the gnathion to 2.06 mm for the upper molars (U6). For the soft tissue landmarks, the median identification error for each landmark ranged from 0.77 mm for the pronasale to 1.97 mm for the submentale.5
Table 2 shows the success rate for each landmark in groups 1-8. For the hard-tissue landmarks, skeletal landmarks (the menton, pogonion, gnathion, gonion, sella, orbitale, porion and articulare) showed success rates of >90%, whereas the dental landmarks (U6, L6) showed success rates of 73% and 76%, respectively. In particular, groups 5 and 6 (groups with orthodontic appliances) showed relatively low success rates for U6 and L6 (66%-73%). As for the soft-tissue landmarks, the subnasale, pronasale, nasion and stomion showed success rates of >90%, whereas submentale showed a success rate of 74%. In particular, group 8 (permanent dentition with negative overjet) showed relatively low success rate for the submentale (56%).
TABLE 2. Success rate when using the confidence ellipses (α = 0.99) in groups 1 to 8 Group 1 Group 2 Group 3 Group 4 Group 5 Group 6 Group 7 Group 8 Total Hard-tissue Me 100 100 99 99 98 100 99 99 99 Pog 100 99 97 99 97 99 100 99 99 Gn 98 97 99 98 99 99 99 98 98 Go 96 95 97 95 94 97 97 93 96 S 97 93 95 97 90 98 93 92 94 Or 98 98 95 85 92 97 93 89 94 Po 96 91 91 92 87 97 93 91 92 Ar 93 85 95 93 90 93 89 82 90 Point A 99 95 80 75 79 91 99 97 89 L1 88 90 91 80 81 90 94 99 89 PNS 91 88 79 73 81 93 93 85 85 Point B 89 96 74 77 69 92 94 90 85 ANS 93 85 65 79 71 76 93 90 81 U1 89 85 72 55 71 89 89 90 80 N 79 75 75 73 71 89 76 75 77 U6 77 75 73 69 66 73 84 85 76 L6 74 69 72 75 68 67 76 82 73 Soft-tissue sn 98 100 99 100 100 98 98 97 99 prn 99 100 99 100 96 97 98 99 99 n 93 97 97 94 97 98 93 97 96 sto 89 95 96 84 100 95 88 97 93 ls 91 87 86 90 85 91 86 91 89 pog 81 84 88 87 91 81 92 85 86 li 85 75 89 95 95 94 84 73 86 gn 83 80 77 79 70 75 85 79 78 sm 71 64 78 84 77 81 81 56 74 Note The definitions of the landmarks are in Appendix 1.Cleft lip and/or palate were found to be a factor associated with identification errors (P < .05; Table 3), whereas dental age, orthodontic appliances and overjet showed no significant association with identification errors. Figure 2 shows the typical identification results in each subgroup.
TABLE 3. Factors associated with errors in each landmark Unit, mm (+) (−) P-value Median IQR Median IQR Dental age 1.37 0.60 1.39 0.60 .26 Cleft lip and/or palate 1.46 0.69 1.33 0.56 <.01* Orthodontic appliances 1.37 0.60 1.39 0.61 .66 Overjet 1.39 0.61 1.31 0.56 .82 Note IQR denotes interquartile range. (+) in the ‘dental age’ rows indicates that ‘cases of the permanent dentition were included’; (−) ‘cases of mixed dentition and primary dentition were included’. (+) in the ‘cleft lip and/or palate’ rows indicates that ‘cases with cleft lip and/or palate were included’; (−) ‘cases with cleft lip and/or palate were not included’. (+) in the ‘orthodontic appliances’ rows indicates that ‘cephalograms taken from those with orthodontic appliances were included’; (−) ‘cephalograms taken from those with orthodontic appliances were not included’. (+) in the ‘overjet’ rows indicates that ‘cases of positive overjet were included’; (−) ‘cases of negative overjet were included’. 4 DISCUSSIONIn the present study, we used two deep neural networks for landmark patch classification (CNN-PC) and landmark point estimation by regression (CNN-PE). They were trained using multi-scale patches (ie, cropped images that contained landmarks), and 17 hard and 9 soft tissue landmarks were identified. This two-step process of landmark identification with a multi-scale view is considered to be consistent with the clinical examination of cephalograms by orthodontists, as orthodontists usually use both macro- and small-scale examinations when identifying the landmarks. For example, when orthodontists identify the Nasion, they roughly name the landmarks using a macro-scaled examination, including several anatomical structures (eg, the frontal sinus, nasal bone, frontal bone, orbital bone, eye soft-tissue and nasal soft-tissue profile), and then, they conduct a small-scale examination, such as an examination of the intersection of black lines at the frontonasal suture. Thus, the design of the present AI architecture, which uses two types of CNN with multi-scale patches, is considered to be reasonable when AI identify landmarks in a manner that mimics an expert's examination method. Figure 3.

Typical results of Artificial intelligence identification of the cephalograms in each group. Gold standards of the landmarks (blue cross) and system identified landmarks (red cross). The confidence ellipse was drawn from the gold standard. For the soft-tissue landmarks, a 2-mm circle was used as the acceptable area to calculate the success rate
A recently published AI system,12 which was trained with 1028 cephalograms, showed that the mean detection error between AI and humans was 1.46 ± 2.97 mm. It is difficult to compare this result to our result because it is unknown whether the past study included cases with anomalies; however, our results in which the mean detection error between the AI and humans was 1.32-1.50 mm were comparable to the previously published system. Although cleft subgroups had a relatively lower identification accuracy, it should be noted that the amount of median difference was 0.1 mm, which is clinically non-significant.
For evaluation, we employed two types of methods: (a) landmark estimation accuracy based on the Euclidean distance of the error between true and estimated values; and (b) the rate at which the estimated landmark was successfully located within the corresponding norm using a confidence ellipse. The latter evaluation was based on a historical study34 that reported that the identification errors of experts showed direction-oriented errors specific to landmarks. The proposed model successfully identified landmarks within an error range of 1.32-1.50 mm and with success rates of 85%-91%.
Thus far, several AIs that identified cephalometric landmarks have been proposed.1, 3, 5, 9, 12, 13 Recent studies 12, 13 that compared AIs and human detection ability showed that AI showed as accurate an identification of cephalometric landmarks as did human examiners. Almost of these AIs were confirmed to be useful or/and acceptable to use to reduce orthodontists work load in clinical settings. However, in previous studies, there were few studies that examined patient-related factors associated with identification errors, such as dental age, anomalies, orthodontic appliances and overjet. In the present study, we examined detailed factors, which were considered to be associated with detection errors, and found that the cephalograms of patients with cleft lip and/or palate had greater identification errors and dental age, orthodontic appliances and negative overjet (which is associated with the skeletal relationship) had no impact on the accuracy of the
留言 (0)