
記住我


With the introduction of cone beam computed tomography (CBCT), many studies focusing on upper airway morphology have been generated, especially within the orthodontic literature.1, 2 Back in 2012, Van Vlijmen, based on the then-available evidence, could claim that only the studies assessing airway diagnostics showed a scientific impact of CBCT in the orthodontic field.3 Different aspects were analysed by other authors: effects produced by conventional fixed appliance therapy and/or orthognathic surgery, effects produced by extractive treatments and outcomes generated by functional appliance therapy.4-10 Among them, a special interest was devoted to the possible relationships between airway dimensions and different anteroposterior facial patterns.11-18 The interest in elucidating these relationships is not new: airway and the naso-respiratory function have been in the centre of interest among orthodontists since the seventies.19, 20 Despite the large number of studies produced, in 1990 Warren and Spalding stated that the relationship between naso-respiratory function and dentofacial development is anyhow controversial. They postulated that the lack of evidence was most probably related to the shortcomings of two-dimensional (2D) cephalometric measurements as the sole indicators for the upper airways' dimensions.21 Indeed, the controversial results about the relationships between craniofacial anatomy and airway dimension and morphology could be ascribed to the methods applied and the parameters chosen for assessing the upper airway. The 3D information provided by CBCT has the potential to overcome this obstacle. Nevertheless, the controversy became even more complex. Some authors claimed the relationship between skeletal anteroposterior facial patterns and airway volumes,12-14, 17, 22 while many others could not reach the same conclusions.16, 18, 23-25
Although some controversies could be attributed to the lack of consistency between the different methodologies applied, it is believed that assessing the three-dimensional structure of the skull through the lens of traditional schemes could lead to an underrepresentation of this composite musculo-skeletal craniofacial complex. In fact, this system shows an evident complexity that emerges and evolves during the growing processes, following an intricate cross-action of auxologic forces, distortive processes and compensatory mechanisms. For this reason, network analysis methods started to be considered a good approach to investigate standard orthodontic data.26 In daily clinical activity, the orthodontist must identify and locate the critical points of malocclusion to establish objectives, strategies, priorities and treatment sequences. For this reason, it is common practice to divide the morphometric features into three main classes: Class I, Class II and Class III. On the contrary, the heterogeneity of results regarding the link between airway and craniofacial morphology suggests the existence of a different pattern of patient grouping, which has been elusive so far. A possible approach for describing craniofacial complexity can be to look at it as a network and distinguish and visualize the most interconnected clinical data, radiographic representations and functional mechanisms.27 Moreover, Barabasi suggested studying the interactions of a complex system considering its mutual empowerment, stating that ‘the richness of interactions makes that the whole system is greater than the sum of its parts, due to cooperation phenomena between structures, connectivity’.28 A network analysis allows studying a relevant number of interconnected factors simultaneously by visualizing them in a simplified representation, capturing the structures of co-occurrence between them.29 As we stated in a paper belonging to the same special issue, a complex system of interacting agents takes a natural mathematical form of a graph where the vertices are the system elements, and their complex interaction is put in the form of an edge.28, 29 By taking into account patients' variability, network theory can optimize the correct diagnosis in precision medicine modelling. Therefore, by applying the complex network methods to the field of orthodontics, it can enable the identification of some general rules governing the growth and development of the entire craniofacial system, which has been vague so far.27, 30
1.1 AimTo verify the existence of different patient grouping patterns, besides the traditional skeletal and dental malocclusion classification, and assess their correlation with upper airway measurements. A network analysis of the cephalometric measurements will be performed, including and excluding areas and volumes of the upper airways. A community detection approach will be applied to test the null hypothesis that similar clusters of subjects exist within the network.
2 MATERIALS AND METHODS 2.1 SubjectsPre-treatment CBCT scans of 90 young adults, consisting of 32 males and 58 females (13-43 years of age), were obtained from the available records from the clinic of the Section of Orthodontics, Aarhus University. All data used in this study have been previously analysed and published.23 Only the fully anonymized results from the descriptive tables (Tables 1-4) were used in the present article, making it unnecessary for an Ethical Committee's approval.
TABLE 1. List and definition of the cephalometric landmarks used in the upper airway analysis Measurements Description Skeletal A Position of the deepest concavity on anterior profile of the maxilla ANS Tip of anterior nasal spine B Most posterior point on the anterior contour of the lower alveolar process Ba Most postero-inferior point on the clivus GH-l Greater horn of the hyoid bone left GH-r Greater horn of the hyoid bone right GoL The most inferior-posterior point on the left angle of the mandible GoR The most inferior-posterior point on the right angle of the mandible H Uppermost point of the hyoid bone ii A point midway between the incisal edges of the maxillary and mandibular central incisors Me The most inferior point of the bony symphysis anteriorly MoL The distal tip of the first left molar in the jaw of interest MoR The distal tip of the first right molar in the jaw of interest N The intersection of the internasal and frontonasal sutures in the midsagittal plane OrR The most inferior anterior point on right orbit's margin OrL The most inferior anterior point on left orbit's margin PNS The most posterior point on the bony hard palate Pl Centroid of the greater palatine foramen left Pr Centroid of the greater palatine foramen right PoL Most superior point of the outline of the external auditory meatus left PoR Most superior point of the outline of the external auditory meatus right PoG The most anterior point of the bony chin in the midsagittal plane S Midpoint of the sella turcica So Midpoint of the sella-basion line Zs-L The most inferior point of the left zygomaticomaxillary suture Zs-R The most inferior point of the right zygomaticomaxillary suture Airway ad1 Intersection of the line PNS-Ba and the posterior nasopharyngeal wall ad2 Intersection of the line PNS-So and the posterior nasopharyngeal wall P3 Intersection between the posterior pharyngeal wall and the bisected Occlusal plane (OP) T2 Intersection between the contour of the tongue and the bisected OP E Most superior point of epiglottis E1 Frontal wall of pharyngeal airway over E1-E2 line E2 Posterior wall of pharyngeal airway over E1-E2 line TABLE 2. Definition of the linear and angular measurements performed on facial skeleton and upper airway measurements Skeletal measurements Sagittal S-N-Pog (deg) Angle formed by Sella, Nasion and Pogonion SNA (deg) Angle measuring the anteroposterior relationship of the maxillary basal arch on the anterior cranial base SNB (deg) Angle measuring the anteroposterior relationship of the mandibular basal arch in relation to the anterior cranial base ANB (deg) Angle showing the anteroposterior relationship between the maxillary and mandibular apical bases S-Pog (mm) Distance from Sella point to Pogonion PNS-Ba (mm) Sagittal depth of the bony nasopharynx Ba-Me (mm) Distance between Ba point and Me point A-Frank perp (mm) Distance from A point to Frankfurt Perpendicular passing through Sella point B-Frank perp (mm) Distance from B to Frankfurt Perpendicular passing through Sella point Pog-Frank perp (mm) Distance from Pog to Frankfurt Perpendicular passing through Sella point Vertical H to palatal (mm) Distance between H point to palatal plane ANS-Me (mm) Distance between Anterior Nasal Spine and Menton N-Pog (mm) Distance between N point to Pogonion PFH (mm) Posterior Facial Height, Distance between Sella point and plane comprising: Gor, Gol, B point Transversal Gonial width (mm) Distance between Gonion right and Gonion left Palatal width (mm) Distance between Palatal right and Palatal left Hyoid width (mm) Distance between Greater Horn Right and left Zygomatic width (mm) Distance between Zs-R to Zs-L Others S-N-Ba (deg) Angle comprise Nasion Sella and Basion Airway measurements Linear Ad1-PNS transversal (mm) The most transversal extension of the Upper Airway measured at Ad1-PNS level Ad1-PNS sagittal (mm) The most sagittal extension of the Upper Airway measured at Ad1-PNS level T2-P3 transversal (mm) The most transversal extension of the Upper Airway measured at T2-P3 level T2-P3 sagittal (mm) The most sagittal extension of the Upper Airway measured at T2-P3 level E1-E2 transversal (mm) The most transversal extension of the Upper Airway measured at E1-E2 level E1-E2 sagittal (mm) The most sagittal extension of the Upper Airway measured at E1-E2 level Area Ad1-PNS surface (mm2) The cross-sectional surface measured at Ad1-PNS level T2-P3 surface (mm2) The cross-sectional surface measured at T2-P3 level E1-E2 surface (mm2) The cross-sectional surface measured at E1-E2 level TABLE 3. Descriptive statistics of the linear and angular measurements performed on the facial skeleton and of the measurements performed on upper airways for the entire sample Level Mean SD Minimum Maximum SkeletalAngular
(deg)
ANB 2.4 4.2 −8.8 11.5 SNA 81.3 4.0 71.5 93.0 SNB 78.6 4.6 67.9 97.8 S-N-Ba 128.8 4.9 117.8 141.2 S-N-Pog 79.8 4.6 69.4 97.4Sagittal
(mm)
S-Pog 120.6 7.8 100.7 140.2 PNS-Ba 42.3 4.2 31.3 55.6 Ba-Me 105.2 7.5 89.2 132.4 A-Frank perp 91.1 5.3 79.2 102.9 B-Frank perp 87.4 7.2 72.6 106.5 Pog-Frank perp 89.1 8.3 68.2 109.3Vertical
(mm)
H to palatal 59.8 7.9 42.3 85.3 ANS-Me 67.4 6.8 48.1 85.4 N-Pog 112.0 8.3 86.4 132.5 PFH 75.4 6.8 59.8 92.9Transversal
(mm)
Gonial width 87.5 6.4 71.7 101.1 Palatal width 30.0 2.8 24.1 36.7 Hyoid width 39.7 4.8 30.5 54.0 Zygomatic width 82.3 5.8 61.6 96.6 AirwayLinear
(mm)
ad1-PNS 21.3 4.6 6.8 30.3 T2-P3 17.2 4.0 6.3 28.3 E1-E2 10.8 2.5 5.0 17.6Transversal
(mm)
ad1-PNS 27.1 4.6 15.8 37.8 T2-P3 22.0 5.2 10.1 41.2 E1-E1 31.5 5.1 19.4 45.3Area
(mm2)
ad1-PNS 386.6 113.6 140.4 649.6 T2-P3 151.0 62.4 50.1 388.3 E1-E1 274.8 100.7 28.2 655.1Volume
(mm3)
TV 12647 3557 6914 22178 LNP 2378 1128 289 5764 VLP 4358 1555 1093 9626 ORP 2856 1295 786 8568 TABLE 4. Descriptive statistics of age, ANB angle and upper airways volumes according to each skeletal class Mean SD Minimum MaximumClass I
(male = 21; female = 9)
Age (yrs) 19.7 5.6 13.0 32.0 ANB (deg) 2.8 0.8 1.2 4.0 TV (mm3) 12670 3539 7290 22178 LNP (mm3) 2585 1079 290 4855 VLP (mm3) 4554 1528 1945 9091 ORP (mm3) 2724 1474 786 8568Class II
(male = 8; female = 22)
Age (yrs) 22.6 7.7 15.0 43.0 ANB (deg) 6.9 1.9 4.4 11.5 TV (mm3) 12272 2588 6914 17337 LNP (mm3) 2581 1143 683 5764 VLP (mm3) 3881 1319 1093 7094 ORP (mm3) 2703 706 1062 4279Class III
(male = 15; female = 15)
Age (yrs) 21 5 13 31 ANB (deg) -2.5 1.9 -8.8 -0.1 TV (mm3) 12843 4219 7090 22065 LNP (mm3) 2015 1048 289 5063 VLP (mm3) 4598 1664 1859 9626 ORP (mm3) 3119 1505 906 7768The patients included in this study represent the three different skeletal patterns: 30 subjects were Class I (0 < ANB < 4); 30 Class II (ANB > 4); and 30 Class III (ANB < 0). The characteristics of the entire sample are described in Table 3, while the characteristics of the sample divided according to the three classes are reported in Table 4. The inclusion criteria were the existence of a 12″ CBCT scan (NewTom 3G; QR srl.,) taken in occlusion and with patients in a supine position. The CBCT scanner used to scan the patients is provided with a bed, where the patient is lying, with his head fitted in a moulded pillow, making the patient positioning procedure highly reproducible. The exclusion criteria were patients with previous orthodontic treatment, orthognathic surgery, syndromes, pathology involving the upper airway, previous adeno-tonsillectomy procedure and subjectively perceived respiratory problems, as retrieved from the patients' records.
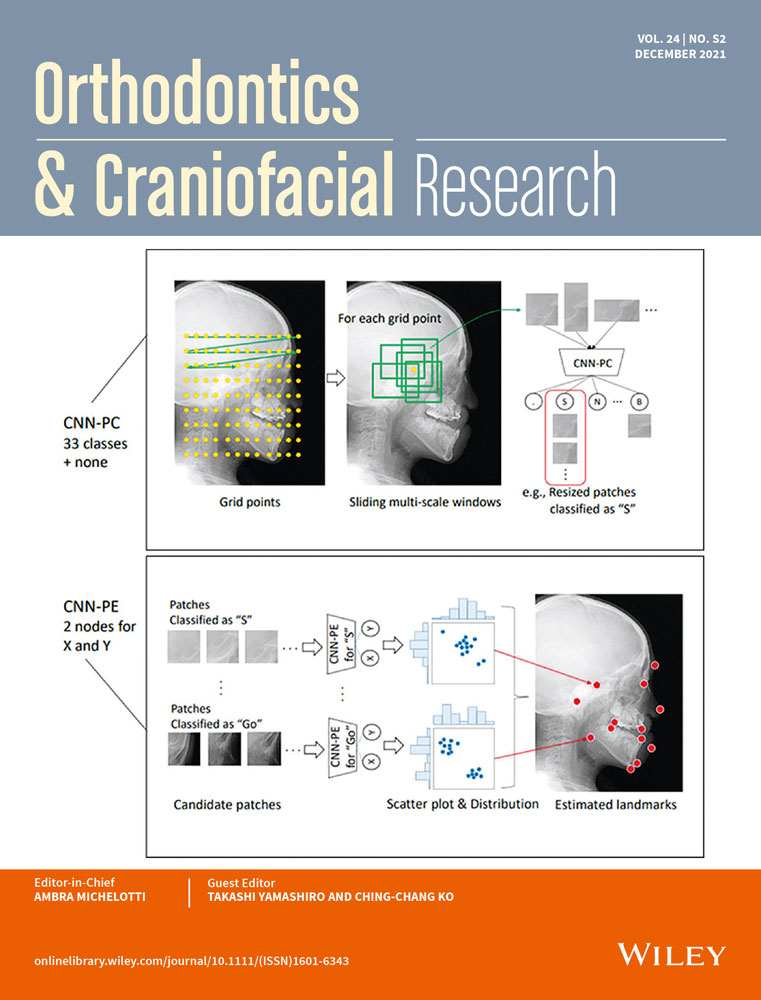
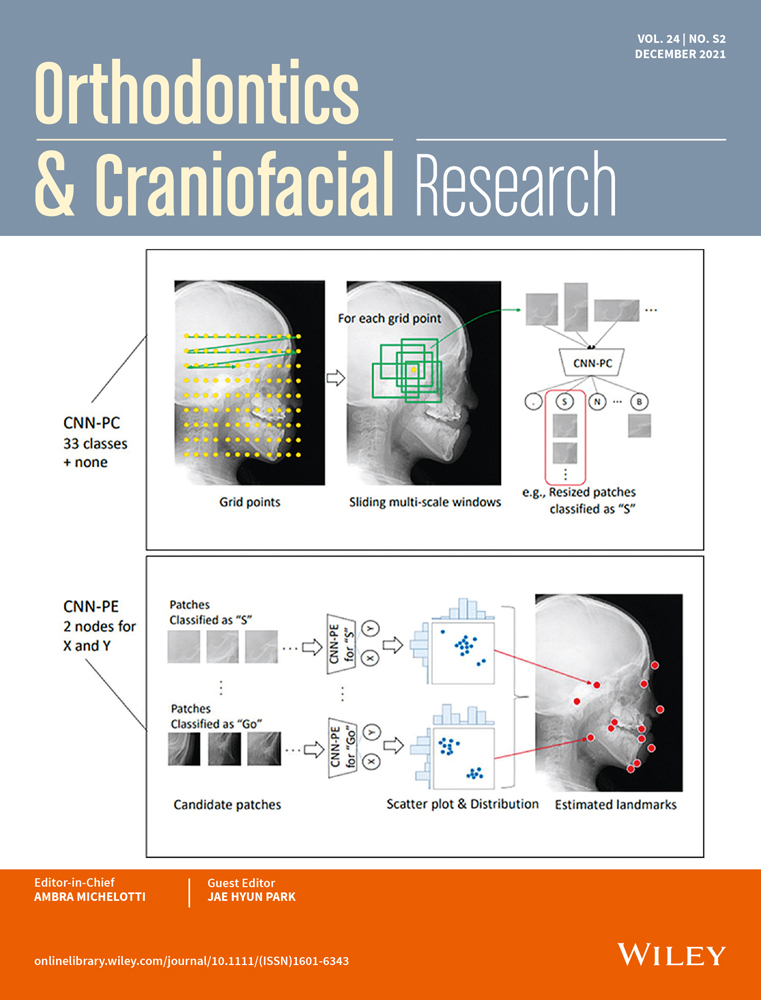
2.2 3D image processing and determination of landmarksAll CBCT scans were reconstructed with an isotropic voxel dimension of 0.36 mm. The original data sets were checked and, if needed, re-oriented using as references the upper orbits, Frankfurt plane, the ‘Dens’ of the second cervical vertebrae and the anterior nasal spine. The CBCT data were then exported via the DICOM format and imported into a specific software program (Mimics 15.0 Materialise). The data used in the present article were generated and reported as described previously by Di Carlo and coauthors (Tables 1-4; Figure 1).23 In particular, the following data were considered in the present study: nineteen cephalometric linear measurements, four upper airway volumes (three partial volumes and the total volume) and nine upper airway data. (Tables 1 and 2 and Figure 1).

Total airway and three partial volumes delimited by eight anteroposterior landmarks. In light blue, the lower nasopharynx (LNP); in red, the velopharynx (VLP); and in yellow, the oropharynx (ORP). The black line identifies the section Ad1-PNS, the green line identifies the section T2-P3, and the orange line identifies the E2-E1 section of the upper airway
2.3 Data pre-processingAccording to their diagnostic classes, the targeted orthodontic profiling was performed for three distinct groups, each consisting of 30 subjects. In order to use a homogeneous approach, a unique data set was created, including all of them. Thereby, for each orthodontic metric, patients of the three skeletal classes (I, II and III) were concatenated into a single array, that is [Ii, IIi, IIIi] (with i = 1, …, 30).
Consequently, the data were transformed into Z scores across subjects: for each orthodontic measure ‘s’ and each subject ‘k’, the Z score Zs(k) was calculated as Equation (1) (1)N denoted the total number of subjects. A regression procedure was implemented to reduce the variance across patients of each orthodontic measure.
留言 (0)