
記住我
In recent years, with the application of novel immunosuppressants, the living-donor allograft survival rate has improved a lot. It was reported that the five-year graft survival in 2018 was close to 90%, and in the next 1–2 years, the total number of kidney transplant recipients (KTRs) with normal renal function was expected to exceed 250,000.1 However, the long-term allograft survival remains a critical issue in transplantation field. Antibody-mediated rejection (ABMR) is one of the major factors that affects long-term graft survival after kidney transplantation (KT).2 The shortage of reliable and accurate biomarkers for the early identification of ABMR is also a major issue to achieve long-term survival.
T follicular helper (Tfh) cells play a crucial role in humoral alloimmunity. Tfh cells are characterized by the expression of C-X-C chemokine receptor 5 (CXCR5), inducible costimulatory molecule (ICOS), and programmed cell death protein 1 (PD-1).3, 4 They can stimulate germinal centers immature B-cell differentiation to memory B cells and plasma cells through chemokines such as interleukin (IL)-21.5, 6 Increasing circulating Tfh cells and active B cells are found in KTRs experiencing ABMR. These circulating Tfh cells were stimulated by donor antigens and produced a large amount of IL-21, which further induced the B-cell differentiation into donor-specific antibody (DSA) secreting cells.7, 8 In our preceding study, we found that the elevated ratio of circulating CD4+ Tfh cells to CD4+ T follicular regulatory (Tfr) cells was associated with CAD.9
One recent study conducted by Chen, Y et al. showed that IL-21-producing PD-1+CXCR5+CD8+ T cells were similar to CD4+ Tfh cells in promoting the production of antibodies.10 The roles of CXCR5-expressing CD8+ T cells differ from classic cytotoxic CD8 T cells in viral infections, tumors, and autoimmune diseases.11-13 Based on transcriptional and phenotypic analyses and various functional responses, CXCR5+CD8+ T cells are classified as effector memory CD8 T cells, cytotoxic CD8 T cells, regulatory CD8 T cells, exhausted CD8 T cells, and follicular helper CD8 T cells.14, 15 The specific immune condition and functional difference determined the classification of CXCR5+CD8+ T-cell population. For example, some researchers found that in chronic lymphocytic choriomeningitis virus (LCMV) and other infections, the frequency of CXCR5+CD8+ T cells was negatively correlated with the viral load and showed stronger cytotoxicity than the CXCR5− subpopulation.16, 17 Studies on inflammation and autoimmune disease suggested a helper function of CXCR5+ CD8+ T cells.14
PD-1 affects the function of Tfh cells by inhibiting T-cell recruitment into the follicle.18 In addition to CD4+ T cells, PD-1 on CD8+ T cells also exerts inhibitory function. It was well-established that PD-1 expressed rapidly in vivo after encountering with antigens and is a typical marker of T-cell exhaustion.19 For example, with the sustained stimulation of microbe antigens in infection diseases, effector T cells would become exhausted, which were accompanied by the increased expression of inhibitory molecules, such as PD-1, CTLA4, and LAG3.20 In recent years, several researches have shown that PD-1+CXCR5+CD8+ T cells, unlike classic exhausted T cells, could promote the proliferation of new effector CD8 T cells and better control chronic viral infections and tumors.11, 21, 22 STAT4 is involved in immune response and plays an important role in the regulation of Treg differentiation.24 In vitro data revealed that the differentiation of human Tfh cells is supported by signal transducers and activators of transcription 4 (STAT4) signaling.23 Taghavie-Moghadam's research group showed that STAT4 inhibited the function of CD8+ Tregs, and thus, STAT4-deficient CD8+ Tregs would inhibit the generation of Tfh cells and B cell in GCs,25 while STAT5 negatively regulates the development of Tfh cells by increasing the expression of B-lymphocyte induced mature protein 1 (Blimp-1) and further regulates humoral immunity and B-cell tolerance.26, 27 Chen, Y group also found that signal transducers and activators of transcription 5 (STAT5) suppressed the frequency of PD-1+CXCR5+CD8+ T cells and the secretion of IL-21,10 suggesting that STAT5 may has an impact on DSA generation. In our previous study, STAT4 and STAT5 on Tfh cells were found to play important roles in KT.9 However, the expression patterns of STAT4 and STAT5 on CXCR5+CD8+ T cells in KTRs are unknown.
In this study, we investigated the association of CXCR5+CD8+ T cells and the co-expression of STAT4, STAT5, and PD-1 with renal allograft dysfunction. In addition, whether these cells could serve as useful markers for different allograft pathological types was further analyzed.
2 MATERIALS AND METHODS 2.1 PatientsA total of 82 patients who underwent KT in West China Hospital of Sichuan University between April and November 2016 were cross-sectionally included in this study. Patients’ basic information, including age, sex, body mass index (BMI), transplant time, medication, biochemical test results, and pathological biopsy results, was collected. CAD was defined as estimated glomerular filtration rates (eGFR) <60 ml/min/1.73 m2 for more than 3 months post-transplantation.28 There were 45 patients in the CAD group (eGFR <60 ml/min/1.73 m2), while 37 patients were included in the stable recipients group (eGFR > 60 ml/min/1.73 m2). Based on Banff-2015,29 16 recipients were diagnosed as having biopsy-proven rejection (BPR) with 12 cases of antibody-mediated rejection (ABMR) and 4 cases of T cell–mediated rejection (TCMR). The study was approved by the Ethics Committee of West China Hospital. All participants provided written informed consent.
2.2 Cell-surface and intracellular stainingThe following fluorochrome-conjugated monoclonal antibodies (mAbs) were used in the study: anti-CD3-PerCP, anti-CD8-APC-Cy7, anti-PD-1-PE, anti-STAT4-PE, anti-STAT5-PE (all from BD Pharmingen), and anti-CXCR5-APC (BioLegend). In addition, corresponding isotype controls were used. 50 µl of unstimulated peripheral whole blood (for PD-1+CXCR5+CD8+ T-cell detection) was incubated at 4°C in the dark for 30 min. 20 µg/ml recombinant human IL-12 (BD Bioscience) was added to stimulate STAT4 expression, and 20 µg/ml recombinant human IL-2 (BD Bioscience) was applied to stimulate STAT5 expression; 50 µl surface-stained peripheral blood was stimulated at 37°C in the dark for 15 min. Then, Lyse/Fix Buffer (BD Pharmingen) was used to lyse and fix the cells at 37°C for 10 min, and Perm Buffer III (BD Pharmingen) was used to permeabilize the cells on ice for 30 min. Finally, after washing twice with BD Pharmingen Stain BSA Buffer (BD Pharmingen), cells were stained with STAT4-PE and STAT5-PE and CD3-PerCP (BD Bioscience, New Jersey, US) for 30 min at 4 ℃ in the dark. All flow cytometry tests were performed on a FACSCanto II instrument (BD Bioscience), and the results were analyzed with Kaluza V2.1 software. Gating strategies are shown in Figure 1.

Gating strategy for analysis by using logic gates. Measurements were performed with fresh blood samples. Lymphocytes (A) were gated based on forward and side scatter. CXCR5+CD8+ cells were identified by flow scatter plots, and E and F for further analysis. The expression of STAT5, STAT4, and PD-1 on CXCR5+CD8+ cells was gated based on the strategy shown in D, E, and F
2.3 Laboratory analysesSerum creatinine (Scr) levels were determined by the picric acid method (Roche Diagnostics, Mannheim, Germany). The Modification of Diet in Renal Disease formula adjusted for the Chinese population was used to calculate the eGFR.30 eGFR (ml/min/1.73 m2) = 186 × Scr (mg/dl)−1.154age−0.203 × (0.742 if female) × 1.233.
2.4 Statistical analysisAll statistical analyses were performed utilizing SPSS (V25.0, SPSS Inc., Chicago, IL, USA) and GraphPad Prism version 8.0.2 (GraphPad, Inc., La Jolla, CA). The Mann-Whitney U test was used to identify phenotypic differences between different groups. The chi-square test was utilized to evaluate basic clinical information. A logistic regression model (Forward: LR) was used to evaluate the relationship between each indicator and renal dysfunction. Pearson's correlation analysis was used to evaluate the correlation between the PD-1+CXCR5+CD8+ T cell and eGFR level. A receiver operating characteristic curve was used to evaluate diagnostic performance. Two-sided P-values ≤0.05 were considered statistically significant.
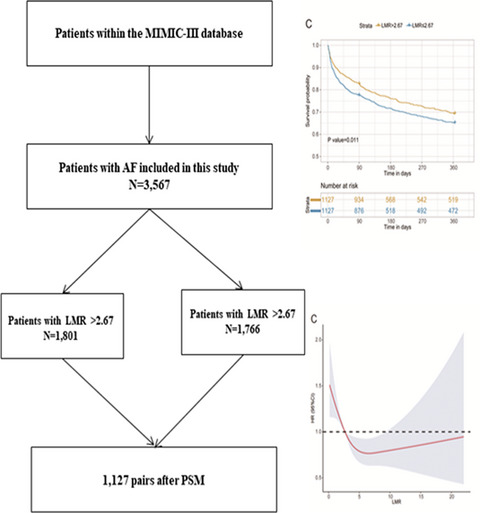
3 RESULTS 3.1 Demographic and clinical characteristics of the study subjectsThe baseline characteristics of the patients are summarized in Table 1a. Among the 82 KTRs, 45 developed CAD, and 37 had stable renal function. There were no significant differences in age, sex, BMI, HLA mismatch, or transplant duration between the CAD group and the stable recipients group. 59 patients were treated with tacrolimus-based triple therapy (TAC + MMF + Pred), while 21 recipients were given SRL-based triple therapy (SRL + MMF + Pred). And 2 patients were treated with CsA-based therapy (CsA + MMF + Pred). There were no significant differences between different drug groups (p = 0.064). The level of eGFR was lower in CAD group than that in stable recipients group (median value: 31.98 vs 75.00 ml/min/1.73 m2, p < 0.001). The demographic and clinical characteristics of the pathological groups were shown in Table 1b, and there were no significant differences between the two groups regarding age, sex, BMI, HLA mismatch, or transplant duration.
TABLE 1a. (a) Demographic and clinical characteristics of the renal function groups CAD(n = 45) stable recipients group (n = 37) P-value Age 40.60 ± 8.76 39.97 ± 7.89 0.737Male
Female
36(80%)
9(20%)
28(75.7%)
9(24.3%)
0.638FK506
SRL
CsA
28(62.2%)
16(35.6%)
1 (2.2%)
31(83.8%)
5(13.5%)
1 (2.7%)
0,064
HLA mismatch 4 (4, 6.5) (n = 17) 4 (3, 4) (n = 23) 0.456 Time after transplantation (months) 65(18,101) 36(15,64) 0.062 BMI 21.89 ± 3.72(n = 26) 22.32 ± 3.36 (n = 23) 0.683 eGFR 31.98 (23.10, 43.01) 75.00 (64.59, 94.49) <0.001 Abbreviations: CAD: chronic renal allograft dysfunction, BMI: body mass index, FK: tacrolimus, SRL: sirolimus. TABLE 1b. Demographic and clinical characteristics of pathological groups ABMR(n = 12) TCMR (n = 4) P-value Age 40.00 ± 9.86 41.50 ± 11.21 0.802Male
Female
9(75%)
3(25%)
3(75%)
1 (25%)
1.000 HLA mismatch 4 (4,6) (n = 5) 7 (7, 7) (n = 1) 0.333 Time after transplantation (months) 32(12,101) 21.5 (13,38.25) 0.361 BMI 23.47 ± 4.26(n = 8) 22.78 ± 2.41 (n = 3) 0.799 eGFR 37.80 (25.19, 59.37) 28.39 (16.89, 46.67) 0.396 Abbreviations: ABMR: antibody-mediated rejection, TCMR: T cell–mediated rejection, BMI: body mass index. 3.2 Percentages of CXCR5+CD8+ T cells and co-expression of PD-1, STAT4, and STAT5 in the CAD group and the stable recipients groupTo investigate the correlation between CXCR5+CD8+ T cells and CAD, we first measured the percentages of CXCR5+ T cells among CD8+CD3+ T cells in the CAD group and the stable recipients group. The expression of CXCR5 on CD8+CD3+ T cells was significantly lower in the CAD group than in the stable recipients group (1.92% vs 2.42%, p = 0.040, Figure 2A). There was no significant difference of the percentage of PD-1+CXCR5+ T cells in CD8+CD3+ T cells between the CAD group and the stable recipients group (1.07% vs 0.86%, p = 0.399, Figure 2B), but the expression of PD-1 on CXCR5+CD8+ T cells in the CAD group was significantly higher than that in the stable recipients group (49.3% vs 42.5%, p = 0.023, Figure 2C). No significant difference of the percentage of STAT4+CXCR5+ cells in CD8+CD3+ T cells was found between two groups (0.03% vs 0.09%, p = 0.051, Figure 2D). The expression of STAT4 in CXCR5+CD8+ T cells in the stable recipients group was significantly higher than that in the CAD group (2.44% vs 1.06%, p = 0.019, Figure 2E). The percentage of STAT5+CXCR5+ cells in the CD8+CD3+ T-cell population was higher in the stable recipients group than in the CAD group (1.58% vs 1.11%, p = 0.039, Figure 2F). However, there was no significant difference of the expression of STAT5 on the CXCR5+CD8+ T cells between the CAD group and the stable recipients group (48.60% vs 59.78%, p = 0.062, Figure 2G). The gating strategy was shown in Figure 1.

Frequencies of CXCR5+CD8+ T cells and co-expression of PD-1, STAT4, and STAT5 in the CAD group and the stable recipients group. Circles refer to the chronic renal allograft dysfunction (CAD) group, and squares refer to the stable recipients group. (A) CXCR5 on CD8+CD3+ cells, (B) PD-1+CXCR5+ on CD3+CD8+ cells, (C) PD-1 on CXCR5+CD8+ cells, (D) STAT4+CXCR5+ on CD3+CD8+ cells, (E) STAT4 on CXCR5+CD8+ cells, (F) STAT5+CXCR5+ on CD3+CD8+ cells, and (G) STAT5 on CXCR5+CD8+ cells
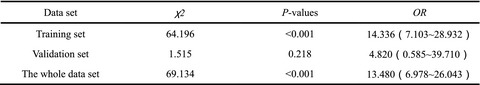
3.3 Elevated expression of PD-1 on CXCR5+CD8+ T cells was an independent risk factor for CADTo assess whether PD-1, STAT4, and STAT5 on CXCR5+CD8+ T cells are independent influencing factors for CAD, we incorporated drugs, transplant time, the expression of CXCR5 on CD8+CD3+ T cells, the expression of PD-1 on CXCR5+CD8+ T cells, the expression of STAT4+ in CXCR5+CD8+ T cells, and the expression of both STAT5 and CXCR5 in CD8+CD3+ T cells into logistic regression models. The expression of PD-1 on CXCR5+CD8+ T cells was demonstrated to be an independent risk factor for CAD (OR = 1.027, 95% CI 1.004–1.051, p = 0.020, shown in Table 2). Through the correlation analysis, we found with the increase of the percentage of PD-1+CXCR5+CD8+ T cells, the eGFR level tended to decrease. However, there was no significant difference of the correlation between the PD-1+CXCR5+CD8+ T cells and the eGFR level (relative rate: −0.204, p-value: 0.066, Supplementary data 1).
TABLE 2. Logistic regression analysis for CAD Regression coefficient(B) P OR 95.0% CI Upper Lower PD−1+/CXCR5+CD8+ (%) 0.027 0.020 1.027 1.004 1.051 3.4 The expression of PD-1 on CXCR5+CD8+ T cells in ABMR was higher than that in TCMRTo explore the relationships between PD-1, STAT4, and STAT5 on CXCR5+CD8+ T cells and the pathological types of renal graft rejection, we measured the percentages and expression levels of these parameters. The expression of PD-1 on CXCR5+CD8+ T cells in the ABMR group was higher than that in the TCMR group, and the difference was statistically significant (59.57% vs 28.58%, p = 0.026, Figure 3B). Other parameters had no significant differences between ABMR group and TCMR group, shown in the Figure 3.

Frequencies of PD-1+ CXCR5+ cells in the CD8+ and CD3+CD8+ cell populations in the ABMR group and TCMR group. Circles represent the ABMR group, and squares represent the TCMR group. (A) CXCR5 on CD8+CD3+ cells, (B) PD-1+CXCR5+ cells in the CD8+ CD3+ population, (C) PD-1 on the CXCR5+ CD8+ population, (D) STAT4+CXCR5+ cells in the CD3+CD8+ cells population, (E) STAT4 on CXCR5+CD8+ cells, (F) STAT5+CXCR5+ cells in the CD3+CD8+ cells population, and (G) STAT5 on CXCR5+CD8+ cells
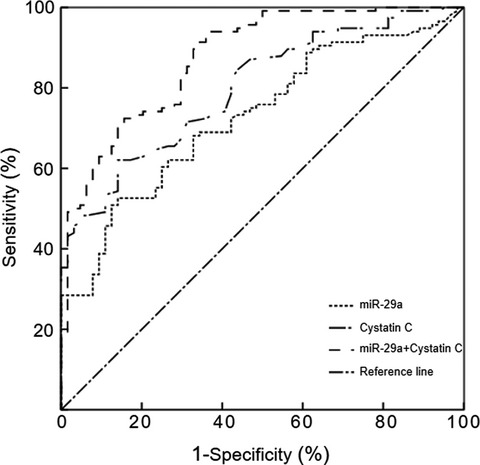
3.5 Diagnostic efficacy of PD-1+CXCR5+CD8+ T cells for CAD and ABMRA ROC curve was developed to evaluate the efficacy of PD-1+CXCR5+CD8+ T cells in diagnosing CAD, and the area under the curve (AUC) was 0.647 (p = 0.023, Figure 4A). The AUC of the ROC curve for diagnosing ABMR with PD-1+CXCR5+CD8+ T cells was 0.854 (p = 0.039, Figure 4B). The AUC of the ROC curve for diagnosing ABMR with eGFR was 0.646, and the P-value was the 0.396.

ROC curves for diagnosing CAD (A) and ABMR (B). AUC: area under the curve
4 DISCUSSIONIn the current study, we investigated the association of CXCR5+CD8+ T-cell subpopulations and CAD in KTRs. We found that lower levels of CXCR5+CD8+ T cells were associated with CAD. The expressions of STAT5 and STAT4 in CXCR5+CD8+ T cells were significantly downregulated, while the expression of PD-1 on CXCR5+CD8+ T cells was upregulated in the CAD group, when compared with the stable recipients group. After grouping by pathological type, the expression of PD-1 on CXCR5+CD8+ T cells was higher in the ABMR group than that in the TCMR group. In addition, PD-1+CXCR5+CD8+ T cells showed relatively great diagnostic efficacy for ABMR compared with eGFR.
It was previously reported that one subtype of the CD8 T-cell subpopulation, named CD8 T antibody-suppressor (CD8 TAb-supp) cells, can mediate the inhibition of alloantibody production after allograft transplantation.31 Further studies have shown that CD8 TAb-supp cells express CXCR5, allowing them homing to GCs in lymphoid tissues.31 Adoptive transferred alloantigen-specific CXCR5+ CD8 T cells inhibit the production of alloantibodies by reducing the numbers of CD4+ Tfh cells and GC B cells and significantly improve graft survival after mouse liver transplantation.31 To determine the function of CXCR5+CD8+ T cells in vivo, Fuliang Chu established animal models, and subsequent work suggested that CXCR5+CD8+ T cells might inhibit Tfh cells.32 A prospective study also concluded that the development of de novo donor-specific antibodies (dnDSAs) was negatively correlated with the number of IFNγ+CXCR5+CD8+ T cells in the peripheral blood, which was consistent with the antibody inhibition function of IFNγ+CXCR5+CD8+ T cells.33 In the current study, we observed that the percentage of CXCR5+CD8+ T cells in the stable recipients group was higher than that in the CAD group. Based on the above results about the function of CXCR5+CD8+ T cells, we speculated that CXCR5+CD8+ T cells might be a subtype of CD8 TAb supp population31 or act like Treg cells with the function of reducing the number of Tfh cells and inhibiting the production of alloantibodies,14 and performed as helpful cells for the maintenance of renal function in KTRs.
In mice with chronic LCMV infection, PD-1+CXCR5+CD8+ T cells have been identified as precursors of exhausted CD8+ T cells that maintain viral-specific CD8+ T cells during chronic infection.34 In HIV infection, PD-1+CXCR5+CD8+ T cells are functional cytotoxic T cells.35 Hofland, T et al. showed that PD-1+CXCR5+CD8+ T cells were memory-like T cells which expressed the transcription factor Tcf1 and they might require chronic antigen stimulation to develop.36 However, recently, Chen, Y et al. showed that B cells might produce autoantibodies in vivo with the help of PD-1+CXCR5+CD8+ T cells.10 scRNA-seq data further confirmed that the gene expression pattern of PD-1+CXCR5+CD8+ T cells was similar to that of Tfh cells and is negatively regulated by STAT5.10 Our results showed that the CAD group showed higher levels of PD-1+CXCR5+CD8+ T cells and lower STAT5 expression than the stable recipients group. And ABMR group had higher levels of PD-1+CXCR5+CD8+ T cells. It can thus be speculated that PD-1+CXCR5+CD8+ T cells are relatively similar to Tfh cells, which promote the production of antibodies in KTRs. STAT5 is a cogent negative regulator of Tfh cell differentiation26; in the same way, the decreased expression of STAT5 may cause the increased number of the PD-1+CXCR5+CD8+ T cells in the CAD group.
It has conclusively been shown that Tfh cells and B cells were increased in ABMR patients. These circulating Tfh cells are stimulated by donor antigens, producing a large amount of IL-21 and induce B-cell differentiation.8 Chenouard's group found that the proportion of the PD-1+CXCR5+CD4+ subset was relatively low in a renal function stabilization group and concluded that cTfh cell defects were associated with a reduced incidence of dnDSAs after transplantation.37 A previous study also found that patients with relatively high PD-1+ cTfh cell levels were more likely to have pretransplantation anti-HLA antibodies, de novo anti-HLA antibodies, and acute rejection.38 In the tumor-involved lymph nodes (TILNs) of thyroid cancer patients, CXCR5+CD8+ T cells with high PD-1 expression showed a stronger response to TCR stimulation than CXCR5−CD8+ T cells with moderate PD-1 expression.39 Therefore, it can be inferred that PD-1+CXCR5+CD8+ T cells favor the production of antibodies and facilitate the occurrence of ABMR, which may explain the elevated level of PD-1+CXCR5+CD8+ cells in KTRs with ABMR.
ABMR is one of the most ordinary causes of graft loss,40 and no effective therapies have been developed so far.41 It is not difficult to diagnose chronic renal allograft dysfunction by using traditional biomarkers, such as the eGFR, and new biomarkers, such as sTim-3 and sGal-9.42 However, these markers cannot identify which type of allograft dysfunction, and only biopsy can distinguish the type of dysfunction.43 By ROC curve analysis, our study indicated that PD-1+CXCR5+CD8+ T cells might be a potential biomarker to identify pathological type by noninvasive methods and PD-1 might also be a therapeutic target for ABMR.
There were also some limitations in this study. We measured only cell populations and did not perform functional experiments, so we can only speculate on the roles of these immune parameters in renal graft dysfunction and rejection. Also, we did not compared PD-1+CXCR5+CD8+ T cell with some biomarkers like sTim-3 and sGal-9 in the same cohort. In our study, we concluded that PD-1+CXCR5+CD8+ Tfh cell was a unique subtype which was similar to CD4+ Tfh cells, regulating the B cell–mediated alloimmune response and the production of alloantibodies. STAT5 may down-regulate the development of PD-1+CXCR5+CD8+ Tfh cells. The exact role of this group of cells in KT requires further study, but now we can regard PD-1+CXCR5+CD8+ T cell as a biomarker to help diagnosing the occurrence of CAD and ABMR. With further research, this may provide new ways of identifying and treating graft rejection.
5 CONCLUSIONOur results indicated that PD-1+CXCR5+CD8+ T cells were a promising biomarker for allograft dysfunction. Furthermore, PD-1+CXCR5+CD8+ T cells showed diagnostic capability in distinguishing different pathological types of allograft dysfunction. Whether this can be applied clinically needs further research.
ACKNOWLEDGMENTThe authors thank Weihua Feng at Department of Laboratory Medicine, West China Hospital, Sichuan University, for their help in the analysis of FCM.
CONFLICT OF INTERESTThe authors declare that there are no conflicts of interest.
AUTHOR CONTRIBUTIONSJi-wen Fan, Lin Yan, and Yi Li conceptualized the study. Ji-wen Fan involved in data curation.: Ji-wen Fan and Lin Yan involved in formal analysis and Writing—original draft. Ya-mei Li, Yang-juan Bai, Xue-qiao Wang, Xiao-qi Ou, and Zheng-li Wan investigated the study. Ya-mei Li, Yang-juan Bai, Xiao-qi Ou, and Zheng-li Wan designed the methodology. Yi Li involved in project administration and supervision. Ji-wen Fan, Lin Yan, Ya-mei Li, Yang-juan Bai, Xiao-qi Ou, Zheng-li Wan, and Yi Li involved in writing—review and editing.
The data that support the findings of this study are available from the corresponding author upon reasonable request.
Filename Description jcla24200-sup-0001-DataS1.docxWord 2007 document , 13.4 KB Data S1Please note: The publisher is not responsible for the content or functionality of any supporting information supplied by the authors. Any queries (other than missing content) should be directed to the corresponding author for the article.
REFERENCES
1Hart A, Smith JM, Skeans MA, et al. OPTN/SRTR 2018 Annual Data Report: Kidney. Am J Transplant. 2020; 20 Suppl s1: 20- 130. 2Nemes BRPS, Bidiga L, et al. [Antibody-mediated rejection: challenge of the treatment in kidney transplantated patients] Orv Hetil. 2018; 159: 1913- 1929. 3Walters GD, Vinuesa CG. T Follicular Helper Cells in Transplantation. Transplantation. 2016; 100(8): 1650- 1655. 4Crotty S. Follicular helper CD4 T cells (TFH). Annu Rev Immunol. 2011; 29: 621- 663. 5Yan L, de Leur K, Hendriks RW, et al. T Follicular Helper Cells As a New Target for Immunosuppressive Therapies. Front Immunol. 2017; 8: 1510. 6de Graav GN, Dieterich M, Hesselink DA, et al. Follicular T helper cells and humoral reactivity in kidney transplant patients. Clin Exp Immunol. 2015; 180(2): 329- 340. 7Wallin EF. T Follicular Regulatory Cells and Antibody Responses in Transplantation. Transplantation. 2018; 102(10): 1614- 1623. 8Louis K, Macedo C, Bailly E, et al. Coordinated Circulating T Follicular Helper and Activated B Cell Responses Underlie the Onset of Antibody-Mediated Rejection in Kidney Transplantation. J Am Soc Nephrol. 2020; 31(10): 2457- 2474. 9Yan L, Li Y, Li Y, et al. Increased circulating Tfh to Tfr ratio in chronic renal allograft dysfunction: a pilot study. BMC Immunol. 2019; 20(1): 26. 10Chen Y, Yu M, Zheng Y, et al. CXCR5(+)PD-1(+) follicular helper CD8 T cells control B cell tolerance. Nat Commun. 2019; 10(1): 4415. 11He R, Hou S, Liu C, et al. Follicular CXCR5- expressing CD8(+) T cells curtail chronic viral infection. Nature. 2016; 537(7620): 412- 416. 12Chu F, Li HS, Liu X, et al. CXCR5(+)CD8(+) T cells are a distinct functional subset with an antitumor activity. Leukemia. 2019; 33(11): 2640- 2653. 13Valentine KM, Davini D, Lawrence TJ, et al. CD8 Follicular T Cells Promote B Cell Antibody Class Switch in Autoimmune Disease. J Immunol. 2018; 201(1): 31- 40. 14Valentine KM, Hoyer KK. CXCR5+ CD8 T Cells: Protective or Pathogenic? Front Immunol. 2019; 10: 1322. 15Fousteri G, Kuka M. The elusive identity of CXCR5(+) CD8 T cells in viral infection and autoimmunity: Cytotoxic, regulatory, or helper cells? Mol Immunol. 2020; 119: 101- 105. 16He R, Hou S, Liu C, et al. Erratum: Follicular CXCR5-expressing CD8+ T cells curtail chronic viral infection. Nature. 2016; 540(7633): 470. 17Li S, Folkvord JM, Rakasz EG, et al. Simian Immunodeficiency Virus-Producing Cells in Follicles Are Partially Suppressed by CD8+ Cells In Vivo. J Virol. 2016; 90: 11168- 11180. 18Shi J, Hou S, Fang Q, et al. PD-1 Controls Follicular T Helper Cell Positioning and Function. Immunity. 2018; 49(2): 264- 274.e4. 19Ahn E, Araki K, Hashimoto M, et al. Role of PD-1 during effector CD8 T cell differentiation. Proc Natl Acad Sci U S A. 2018; 115(
留言 (0)