
記住我


Diabetes mellitus (DM) is a systemic metabolic disease characterized by hyperglycemia. This systemic glucose metabolism disorder has a serious negative effect on the skeletal system by causing severe complications of the bone and joint system, ie, diabetic osteoporosis (DOP).1, 2 In addition to the hyperglycemic microenvironment, DOP patients are also characterized by bone microstructure damage, bone strength reduction, fracture susceptibility, and bone defects that are not easily healed.3 For bone defects in DOP patients, the current treatment methods are not ideal.4, 5 With the rapid development of tissue engineering, bone tissue engineering, which includes scaffold materials, seed cells, and growth factors, is considered to be the most promising method for bone defect repair.6 Adipose-derived stem cells (ASCs) are some of the most widely used seed cells in bone tissue engineering. However, our previous studies have shown that, compared with control adipose-derived stem cells (CON-ASCs), diabetic osteoporosis adipose-derived stem cells (DOP-ASCs) have less osteogenic potential,7, 8 which limits their application to the treatment of fractures and bone defects in DOP patients. Therefore, the molecular mechanism of the osteogenic decline of DOP-ASCs requires further exploration to find potential therapeutic targets for the treatment of bone defects in DOP patients.
Wnt signaling pathways are a group of multifunctional signal transduction pathways activated by the binding of the Wnt ligand to the cell membrane receptor. They participate in various physiological and pathological processes of cells, which include various bone tissue diseases such as osteoporosis and stem cell–related bone regeneration.9 Activation of the Wnt signaling pathway in stem cells improves their ability of bone differentiation, whereas the inhibition of the Wnt signaling pathway reduces bone formation.10, 11 Our previous studies have shown that the decrease in the osteogenic potential of DOP-ASCs compared with CON-ASCs is related to the Wnt signaling pathway.8 However, the molecular mechanism that underlies the regulation of the Wnt pathway for the osteogenic potential of DOP-ASCs is unclear.
Mammalian DNA methylation refers to methylation of the fifth carbon atom on cytosine in the CpG dinucleotide of DNA, which is catalyzed by four DNA methyltransferases, namely DNMT1, DNMT2, DNMT3a, and DNMT3b. It is generally believed that hypermethylation of DNA is related to the inhibition of gene expression, whereas DNA demethylation has the opposite effect.12, 13 Because the promoter regions of many genes contain high-density CpG dinucleotide aggregation regions, namely CpG islands, DNA methylation plays an important role in mammalian cell biology.14, 15 Recent studies have shown that DNA methylation may affect the multidirectional differentiation of stem cells by regulating the expression of specific genes, which results in various bone diseases that include osteoporosis and osteoarthritis.16, 17 Therefore, exploring DNA methylation provides a possibility to investigate novel molecular mechanisms of the osteogenic decline in DOP-ASCs.
Protein coding genes have been studied extensively, but they account for only 1.5% of the human genome.18 Noncoding RNAs (ncRNAs), which account for up to 98% of the genome, were once ignored. These ncRNAs are divided into long noncoding RNAs (LncRNAs) and short-chain ncRNAs in accordance with the transcript length. LncRNAs are a class of ncRNAs with transcript lengths longer than 200 bases, which are localized in the nucleus or cytoplasm.19, 20 With the gradual deepening of the research on LncRNAs, many studies have reported that LncRNAs regulate gene expression at the epigenetic, transcriptional, and post-transcriptional levels, and have a potential regulatory effect on the cell fate of mesenchymal stem cells and the occurrence and development of specific diseases.19, 21, 22 In particular, studies have confirmed that LncRNAs affect the expression of specific genes by regulating the DNA methylation level in their promoter region.23-25 However, the molecular mechanism of LncRNAs in regulating the osteogenic differentiation and bone regeneration of DOP-ASCs is unclear. Therefore, an epigenetic mechanism, such as the regulation of LncRNAs or DNA methylation in the osteogenic ability of DOP-ASCs, has become a possible explanation for the decline in the osteogenic potential of DOP-ASCs.
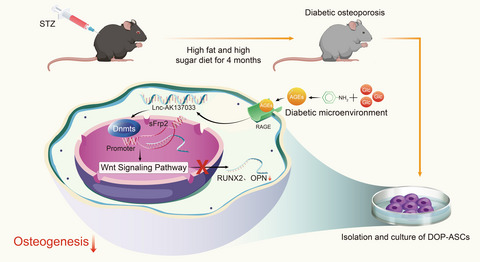
In the present study, we subjected CON-ASCs and DOP-ASCs to mRNA/LncRNA expression profiling and MeDIP sequencing. The results showed a significant difference in the DNA methylation level of the promoter region of the Wnt signaling molecule sFrp2, which was related to LncRNA-AK137033. Subsequently, we conducted functional studies of sFrp2 and LncRNA-AK137033 in vivo and in vitro to explore the molecular mechanism that regulates bone differentiation of DOP-ASCs from the perspective of epigenetics.
2 MATERIALS AND METHODS 2.1 Diabetic osteoporosis animal modelAll procedures related to animal experiments were reviewed and approved by the Ethics Committee of Southwest Medical University (20180391222) and carried out in accordance with the guidelines of the Care and Use of Laboratory Animals (Ministry of Science and Technology of China, 2006). Four-week-old male C57BL/6 mice were purchased from the Experimental Animal Center of Southwest Medical University. Fifty mice were randomly divided into CON and DOP groups. The CON group was fed an ordinary diet, and the DOP group was fed a high fat and sugar (HFS) diet. The HFS diet consisted of 65% standard chow, 10% fat, 20% sucrose, 2.5% cholesterol, and other necessary additives (BIOG, Beijing, China). The weight and blood glucose of mice were measured every week. After 4 weeks, 50 mice were fasted for 12 h, followed by injection of streptozotocin (STZ; Sigma, St Louis, USA) in the DOP group (140 mg/kg) or the same volume of citric acid-sodium citrate buffer (140 ml/kg) in the CON group. After the injection, CON mice were raised on standard chow and DOP mice were still raised on the HFS diet. Additionally, all mice were fed under appropriate conditions (20–25°C with 65%–80% humidity) with free access to drinking water and food. The blood glucose and body weight of each group of mice were recorded every 3–5 days. After 4 months of feeding, the diabetic osteoporosis model was established. Until the end of the study, the mortality rate of STZ-induced diabetic osteoporosis mice was 20%–33%.
2.2 Hematoxylin and eosin (H&E), and Masson's stainingSamples were fixed in 10% paraformaldehyde for 24 h, decalcified in a decalcification solution for about 1 month (this step was omitted for soft tissue), washed with tap water for 48 h, dehydrated with an alcohol gradient, embedded in paraffin, and sectioned. The samples were then stained with H&E and Masson's dye.
2.3 Micro-CT analysisSamples were fixed with 10% paraformaldehyde for 24 h and then analyzed by a SCANCO Medical CT-40 (SCANCO Medical, Bassersdorf, Switzerland). Scanning parameters were as follows: voltage, 80 kV; current, 500 μA; exposure time, 200 ms; rotation angle, 220°; CT reconstruction method; and COBRA-filtered back-projection reconstruction.
2.4 Isolation and culture of CON-ASCs and DOP-ASCsCON-ASCs and DOP-ASCs were obtained from inguinal subcutaneous adipose tissue of CON and DOP mice, respectively. An adipose block from the groin was cut into pieces of about 1 mm3 and evenly spread in a T25 culture flask. After covering the cap tightly, the flask was turned upside down and incubated at 37°C for about 5 min. Then, α-modified Eagle's medium (Hyclone, Pittsburgh, USA) with 10% FBS (Schaumburg, USA) was carefully added to the culture flask to completely immerse the tissue blocks. Subsequently, the tissue blocks were incubated at 37°C with 5% CO2 for 7–10 days to obtain passage 0 cells. The cells were passaged at 80%–90% confluence, and passage 3 cells were used in experiments.
2.5 Characterization of isolated ASCs by flow cytometryPassage 3 ASCs was resuspended with PBS and stained for CD29, CD44, CD45, CD90, CD31, or CD34 with fluorophore-conjugated antibodies at 4°C for 30 min. Unstained cells were used as a blank control. After washing with PBS, the cells were analyzed using a FACS Calibur flow cytometer (BD Biosciences, San Jose, USA).
2.6 Quantitative polymerase chain reactionQuantitative polymerase chain reaction (qPCR) was used to measure the mRNA expression levels of AK137033, secreted frizzle-related protein 2 (sFrp2), cadherin-associated protein, delta 1 (β-catenin), osteopontin (Opn), and runt-related transcription factor 2 (Runx2) in ASCs after osteogenic induction. Primer sequences are presented in Table 1. Total RNA from ASCs was extracted using an RNeasy Plus Mini kit (Qiagen, Hilden, Germany) in accordance with the manufacturer's instructions, and a PrimeScript RT reagent kit with gDNA Eraser (Takara Bio, Tokyo, Japan) was then used to synthesize cDNA from the total RNA. qPCR was performed using a SYBR Premix ExTaq kit (Takara Bio, Tokyo, Japan) and ABI 7300 system (Applied Biosystems, Wilmington, USA) in accordance with the manufacturers’ instructions with the following parameters: 95°C for 30 s and then 45 cycles of 95°C for 5 s and 60°C for 34 s. Glyceraldehyde phosphate dehydrogenase (GAPDH) was used as the internal reference.26
TABLE 1. Primer sequences for qPCR amplification of specific genes Genes Sequence (5’→3’) Gapdh Forward GGTGAAGGTCGGTGTGAACG Reverse CTCGCTCCTGGAAGATGGTG AK137033 Forward GCATGTACCCCACATTTCAGC Reverse CCAGCAATACACAGCAGGAC sFrp2 Forward CGTGGGCTCTTCCTCTTCG Reverse ATGTTCTGGTACTCGATGCCG β-Catenin Forward GCTGCGTGGACAATGGCTACTC Reverse AGCGTCAAACTGCGTGGATGG Opn Forward TCCCTCCCGGTGAAAGTGACTG Reverse TCCTCGCTCTCTGCATGGTCTC Runx2 Forward GACTGTGGTTACCGTCATGGC Reverse ACTTGGTTTTTCATAACAGCGGA 2.7 Western blot analysisProtein expression levels in ASCs after osteogenic induction were measured by western blotting. Total protein was extracted from ASCs using a total protein extraction kit (Keygen Biotech, Nanjing, China) in accordance with the manufacturer's instructions. Protein samples were mixed with loading buffer and boiled for 5 min for denaturation. After separation by SDS-PAGE, the protein samples were transferred to a polyvinylidene fluoride membrane by the wet transfer method and blocked in 5% dry skim milk at 37°C for 1 h. The blots were then incubated with diluted primary antibodies against sFrp2 (abs134753) (Absin, Shanghai, China), GSK-3β (12456), p-GSK-3β (5558) (Cell Signaling Technology, Danvers, USA), GAPDH (ab181602), β-catenin (ab32572), OPN (ab8448), or RUNX2 (ab92336) (Abcam, Cambridge, UK) with shaking at 4°C overnight. The following day, the membranes were washed three times with Tris-buffered saline with Tween-20 (TBST) and then incubated with diluted HRP-labeled goat anti-rabbit or anti-mouse secondary antibodies for 1 h. Then, the membranes were washed three times with TBST and developed with an enhanced chemiluminescence detection system (Bio-Rad, Hercules, USA).27, 28
2.8 Immunofluorescence stainingImmunofluorescence staining was used to analyze the relative expression of RUNX2 and OPN protein in ASCs. CON-ASCs and DOP-ASCs after osteogenic induction were washed with PBS for three times, fixed with 4% paraformaldehyde for 30 min, and then permeabilized with 0.5% Triton X-100 for 10 min. Subsequently, the samples were incubated with 5% sheep serum at 37℃ for 1 h and then incubated with diluted primary antibodies (anit-RUNX2 or -OPN) overnight. The following day, the samples were rewarmed at 37°C for 1 h and then incubated with a diluted fluorescent dye-conjugated anti-rabbit secondary antibody (Invitrogen, CA, USA) at 37°C for 1 h. The cytoskeleton and nucleus of ASCs were stained with phalloidin and 4′6-diamidino-2-phenylindole, respectively. Fluorescence images of each sample were obtained under a confocal laser microscope (Nikon, Tokyo, Japan).29, 30
2.9 Cell transfectionAK137033-specific SiRNA was synthesized by GenePharma (Shanghai, China), SiRNA sequences are shown in Table 2.
TABLE 2. SiRNA sequences designed for AK137033 Sequence (5’→3’) SiRNA Sense GCAUCAUGCAAUGAGGAAUTT Antisense AUUCCUCAUUGCAUGAUGCTT SiRNA-NC Sense UUCUCCGAACGUGUCACGUTT Antisense ACGUGACACGUUCGGAGAATTFor AK137033 overexpression, the AK137033 cDNA sequence was amplified and subcloned into a pcDNA3.1 vector. An empty pGFP3.1 vector that carried eGFP was used as the negative control.
SiRNA and the plasmid were transfected into ASCs using the Auto Electroporator system (Bimake, TX, USA) in accordance with the manufacturer's instructions for in vitro experiments.
For AK137033-specific overexpression, lentivirus and shRNA lentivirus were synthesized by Obio Technology (Shanghai, China). For AK137033 overexpression, the AK137033 cNDA sequence was amplified and subcloned into the pSLenti-EF1-EGFP-F2A-Puro-WPRE2-CMV-MCS lentiviral vector. For AK137033 knockdown, oligonucleotides with AK137033 splice variant RNA interference targets were annealed and ligated into the pSLenti-U6-shRNA-CMV-EGFP-F2A-Puro-WPRE lentiviral vector. The oligonucleotide sequences of shRNA with AK137033 RNA interference targets are shown in Table 3.
TABLE 3. Oligonucleotide sequences of shRNAs with AK137033 RNA interference targets 5’ STEM Loop STEM 3’ sh-AK137033-F Ccgg GGTCAACTACTACGTATAT TTCAAGAGA ATATACGTAGTAGTTGACC TTTTTTg sh-AK137033-R aattcaaaaaa GGTCAACTACTACGTATAT TCTCTTGAA ATATACGTAGTAGTTGACC sh-NC-F Ccgg CCTAAGGTTAAGTCGCCCTCG CTCGAG CGAGGGCGACTTAACCTTAGG TTTTTTg sh-NC-R aattcaaaaaa CCTAAGGTTAAGTCGCCCTCG CTCGAG CGAGGGCGACTTAACCTTAGGAK137033 overexpression or AK137033 knockdown lentiviruses were transfected into ASCs in accordance with the manufacturer's instructions for in vivo experiments.
2.10 Alizarin red and alkaline phosphatase (ALP) stainingAfter 3 or 5 days of osteoinduction, ASCs were rinsed with PBS three times and then fixed with 4% paraformaldehyde at 4°C for 30 min. ALP activity was detected by an Alkaline Phosphatase Assay Kit (Beyotime, Shanghai, China) in accordance with the manufacturer's guidelines. Similarly, after 14 days of osteoinduction, ASCs were rinsed with PBS for three times and then fixed with 4% paraformaldehyde at 4°C for 30 min. Fixed ASCs were incubated in a 0.1% alizarin red solution for 30 min at 37°C to assess the formation of calcium nodules.
2.11 Preparation of ASC-seeded BCP scaffoldsBiphasic calcium phosphate (BCP) scaffolds were provided by Sichuan University Research Center. After autoclaving the scaffolds, ASCs infected with lentiviruses were seeded on BCP scaffolds at 2 × 10⁵/cm2 and cultured in osteogenic induction medium for 48 h for subsequent in vivo experiments.
2.12 Establishment of a critical-sized calvarial bone defect model in mice and implantation of ASC-seeded BCP scaffolds in vivoASC-seeded BCP scaffolds were prepared as the following groups: BCP scaffold seeded with CON-ASCs (CON-B), BCP scaffold seeded with CON-ASCs transfected with the knockdown lentiviral vector (CON-NC), BCP scaffold seeded with CON-ASCs with AK137033 knockdown (CON-shRNA), BCP scaffold seeded with DOP-ASCs (DOP-B), BCP scaffold seeded with DOP-ASCs infected with the overexpression lentiviral vector (DOP-NC), and BCP scaffold seeded with DOP-ASCs overexpressed AK137033 (DOP-LVRNA). Fifteen CON mice were randomly divided into three groups, and fifteen DOP mice were randomly divided into three groups. A circular defect of 4 mm in diameter was made on the right calvarium of each mouse under sterile conditions. The prepared scaffolds were implanted into the bone defects (five mice in each group), and then, the muscle layer and skin were sutured. After the operation, the mice were fed under appropriate conditions (20–25°C with 65%–80% humidity).
2.13 Statistical analysisSPSS 19.0 software was used for statistical analysis. Data were tested by the t-test or one-way analysis of variance. Each experiment was repeated at least three times. The results are expressed as the mean ± standard deviation (SD). Data were significantly different at p < 0.05.
3 RESULTS 3.1 Successful establishment of the diabetic osteoporosis animal modelAfter STZ injection, we continuously observed changes in body weight and blood glucose in mice. The blood glucose levels of CON mice were <9 M; the blood glucose levels of mice in the DOP group were maintained at >16.8 M; and the weight of mice in the DOP group was lower than that in the CON group (Figure 1A). Compared with the CON group, H&E and Masson's staining of the pancreas showed that the volume of islets tissue in the DOP group was smaller, vacuolar degeneration had occurred, and inflammatory cells had infiltrated around islets (Figure 1B). The femurs of CON and DOP mice were stained with H&E and Masson, and subjected to micro-CT at 4 months after STZ injection. The results of histochemical staining showed that, compared with the CON group, bone trabeculae were fewer and disordered in the DOP group, and the bone cortex had become thinner (Figure 1C). These results were confirmed by micro-CT analysis (Figure 1D). Compared with CON mice, statistical analysis showed that Tb.BV/TV and Tb. Th were decreased, but Tb.BS/BV had increased in DOP mice (Figure 1E). On the basis of the above results, we concluded that the DOP mice model was established successfully.

Successful establishment of the diabetic osteoporosis mouse model. A, Compared to CON mice, DOP mice had a lighter body weight and higher blood glucose level (>16.8 M). B, The volume of islet tissue in the DOP group was smaller, vacuolar degeneration had occurred, and inflammatory cells had infiltrated around islets (indicated by yellow arrows). C, D, Histochemical staining and micro-CT analysis showed that, compared with the femur of the CON group, there was less and disordered bone trabeculae in the DOP group (indicated by red arrows) and the bone cortex had become thinner (indicated by green arrows). E, Statistical analysis of Tb.BV/TV, Tb. Th, and Tb.BS/BV between CON and DOP mice. Data shown as the mean ± SD (n ≥ 3), *p < 0.05; **p < 0.01; ***p < 0.001
3.2 Successful isolation and culture of CON-ASCs and DOP-ASCs, and their LncRNA/mRNA expression profilesCON-ASCs and DOP-ASCs were obtained from CON mice and DOP mice, respectively. The ASCs of each passage were observed under an inverted phase contrast microscope. Cell culture showed that ASCs grew adherently and were spindle shaped, plump, and distributed evenly (Figure 2A). The surface antigens of the passage 3 ASCs were detected by flow cytometry. Surface antigens CD29, CD44, and CD90 were positive on CON-ASCs and DOP-ASCs, and CD31, CD34, and CD45 were negative (Figure 2B, C). These results indicated that the ASCs were highly pure. Compared with CON-ASCs, cluster and volcano plots of LncRNA/mRNA expression profiles revealed that 370 LncRNAs and 362 mRNAs were upregulated, and 256 LncRNAs and 152 mRNAs were downregulated in DOP-ASCs (fold change > 1.5, and p < 0.05) (Figure 2D, E).

Isolation and culture of CON-ASCs and DOP-ASCs, and the results of LncRNA/mRNA expression profiling. A, Normal appearance of CON-ASCs and DOP-ASCs observed under an inverted phase contrast microscope. B, C, Surface antigens of passage 3 ASCs detected by flow cytometry. D, E, Cluster and volcano plots of LncRNA/mRNA expression profiles
3.3 Expression of AK137033, the Wnt signaling pathway, and osteogenic differentiation potential are downregulated in DOP-ASCsAfter 3 days of osteogenic induction, western blotting was used to measure the protein levels of sFrp2, GSK-3β, p-GSK-3β, β-catenin, RUNX2, and OPN in CON-ASCs and DOP-ASCs. Moreover, the mRNA levels of AK137033, β-Catenin, Runx2, and Opn were measured by qPCR. Additionally, ALP and alizarin red staining was used to detect differences in the osteogenic abilities of CON-ASCs and DOP-ASCs after 3 and 14 days of osteogenic induction. Compared with CON-ASCs, the protein and gene expression levels of Wnt signaling pathway makers and osteogenesis-related molecules, and the expression of LncRNA-AK137033 were downregulated in DOP-ASCs (Figure 3A, B). Moreover, ALP and alizarin red staining revealed fewer alkaline phosphatase and mineralized nodules in the DOP group than in the CON group (Figure 3C). These results showed that the expression of AK137033, the Wnt signaling pathway, and osteogenic differentiation potential were downregulated in DOP-ASCs.

AK137033 and a change in the methylation levels of the sFrp2 promoter region are involved in the regulation of the osteogenic differentiation potential of DOP-ASCs. A, Western blot analysis of sFrp2, p-GSK-3β, β-catenin, RUNX2, and OPN in CON-ASCs and DOP-ASCs. B, qPCR analysis of AK137033, sFrp2, β-Catenin, Runx2, and Opn in CON-ASCs and DOP-ASCs. C, ALP and alizarin red staining revealed less alkaline phosphatase activity and fewer mineralized nodules in the DOP group than those in the CON group. D, MeDIP sequencing showed that the DNA methylation level of the sFrp2 promoter region in DOP-ASCs was significantly higher than that in CON-ASCs (genomic coordinates: chr3, 83765880–83766230). E, Meth Primer analysis showed a large amount of CpG islands (CGIs) in the sFrp2 promoter region (genomic coordinates: chr3, 83765880–83766230). F, BSP confirmed that the methylation level in the sFrp2 promoter region (genomic coordinates: chr3, 83765880–83766230) of CON-ASCs was higher than that in DOP-ASCs. G, Correlation analysis of AK137033 and the DNA methylation level of the sFrp2 promoter region in CON-ASCs and DOP-ASCs. Data shown as the mean ± SD (n ≥ 3), *p < 0.05; **p < 0.01; ***p < 0.001
3.4 Inhibition of the Wnt signaling pathway in DOP-ASCs may be related to AK137033 and changes in the DNA methylation level in the sFrp2 promoter regionWe performed MeDIP sequencing and mRNA/LncRNA expression profiling of CON-ASCs and DOP-ASCs. MeDIP sequencing showed that the DNA methylation peak of the sFrp2 promoter region in CON-ASCs was significantly higher than that in DOP-ASCs (genomic coordinates: chr3, 83765880–83766230) (Figure 3D). Interestingly, calculation by Meth Primer software showed a large amount of CpG islands (CGIs) in the sFrp2 promoter region (genomic coordinates: chr3, 83765880–83766230), which is a prerequisite for DNA methylation (Figure 3E). BSP results confirmed that the methylation degree of CON-ASCs was higher than that of matched DOP-ASCs in the sFrp2 promoter region (genomic coordinates: chr3, 83765880–83766230) (Figure 3F). Additionally, combined with the results of MeDIP sequencing and mRNA/LncRNA expression profiling, we found a statistical correlation between AK137033 expression and the methylation level in the sFrp2 promoter region (Figure 3G). These results demonstrated that the inhibition of the Wnt signaling pathway in DOP-ASCs may be related to AK137033 and changes in the DNA methylation level in the sFrp2 promoter region.
3.5 AK137033 silencing inhibits the Wnt signaling pathway in CON-ASCs by reducing the DNA methylation level of the sFrp2 promoter regionPrevious studies have shown that the inhibition of the Wnt signaling pathway in DOP-ASCs may be related to AK137033 and changes in the DNA methylation level in the sFrp2 promoter region, and AK137033 was highly expressed in CON-ASCs. Therefore, we silenced AK137033 by specific siRNAs in CON-ASCs and then detected the expression of mRNAs and proteins related to the Wnt signaling pathway. CON-ASCs in the SiRNA group were transfected with si-AK137033, and CON-ASCs in groups B and NC were treated with ordinary osteogenic induction medium and a siRNA negative control, respectively. At 3 days after osteogenic induction, we performed qPCR and western blot analyses. Compared with B and NC groups, the Wnt signaling pathway markers and downstream osteogenesis-related molecules in the SiRNA group were suppressed after AK137033 silencing (Figure 4A, B). Similar results were obtained after 5 days of osteogenesis induction (Figure 4C, D). More importantly, BSP results revealed that the DNA methylation level of the sFrp2 promoter region in the SiRNA group was downregulated after AK137033 silencing (Figure 4E). These changes indicated that AK137033 silencing inhibited the Wnt signaling pathway in CON-ASCs by reducing the DNA methylation level of the sFrp2 promoter region.

AK137033 silencing inhibits the Wnt signaling pathway in CON-ASCs by reducing the DNA methylation level of the sFrp2 promoter region. A, B, The mRNA and protein levels of Wnt signaling pathway makers and osteogenesis-related molecules in the SiRNA group were decreased after AK137033 silencing in CON-ASCs (osteoinduction for 3 days). C, D, After AK137033 was silenced in CON-ASCs, the mRNA and protein levels of Wnt signaling pathway markers and osteogenesis-related molecules were decreased in the SiRNA group (osteoinduction for 6 days). E, BSP results revealed that the DNA methylation level of the sFrp2 promoter region in the SiRNA group was downregulated compared with that in B and NC groups. Data shown as the mean ± SD (n ≥ 3), *p < 0.05; **p < 0.01; ***p < 0.001
3.6 AK137033 silencing decreases the osteogenic ability of CON-ASCs cellsTo explore changes in the osteogenic differentiation potential after silencing AK137033 in CON-ASCs, we performed immunofluorescence, alizarin red, and ALP staining. At 3 days after osteogenic induction, immunofluorescence staining showed that the expression of RUNX2 and OPN in the SiRNA group was decreased compared to that in B and NC groups (Figure 5A, B). Alizarin red staining revealed fewer mineralized nodules in the SiRNA group than in B and NC groups after 14 days of osteogenic induction (Figure 5C). At 3 and 5 days of osteogenic induction, ALP staining showed less alkaline phosphatase produced by the SiRNA group than that by B and NC groups (Figure 5D, E). These results suggested that silencing AK137033 reduced the osteogenic differentiation potential of CON-ASCs.

AK137033 silencing reduces the osteogenic differentiation potential of CON-ASCs. A, B, At 3 days after osteogenic induction, immunofluorescence staining of RUNX2 and OPN proteins was performed in CON-ASCs. C, Alizarin red staining showed that the bone differentiation potential of the SiRNA group was decreased compared to that of B and NC groups after 14 days of osteogenesis induction in CON-ASCs. At 3 (D) or 5 (E) days of osteogenic induction in CON-ASCs, ALP staining showed that alkaline phosphatase activity of the SiRNA group was lower than that of B and NC groups
3.7 AK137033 overexpression activates the Wnt signaling pathway in DOP-ASCs by increasing the DNA methylation level of the sFrp2 promoter regionAt 3 days after osteogenic induction, compared with B and NC groups, qPCR and western blotting showed that the mRNA and protein levels of Wnt signaling pathway markers and downstream osteogenesis-related molecules were increased in the AK137033 plasmid (OE) group (Figure 6A, B). Similar results were obtained after 5 days of osteogenic induction (Figure 6C, D). Additionally, BSP results showed that the DNA methylation level of the sFrp2 promoter region in the OE group was increased after AK137033 overexpression (Figure 6E). To activate the Wnt signaling pathway in DOP-ASCs, we transfected a plasmid that carried the AK137033 cDNA sequence into DOP-ASCs (Figure 6F). Taken together, these observations indicated that AK137033 overexpression activated the Wnt signaling pathway in DOP-ASCs by increasing the DNA methylation level of the sFrp2 promoter region.

AK137033 overexpression activates the Wnt signaling pathway in DOP-ASCs by increasing the DNA methylation level of the sFrp2 promoter region. A, B, The mRNA and protein levels of Wnt signaling pathway makers and osteogenesis-related molecules in the OE group were increased after AK137033 overexpression in DOP-ASCs (osteoinduction for 3 days). C, D, After AK137033 overexpression in DOP-ASCs, the mRNA and protein levels of Wnt signaling pathway markers and osteogenesis-related molecules were increased in the OE group (osteoinduction for 6 days). E, BSP results revealed that the DNA methylation level of the sFrp2 promoter region in the OE group was upregulated compared to that in B and NC groups. F, Cellular uptake of NC and OE plasmids by DOP-ASCs after treatment for 48 h. Data shown as the mean ± SD (n ≥ 3), *p < 0.05; **p < 0.01; ***p < 0.001
3.8 AK137033 overexpression increases the osteogenic ability of DOP-ASCsTo investigate changes in the osteogenic differentiation potential of DOP-ASCs after overexpression of AK137033, immunofluorescence, alizarin red, and ALP staining were performed. After 3 days of osteogenic induction, immunofluorescence staining showed that the expression of RUNX2 and OPN in the OE group was increased compared with that in B and NC groups (Figure 7A, B). Alizarin red staining showed more mineralized nodules in the OE group than those in B and NC groups at 14 days of osteogenesis (Figure 7C). ALP staining revealed higher production of alkaline phosphatase in the OE group than that in B and NC groups at 3 and 5 days of osteogenic induction (Figure 7D, E). These changes indicated that overexpression of AK137033 enhanced the osteogenic differentiation potential of DOP-ASCs.

AK137033 overexpression increases the osteogenic ability of DOP-ASCs. A, B, At 3 days after osteogenic induction, immunofluorescence staining of RUNX2 and OPN proteins was performed in DOP-ASCs. C, AK137033 overexpression rescued the decline of the osteogenic ability of DOP-ASCs induced by DOP as determined by alizarin red staining (14 days of osteogenic induction). At 3 (D) or 5 (E) days of osteogenic induction in DOP-ASCs, ALP staining showed that alkaline phosphatase activity in the OE group was higher than that in B and NC groups
3.9 In vivo verification of AK137033 in regulating the osteogenic ability of ASCsTo further assess the osteogenic role of AK137033 in vivo, we knocked down AK137033 in CON-ASCs using a specific shRNA lentivirus (shRNA group) and overexpressed AK137033 in DOP-ASCs through a specific LVRNA lentivirus (LVRNA group). After lentivirus infection, the effect was assessed by qPCR and western blotting after 3 days of osteogenic induction. The results showed that the shRNA lentivirus knocked down the expression of AK137033 in CON-ASCs and the LVRNA lentivirus overexpressed AK137033 in DOP-ASCs (Figure 8A, B). Next, we prepared ASC-seeded BCP scaffolds. Scanning electron microscopy and fluorescence microscopy showed that CON-ASCs and DOP-ASCs adhered to the surface and pores of BCP scaffolds (Figure 8C).

Preparation of ASC-seeded BCP scaffolds and the critical-sized calvarial bone defect mouse model. A, B, Transfection efficiency verified by qPCR and western blot analysis after CON-ASCs were infected with the shRNA lentivirus, and DOP-ASCs were infected with LVRNA. C, Scanning electron microscopy and fluorescence microscopy of prepared CON-ASC-seeded BCP scaffolds and DOP-ASC-seeded BCP scaffolds. D, Establishment of the critical-sized calvarial bone defect mouse model and implantation of ASC-seeded BCP scaffolds. Data shown as the mean ± SD (n ≥ 3), *p < 0.05; **p < 0.01; ***p < 0.001
Subsequently, we implanted ASC-seeded BCP scaffolds into a critical-sized calvarial bone defect model in CON and DOP mice (Figure 8D). Among them, CON mice were implanted with a BCP scaffold seeded with CON-ASCs (CON-B), BCP scaffold seeded with CON-ASCs transfected with the knockdown lentivirus vector (CON-NC), and BCP scaffold seeded with CON-ASCs with AK137033 knockdown (CON-shRNA); and BCP scaffold seeded with DOP-ASCs (DOP-B), BCP scaffold seeded with DOP-ASCs infected with the overexpression lentivirus vector (DOP-NC), and BCP scaffold seeded with DOP-ASCs that overexpressed AK137033 (DOP-LVRNA) were implanted in DOP mice. At 8 weeks after transplantation, the formation of mouse calvarial bone was detected by micro-CT and histochemistry. Micro-CT scanning showed that the knockout of AK137033 decreased the bone volume/total volume (Tb.BV/TV) and trabecular thickness (Tb. Th) in CON mice, while the bone surface area/bone volume (Tb.BS/BV) was increased. Conversely, in DOP mice, overexpression of AK137033 reversed the decrease in bone formation caused by DOP (Figure 9A, B). In CON mice, histochemical staining revealed that the amount of fibrotic and mineralized new bone in the shRNA group was less than that in B and NC groups. In DOP mice, the bone formation ability of the LVRNA group was rescued compared to that in B and NC groups (Figure 9C, D). On the basis of these results, we concluded that AK137033 regulated osteogenesis of ASCs in vivo. The decrease in the osteogenic differentiation potential of DOP-ASCs was related to the low expression of AK137033.

Evaluation of skull repair at 8 weeks after implantation. A, B, Micro-CT scanning showed that the knockout of AK137033 decreased Tb.BV/TV and Tb. Th, while Tb.BS/BV was increased in CON mice. In DOP mice, overexpression of AK137033 reversed the decreases in Tb.BV/TV and Tb. Th, and the increased Tb.BS/BV caused by DOP. C, D, H&E and Masson's staining showed that, in CON mice, the amount of fibrotic and mineralized new bone in the shRNA group was less than that in B and NC groups. In DOP mice, the bone formation ability of the LVRNA group was rescued compared with B and NC groups. Data shown as the mean ± SD (n ≥ 3), *p < 0.05; **p < 0.01; ***p < 0.001
4 DISCUSSIONDiabetes is a group of systemic metabolic diseases characterized by a disturbance in carbohydrate metabolism caused by islet dysfunction or insulin resistance.31 Chronic hyperglycemia causes chronic damage to various tissues and organs of the body, which results in various diabetic complications, especially in the eyes, kidneys, blood vessels, and bones.32-34 Among them, diabetic osteoporosis refers to the metabolic bone disease that occurs because of the hyperglycemic microenvironment.32 Recent studies have shown that insulin deficiency or tolerance in diabetic patients leads to disruptions of glucose, lipid, and calcium metabolisms, which results in dysfunctional osteoblasts and osteoclasts and ultimately causes systemic bone loss and a reduction in bone mineral density.35, 36 Additionally, hyperglycemic microenvironment-induced autophagy adversely affects the proliferation and differentiation of osteoblasts, which is associated with increases in fracture risk and bone mineral density loss in diabetes.37 However, there are few studies on the role of epigenetic alterations of ASCs in the pathogenesis of DOP. The etiology and course of DOP are complex. Therefore, establishment of a DOP animal model is crucial to
留言 (0)