
記住我

Traumatic brain injury (TBI) is a major global health issue that affects an estimated 69 million people worldwide each year and is a leading contributor to death and disability (Bruns & Hauser, 2013; Dewan et al., 2019; Shao et al., 2018). Approximately 20% of incidences range from moderate to severe, and these individuals often experience persistent impairments in their cognitive, social, emotional, and physical function with high financial costs for society (Andelic et al., 2018; Asmamaw, Yitayal, Debie, & Handebo, 2019; Forslund et al., 2019; Fu, Jing, McFaull, & Cusimano, 2015; Juengst et al., 2015; Polinder et al., 2005; Van Deynse et al., 2019). TBI typically results in focal damage due to impact-acceleration forces, predominantly in the frontal and temporal lobe, leading to reductions in cortical grey matter volume (Bendlin et al., 2008; Bruns & Hauser, 2013; Hyder, Wunderlich, Puvanachandra, Gururaj, & Kobusingye, 2007; Mckee & Daneshvar, 2015). Additionally, these forces can cause stretching and shearing of axons resulting in traumatic axonal injury (TAI) and subsequent white matter loss (Armstrong, Mierzwa, Marion, & Sullivan, 2016; Bendlin et al., 2008; Mckee & Daneshvar, 2015; Warner, De La Plata, et al., 2010). Although damage to the brain is mainly attributed to these primary events, compelling evidence suggests that TBI triggers long-term neurodegeneration accompanied by functional and behavioural changes (Bendlin et al., 2008; Sidaros et al., 2009).
Previous studies, including ones that have examined the cohort assessed here, have described ongoing losses in brain volume, including subcortical structures, white matter, and the cortex over the months and years following moderate–severe TBI (Belchev et al., 2021; Bendlin et al., 2008; Brezova et al., 2014; Cole et al., 2018; Gooijers et al., 2016; R. E. A. Green et al., 2014; O'Phelan, Otoshi, Ernst, & Chang, 2018; Sidaros et al., 2009). While these studies provide substantial evidence for volumetric changes in both grey and white matter following moderate–severe TBI, no longitudinal studies in adults have investigated changes to the two cortical surface-based morphometry measures that contribute to volume: cortical thickness (CT) and cortical surface area (CSA). The significance many studies have placed on cortical volume as the primary measure of interest to identify alterations in the cortical structure following TBI may mask specific changes associated with CT and CSA. CT alterations may indicate disturbances in the quantity, size, and organization of cells within a column in cortical layers following TBI (Meyer, Liem, Hirsiger, Jäncke, & Hänggi, 2014; Rakic, 1988), whereas, CSA changes may reveal how the injury affects the number of cellular columns or the integrity of underlying white matter, with CSA expansion reflecting diminution of these fibres (Meyer et al., 2014; Rakic, 1988; Van Essen, 1997). Thus, separately evaluating the two measures can provide more insight into structural changes following TBI.
The covariance between CT and CSA changes can be used to examine how cortical alterations in one region are coordinated with cortical changes in other regions and how changes in different measures are related to each other (Alexander-Bloch, Giedd, & Bullmore, 2013). Studies suggest that anatomically or functionally interconnected brain regions demonstrate strong positive correlations between changes within cortical measures, and neurodegenerative disorders can alter these covariance patterns (Andrews, Halpern, & Purves, 1997; J. P. Lerch et al., 2006; Seeley, Crawford, Zhou, Miller, & Greicius, 2009; Wright et al., 1999). Diminished relationships between brain regions that are part of a known circuit suggest localized degeneration and strengthened relationships may indicate diffusion of injury due to mechanisms such as diffuse axonal injury or transneuronal degeneration (Alexander-Bloch et al., 2013; Desikan et al., 2010; R. E. A. Green et al., 2014; He, Chen, & Evans, 2008; Yao et al., 2010; Yount et al., 2002). Investigations of relationships between changes in CT and CSA in healthy adults have reported negative associations (Hogstrom, Westlye, Walhovd, & Fjell, 2013; Storsve et al., 2014). Although they are not independent measures, examining longitudinal changes in CT and CSA and how these alterations covary following TBI may better characterize the progression of cortical degeneration and/or recovery.
In this study, longitudinal changes in CT and CSA were examined in the chronic stage of injury in adults who sustained a moderate–severe TBI. First, cross-sectional analyses were conducted to establish differences between TBI and control participants in the early chronic stage, 5-months post-injury. Second, changes in CT and CSA up to 7 years after injury were assessed. Third, covariance in the change of cortical measures was assessed to examine how regional changes in CT and CSA are related to each other. We hypothesized that TBI participants would demonstrate reductions in CT and CSA 5-months post-injury, predominantly in regions vulnerable to focal trauma, relative to controls. Furthermore, given that progressive atrophy of regions beyond the initial site of impact has been described following TBI, we predicted widespread CT and CSA changes over time in TBI participants. Finally, in individuals with TBI, we expected to observe strengthened positive correlations between regions presenting changes in the same morphometric measure over time and negative correlations between regions displaying both CT and CSA changes.
2 MATERIALS AND METHODS 2.1 Sample 2.1.1 TBI participantsThe study samples' data were obtained from a longitudinal, prospective study investigating TBI recovery (The Toronto TBI Recovery Study) (Adnan et al., 2013; Belchev et al., 2021; R. E. Green et al., 2008; R. E. A. Green et al., 2014; Greenberg, Mikulis, Ng, DeSouza, & Green, 2008; Miller, Colella, Mikulis, Maller, & Green, 2013; Ng et al., 2008; Terpstra, Girard, Colella, & Green, 2017; Till, Colella, Verwegen, & Green, 2008). A total of 105 participants with clinically confirmed TBI were recruited, and after quality control, 67 participants were included in the present study. The severity of TBI was assessed using either their Glasgow Coma Scale (GCS) score or length of post-traumatic amnesia (PTA). TBI severity ranged from moderate to severe, with an average GCS score in the severe range (M = 5.7). Consent was acquired by all participants, and approval of the study protocol was obtained from the Research Ethics Board of the Toronto Rehabilitation Institute, where it was conducted.
Primary inclusion criteria for the Toronto TBI Recovery Study comprised of the following: (a) medical diagnosis of TBI indicating injuries required inpatient rehabilitation; (b) minimum length of PTA of 1 hr, and/or a GCS score of 12 or less determined at either the hospital or at the accident location, and/or neuroimaging results indicating positive findings; (c) between the ages of 17 and 80; (d) absence of PTA by 3-months post-injury; (e) ability to use at least one upper extremity; and (f) ability to comprehend basic instructions in English. Exclusion criteria were as follows: (a) previous history of TBI or stroke or psychiatric disorders, and (b) diagnosis of a condition that affects the central nervous system.
2.1.2 Control groupA total of 18 healthy adults were included as controls in the current study, and the same exclusion criteria were employed as above. These participants consisted of students, family members of patients, or staff members at the rehabilitation hospital.
2.2 Magnetic resonance imaging acquisitionA General Electric Signa-Echospeed 1.5 Tesla HD scanner (SIGNA EXCITE, GE Healthcare, Milwaukee, WI) was used to acquire T1-weighted magnetic resonance images (MRI) scans. Scans were acquired approximately 5, 18, 36, months and up to 7 years post-injury for TBI participants. Controls underwent MRI twice, with an average of 15 months between scans, similar to the interval between the first and second scans of TBI participants. Isotropic T1 weighted, three-dimensional IR prepped radio-frequency spoiled-gradient recalled-echo images were acquired in the axial plane with the following parameters: repetition time = 12 ms; echo time = 5 ms; inversion time = 300 ms, flip angle = 20°, slice thickness = 1 mm; matrix = 256 × 256; FOV = 25 cm.
2.3 Image processing—CT and CSAT1-weighted MRI images were first preprocessed using minc-bpipe-library. This pipeline completed inhomogeneity correction with N4ITK, registration to MNI symmetric space, cropping of the neck to enhance linear registration and creation of brain masks using BEaST, and produces outputs in native space (Eskildsen et al., 2012; Tustison et al., 2010). Brain masks were manually edited to exclude excess dura matter and were aligned to processed T1 images. Preprocessed T1 images and the manually corrected brain masks were then submitted to CIVET processing pipeline (Version 1.1.12; Montreal Neurological Institute). To compute CT and CSA, CIVET performed linear registration to stereotaxic space and classification of tissue, and deformable surface models were used to create white and grey matter surfaces for each hemisphere with 40,962 vertices each (J. P. Lerch & Evans, 2005). Quality control was conducted by visually inspecting CIVET outputs for each subject to verify the accuracy of image registration and surface extraction. Subjects' scans were excluded from the study if processed T1 images indicated the presence of excess motion (n = 9), poor contrast (n = 9), misclassification of brain matter (n = 36), visible cortical lesions (n = 25), or were missing data (n = 6). This resulted in 38 participants from the original sample being excluded from the analyses and an additional 8 participants having one or more scans excluded.
2.4 StatisticsCT and CSA analyses were performed using the software package RMINC (Brain Imaging Centre, Montreal Neurological Institute; http://mouse-imaging-centre.github.io/RMINC/) in the R environment (Version 3.6.3) (R Core Team, 2013). To calculate p-values, degrees of freedom were estimated using the Satterthwaite approximation (Satterthwaite, 1946). The statistical threshold used to account for multiple comparisons was established by application of a 10% false discovery rate (FDR) correction corresponding to q-values <0.1, unless specified otherwise (Genovese, Lazar, & Nichols, 2002).
2.4.1 Group differences in cortical morphometry in the early chronic phase post-injuryCT and CSA were compared between 18 control participants and 67 TBI participants at all vertices in the deformable surface model from scans collected at approximately 5-months post-injury using vertex-wise linear models, with age at scan, sex, and years of education (YOE) as covariates.
2.4.2 Changes in cortical morphometry across the chronic phase post-injuryLinear mixed-effect models were used to assess the effect of time since the baseline scan on cortical morphometry for 16 control and 49 TBI participants that had two (26 participants) or more (23 participants) scans in the final sample. Age at scan, sex, and YOE were included as fixed effects and subject as a random effect. The moderating effect of group on the relationship between time and cortical morphometry was investigated by including an interaction term for group and time. The effect of time on cortical morphometry was also assessed separately in the TBI and control groups. The significance of each coefficient was based on Wald t tests using the Satterthwaite approximation to estimate degrees of freedom.
2.4.3 Relationships between regional changes in cortical morphometry Regions were selected to assess coordinated cortical changes if a region, defined by the AAL atlas (Tzourio-Mazoyer et al., 2002), had a minimum of 10 vertices where a significant change in CT or CSA was detected over time in the previous analysis. Most participants had a single follow-up scan, thus, the final scan obtained for each participant was used to calculate the mean rate of change (RoC). The mean RoC of CT and CSA for each region was calculated as follows:

Correlations were computed using Pearson's r to assess the relationship between the mean RoC of cortical morphometry of each pair-wise combination of regions for TBI participants with two or more scans. Multiple comparison correction was conducted for the whole correlation matrix using a more stringent FDR threshold of 1.0% taking into consideration inherent correlations in cortical measures.
2.4.4 Relationships between regional changes in cortical morphometry and TBI severityLinear models were used to assess the relationship between the mean RoC of the 66 regions displaying changes in CT and CSA over time in the TBI group and their recorded GCS, as a proxy for injury severity.
3 RESULTS 3.1 Sample characterizationTable 1 provides demographic and injury characteristics for the TBI group gathered from medical records, direct testing, and/or from the patient and family members during clinical interviews. Participants included in this study were representative of a typical sample of moderate to severe TBI: predominantly male, injuries were largely due to motor vehicle accidents, participants had average estimated premorbid IQ, and slightly above a high-school education.
TABLE 1. Injury and demographic characteristics of TBI sample (N = 67) Variable Proportion/mean SD (range) Age at injury (years) M = 36.7 15.0 (17–73) Education (years) M = 13.6 3.1 (4–18) Estimated pre-morbid IQ (WTAR) M = 100.7 17.7 (50–125) Sex27% (N) = female
73% (N) = male
Type of injury Motor vehicle accident 65.7% Fall 26.9% Assault 4.5% Sports injury 3.0% Other 0.0% Severity of injury variables Acute care length of stay (days) M = 36.8 days 18.8 (8–98) GCS (lowest recorded scores) M = 5.7 3.1 (2–13) Mild (13–15) 6.0% Moderate (9–12) 6.0% Severe (<8) 77.6% Missing data 10.4% Length of post-traumatic amnesia Less than 5 min, very mild 4.5% 5–60 min, mild 0.0% 1–24 hr, moderate 0.0% 1–7 days, severe 20.9% 1–4 weeks, very severe 49.3% >4 weeks, extremely severe 20.9% Missing data 4.48% Abbreviations: GCS, Glasgow Coma Scale; TBI, traumatic brain injury.Overall, the control group consisted of 11 females and 7 males, who had a mean age of 34.4 years (SD = 11.3, range = 18–60), and 16.3 YOE (SD = 2.6, range = 12–21).
Comparisons between control and TBI participants indicated that there were no significant group differences for age, t (83) = −0.7, p = .49. Controls had significantly more education, t (83) = 3.3, p = .002, and sex differences between the two groups were significant, X-squared = 5.95, p = .01.
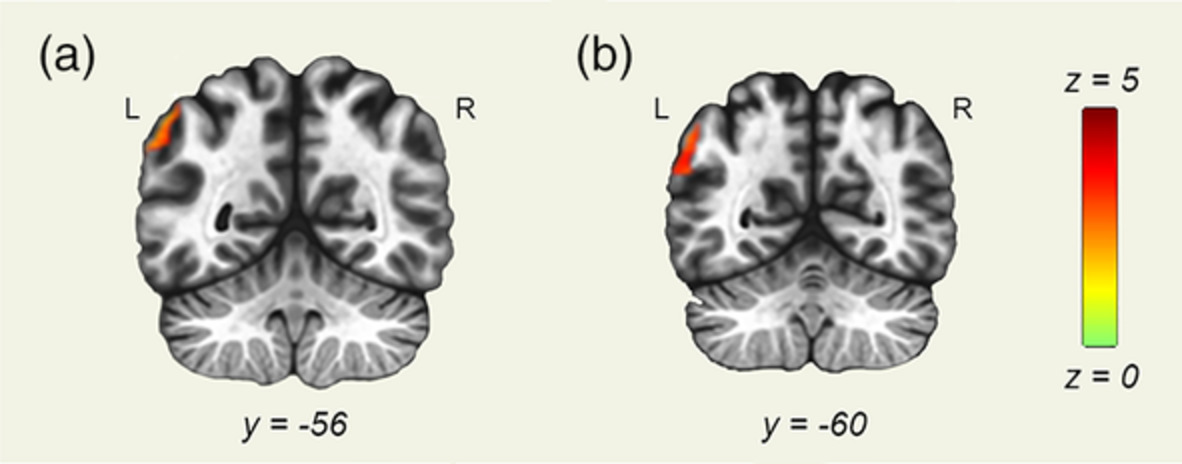
3.2 Group differences in cortical morphometry in the early chronic phase post-injuryVertex-wise morphometry analyses revealed areas of the cortex, predominantly located in the frontal lobe, were thinner bilaterally in the TBI group at 5-months post-injury relative to controls (Figure 1). No regions indicated thicker cortices in TBI participants relative to controls. Group comparisons of CSA did not reach the threshold for significance.

Differences in cortical thickness between control and traumatic brain injury (TBI) participants at 5-months post-injury. Coloured regions represent the location of significantly thinner vertex-wise cortical regions in TBI compared to control (10% false discovery rate [FDR] corrected), where darker shades reflect the most significant group differences (see colour bar). Cortical thickness at single vertices indicated by the crosshairs on the cortical surfaces above are plotted to illustrate group differences
3.3 Cortical morphometry changes across the chronic phase post-injuryVertex-wise morphometry analyses indicated that the interaction between participant group and time was not significant. Analyses assessing the effect of time on cortical morphometry in the control group indicated no significant relationships between time and CT or CSA as all q values exceeded 0.1 (Table 2).
TABLE 2. The effect of time on morphometry of cortical vertices in controls and TBI Cortical morphometric variable Minimum q value for controls Minimum q value for TBI Thickness of the left hemisphere 0.80 3.2−9 Thickness of the right hemisphere 0.58 6.7−9 Surface area of the left hemisphere 0.99 6.7−3 Surface area of the right hemisphere 0.53 9.4−2 Abbreviation: TBI, traumatic brain injury.Conversely, the effect of time on cortical grey matter in the TBI group revealed bilateral thinning primarily evident in the posterior cortex (Figure 2a), and bilateral increases in CT over time in the frontal cortex (Figure 2b).

Effect of time on cortical thickness in the traumatic brain injury (TBI) group. Coloured areas represent the location of vertices that demonstrate a significant change in cortical thickness over time (10% false discovery rate [FDR] corrected), where darker shades reflect the most substantial changes (see colour bar). Cortical thickness at single vertices indicated by crosshairs on the cortical surfaces above are plotted to illustrate cortical thickness changes over time. (a) Regions of the cortex decreasing in thickness over time. (b) Regions of the cortex increasing in thickness over time
For CSA of the left hemisphere, reduction over time was predominantly present in the frontal cortex (Figure 3a), whereas increases were mainly observed in the paracentral lobule and, median cingulate and paracingulate gyri (Figure 3b). In the right hemisphere, increases in CSA were apparent in the supplementary motor area and superior frontal gyrus (Figure 3b). Table 3 provides a comprehensive list of all cortical regions that displayed longitudinal changes in TBI participants.

Effect of time on cortical surface area in the traumatic brain injury (TBI) group. Coloured areas represent the location of vertices that demonstrated significant change in surface area over time (10% false discovery rate [FDR] corrected), where darker shades reflect the most substantial changes (see colour bar). Cortical surface area at single vertices indicated by crosshairs on the cortical surfaces above are plotted to illustrate surface area changes over time. (a) Regions of the cortex decreasing in surface area over time. (b) Regions of the cortex increasing in surface area over time
TABLE 3. Cortical regions exhibiting changes in thickness and surface area over time in TBI participants Cortical regions decreasing in thickness over time Cortical regions increasing in thickness over time Cortical regions decreasing in surface are over time Cortical regions increasing in surface are over time Left precentral gyrus (PreCG.L.CT) Left middle frontal gyrus, orbital part (ORBmid.L.CT) Left superior frontal gyrus, orbital part (ORBsup.L.SA) Left precentral gyrus (PreCG.L.SA) Left middle frontal gyrus (MFG.L.CT) Left inferior frontal gyrus, triangular part (IFGtriang.L.CT) Left middle frontal gyrus, orbital part (ORBmid.L.SA) Left supplementary motor area (SMA.L.SA) Left supplementary motor area (SMA.L.CT) Left inferior frontal gyrus, orbital part (ORBinf.L.CT) Left inferior frontal gyrus, orbital part (ORBinf.L.SA) Left median cingulate and paracingulate gyri (DCG.L.SA) Left median cingulate and paracingulate gyri (DCG.L.CT) Left superior frontal gyrus, medial (SFGmed.L.CT) Left gyrus rectus (REC.L.SA) Left postcentral gyrus (PoCG.L.SA) Left posterior cingulate gyrus (PoCG.L.CT) Left superior frontal gyrus, dorsolateral (SFGdor.L.CT) Left precuneus (PCUN.L.SA) Left calcarine fissure and surrounding cortex (CAL.L.CT) Right superior frontal gyrus, orbital part (ORBsup.R.CT) Left paracentral lobule (PCL.L.SA) Left cuneus (CUN.L.CT) Right middle frontal gyrus (MFG.R.CT) Right supplementary motor area (SMA.R.SA) Left lingual gyrus (LING.L.CT) Right middle frontal gyrus, orbital part (ORBmid.R.CT) Right superior frontal gyrus, medial (SFGmed.R.SA) Left superior occipital gyrus (SOG.L.CT) Right inferior frontal gyrus, opercular part (IFGoperc.R.CT) Left middle occipital gyrus (MOG.L.CT) Right inferior frontal gyrus, triangular part (IFGtriang.R.CT) Left fusiform gyrus (FFG.L.CT) Right inferior frontal gyrus, orbital part (ORBinf.R.CT) Left post central gyrus (PoCG.L.CT) Right Rolandic operculum (ROL.R.CT) Left superior parietal gyrus (SPG.L.CT) Right superior frontal gyrus, medial (SFGmed.R.CT) Left supramarginal gyrus (SMG.L.CT) Right superior frontal gyrus, medial orbital (ORBsupmed.R.CT) Left angular gyrus (ANG.L.CT) Right insula (INS.R.CT) Left precuneus (PCUN.L.CT) Right fusiform gyrus (FFG.R. CT) Left paracentral lobule (PCL.L.CT) Right inferior temporal gyrus (ITG.R.CT) Left superior temporal gyrus (STG.L.CT) Left middle temporal gyrus (MTG.L.CT) Right precentral gyrus (PreCG.R.CT) Right superior frontal gyrus, dorsolateral (SFGdor.R.CT) Right supplementary motor area (SMA.R.CT) Right median cingulate and paracingulate gyri (DCG.R.CT) Right posterior cingulate gyrus (PCG.R.CT) Right calcarine fissure (CAL.R.CT) Right cuneus (CUN.R.CT) Right lingual gyrus (LING.R.CT) Right superior occipital gyrus (SOG.R.CT) Right middle occipital gyrus (MOG.R.CT) Right postcentral gyrus (PoCG.R.CT) Right superior parietal gyrus (SPG.R.CT) Right supramarginal gyrus (SMG.R.CT) Right angular gyrus (ANG.R.CT) Right precuneus (PCUN.R.CT) Right paracentral lobule (PCL.R.CT) Right superior temporal gyrus (STG.R.CT) Right middle temporal gyrus (MTG.R.CT) Abbreviation: TBI, traumatic brain injury. 3.4 Relationships between regional changes in cortical morphometryTo assess the coordination of cortical changes over time across regions following TBI, we looked at the strength of correlations between the RoC of CT and CSA in pair-wise combinations of 66 regions displaying longitudinal changes in CT or CSA in TBI participants (regions and abbreviations listed in Supplemental Table 1). Following multiple comparison corrections, 270 correlations met the threshold for significance. Upon inspection of these results, two participants with average standard deviations from the mean across regions of 2 and 6 were removed from the analysis to ensure statistically significant correlations were not driven by outliers. This resulted in 189 correlations maintaining significance, and interpretations are restricted to these observations (Figure 4, Table 4).

Significant correlations between the rate of change of cortical thickness or surface area of regions displaying longitudinal changes in these measures. Regions are grouped by cortical morphometric measure and hemisphere. Cool colours reflect negative correlations and warm colours reflect positive correlations (see colour bar)
TABLE 4. Summary of types and number of significant correlations Type of correlation Negative correlations (n) Positive correlations (n) Total correlations (n) Correlation between regions with cortical thickness changes 0 162 162 Correlation between regions with surface area changes 0 10 10 Correlation between regions with cortical thickness and surface area changes
留言 (0)