
記住我


Transporters located in the outer membranes of cells mediate the uptake and efflux of numerous compounds including nutrients, cellular metabolites, environmental toxins, drugs and other xenobiotics. The ATP-binding cassette (ABC) and solute carrier (SLC) gene families encode hundreds of transporters including some that play a central role in drug disposition and that may perpetrate adverse drug-drug interactions (DDIs) (1-4). An example of the latter is seen when co-administration of a cholesterol lowering statin drug with the immunosuppressant cyclosporin A results in increased systemic statin exposure that causes muscle and/or renal toxicity. Cyclosporin inhibition of statin uptake by the organic anion transporting polypeptides OATP1B1 and -1B3 is thought to interfere with its elimination and thus represent the main mechanism for this DDI (5, 6).
OATP1B1 and -1B3 are uptake transporters of the SLC family that are expressed in the liver in the sinusoidal membranes of hepatocytes. They share an overlapping but not identical spectrum of substrates for transport including statin drugs, thyroid hormones, peptides and bile acids (1, 2, 7). Because of their broad substrate spectrum, prominent role in drug disposition and excretion, and implication as DDI perpetrators, OATP1B1 and -1B3 are routinely screened against new drug entities (NDEs) for their potential as substrates or inhibitors of these transporters. Consequently, guidance from United States and European drug regulatory agencies recommends performing in vitro OATP1B1 and -1B3 assays for this purpose (8, 9).
One type of in vitro assay employs cultured cells that express OATP1B1 or -1B3 and a known substrate that is used as a probe. Assay conditions optimized for the uptake of a single probe are used to screen numerous NDEs. An NDE that inhibits probe uptake is flagged as an inhibitor or competitive substrate and the implications for downstream development are considered (1, 10). For simplicity, a recombinant transporter can be overexpressed in a cell line with little or no endogenous transporter and compared to parent cells lacking transporter overexpression. In this way, transporter effects are unambiguously assigned. Typically, the probe is incubated with cells for a defined time at 37 °C and then cells are chilled to stop uptake and minimize probe efflux. Cells are then washed to remove extracellular probe and a cell lysate is prepared for analysis to determine the extent of probe uptake in the presence or absence of test compound (11-13). The analysis method depends on the nature of the probe: radiometric or fluorometric analysis for radiolabeled or fluorescent probes, respectively, or mass spectrometry analysis for nearly any probe molecule. Each of these approaches with their pros and cons requires multiple steps that consume time, limit throughput and carry the accumulated error liability associated with any multistep process.
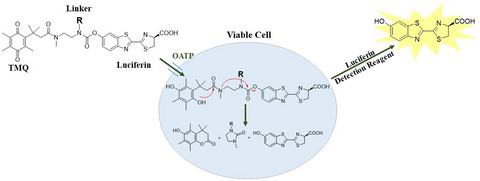
To obviate the limitations of multistep transporter assays, we leveraged the properties of trimethyl lock quinone (TMQ) linker chemistry to create probes that enable a no-wash, add-and-read assay. While TMQ can be covalently linked to a probe to quench its optical properties, it is labile to the intracellular reducing environment. Upon entering a viable cell, the reduction of TMQ followed by intramolecular lactonization releases free luciferin. The light output from the reaction of luciferin and luciferase can be correlated to the amount of parent probe that entered viable cells. Such luciferase-coupled systems for bioluminescent assays often provide low background and high sensitivity (14).
In a previous study, we used a tripartite design that combined a TMQ linker with a transporter targeting moiety and a luciferin leaving group that was detected as light output from a luciferin-limited luciferase reaction (15). This is a scalable approach since a targeting moiety can be selected from the list of all known substrates of any uptake transporter of interest. However, the recognition that D-luciferin itself is a substrate for rat Oatp1 and human OATP1B1 and -1B3 suggested a simplified probe design for at least OATP transporters, where a D-luciferin moiety would serve as both targeting moiety and optical leaving group (16, 17). We hypothesized that this type of simplified probe would enable an effective transporter-dependent uptake of probe, potentially result in a highly sensitive and rapid homogeneous approach to detecting and characterizing OATP/NDE interactions, and thereby address some current transporter assay limitations. Here, we describe the tuning of TMQ-luciferin derivatives for low passive permeability, effective transporter-dependent uptake, and sensitivity to transporter-selective inhibitors, to enable no-wash, add-only OATP1B1 and -1B3 screening assays.
MATERIALS AND METHODS TMQ-conjugated D-Luciferin derivativesTMQ-conjugated luminogenic D-luciferin derivatives were synthesized similar to the method we described in our previous publication (15), and synthetic details are included in the Supporting Information. CNBT and TMQ carboxylic acid were provided by Promega Biosciences, Inc. NH2-(PEG)xCOO-t-Bu was purchased from Combi-Blocks Inc., San Diego, CA and (N-methyl)-N-Boc acetaldehyde was purchased from Beijing Advanced Technology Co. Ltd., China. All other reagents and solvents for chemical syntheses were purchased from Aldrich, Sigma, and Fisher and were used without further purification. Nuclear magnetic resonance (NMR) was recorded on a Vivan-300 and Bruker Advance II 400 MHz Spectrometer. Mass spectra was recorded by Waters LC-MS instrument with Waters 2695 Separation Module/3100 Mass Detector. Waters Preparation HPLC (Waters 2487 Series) was used to purify the products by using 0.1% formic acid and acetonitrile or methanol as eluents. The purity and free luciferin analyses were performed on an Analytical HPLC (Agilent 1100 Series) by monitoring absorbance at 254 and 330 nm, and fluorescence at 530 nm. HRMS mass spectra for final compounds were obtained from Sciex TripleTOF® 5600+.
Cell cultureHEK293 cells were obtained from ATCC (ATCC CRL-1573) and cultured in Dulbecco’s Modified Eagle’s Medium (DMEM) with 10% fetal bovine serum. Cryopreserved OATP1B1*1a, OATP1B3 and Control TransportoCells™ were obtained from Corning Life Sciences (Corning, NY). These are HEK293 cells transiently transfected with cDNA vectors for overexpression of OATP1B1*1a or OATP1B3 (OATP1B1 and OATP1B3 Cells), or with the empty expression vector (Control Cells), and they were cultured according to the manufacturer’s instructions. Briefly, cells were thawed and cultured in Dulbecco’s Modified Eagle’s Medium (DMEM) supplemented with MEM non-essential amino acids, 10% fetal bovine serum and 2 mm sodium butyrate. 100 000 viable cells per well were applied to 96-well plates and placed in a 37 °C CO2 incubator for 24 h prior to performing transporter assays. All assays were performed in BioCoat™ Poly-D-Lysine 96-well white-walled, clear-bottom plates (Corning Life Sciences, Corning, NY). Note that the SLCO1B1*1a gene encoding OATP1B1*1a is designated as wild type for this highly polymorphic locus (18). For simplicity throughout this manuscript, we refer to it as OATP1B1.
OATP1B1 and OATP1B3 transduction by BacMamOATP1B1 and OATP1B3 cDNAs were prepared in plasmid vectors and sequence verified. The plasmid cDNAs were transferred to BacMam vectors and viral suspensions, including an empty vector control, were prepared by Kemp Proteins LLC (Frederick, MD). To facilitate transient transporter expression via viral transduction as previously described (19), 100 µL per well of a mixture containing 50 000 HEK293 cells (ATCC CRL-1573) per 100 µL in DMEM/10% FBS and sufficient BacMam plaque forming units to achieve a desired multiplicity of infection (MOI) was added to 96-well plates at 100 µL/well and incubated for 24 h in a 37 °C CO2 incubator. Transporter assays were performed as described above for TransportoCells™.
Uptake activity assaysAfter removing medium from 96-well plates, cells were rinsed twice with Hank’s Balanced Salt Solution (HBSS) with Ca2+ and Mg2+ (Corning, Corning, NY) before performing assays.
Transport assay with D-luciferinA serial dilution of D-Luciferin (Promega, Madison, WI) was prepared at 50× in water before diluting to 1X (0.3125–40 µm) in HBSS. 50 µL/well was applied to OATP1B1, OATP1B3 and Control Cells. The plate was placed in a 37 °C CO2 incubator for 30 min and then placed on ice where the HBSS D-luciferin solutions were aspirated and cells were washed twice with cold HBSS. 50 µL of a lytic formulation containing a luciferase enzyme and ATP but no D-luciferin (Luciferin Detection Reagent (LDR), Promega Corp., Madison, WI) was added to each well and plates were moved to room temperature (˜22 °C) for 20 min. (While LDR produces a stable glow-style signal (e.g., t1/2 > 2 h), the luciferase reaction rate is temperature dependent and normalization to room temperature provides for added signal stability.) Luminescence was then recorded on a plate reading luminometer (GloMax®, Promega Corp., Madison, WI) (Fig. 1).

No-wash uptake transporter assay scheme: Uptake transporter probes consisting of a TMQ moiety (A), and a D-luciferin moiety (B) are applied to intact live cells that express a probe-selective transporter(s). R is varied to tune physical properties of the probe. Exposure to the intracellular reducing environment after probe uptake results in TMQ reduction, intramolecular lactonization, and release of free D-luciferin that is detected in a light-generating reaction with luciferase. Since D-luciferin production depends on cellular uptake, luminescent magnitude correlates to transporter activity.
Transport assays with TMQ-conjugated D-luciferin derivatives10 mm acetonitrile solutions of Compounds 1 to 7 (Fig. 2) were used to create 250× serial dilutions in acetonitrile, which were further diluted to 1X in HBSS. 50 µL/well was applied to OATP1B1, OATP1B3 and Control Cells. Plates were placed in a 37 °C CO2 incubator for 30 min and then 50 µL of LDR was added to each well at room temperature (˜22 °C). After 20 min at room temperature, luminescence was recorded.

D-luciferin uptake: OATP1B1, -1B3 and Control Cells are HEK293 cells that were transfected for overexpression of the respective transporters or with an empty expression vector (TransportoCells™). No Cell Controls are empty wells treated in parallel to provide a measure of the detection chemistry’s intrinsic background. After 30-minute exposures to D-luciferin, cells were chilled on ice and washed with cold buffer, a lytic luciferase reaction mixture was added, and the amount of D-luciferin taken up was measured as bioluminescent signals that were quantitated against a D-luciferin standard curve.
Concentration and time course analysisCompounds 3 to 7 were prepared and applied to cells as described in the previous section. Applications were staggered to achieve 5-, 10-, 20- and 30-min compound exposures before a common stopping point. Incubations were at 37 °C in a CO2 incubator for the respective times and then 50 µL of LDR was added to wells to create a lysate, terminate potential probe uptake and processing, and initiate luminescent reactions dependent on the amount of D-luciferin formed. After an additional 20 min at room temperature, luminescence was recorded.
Standard curvesStandard curves were used to convert luminescence values from uptake assays to uptake rates. D-luciferin standards (ranging from 0.3125 µm up to 40 µm) consisting of 50 µL D-luciferin in HBSS were added to wells with no cells at the same time uptake probes were added to cell-based wells and 50 µL LDR per well was added at the end of the cell-based incubations. Uptake rates were calculated after converting light values from cell-based wells to luciferin concentrations by way of standard curve interpolation. All curve fits, standard curve interpolations and kinetic parameter derivations were performed using GraphPad Prism version 8.4.0 (GraphPad Software, La Jolla, CA).
Inhibition assaysCompounds 3 to 7 were dissolved to 0.5 mm in acetonitrile and then diluted to 0.5 µm in HBSS. Cyclosporin A, rifampicin and ritonavir (Sigma-Aldrich) were dissolved respectively to 10, 20 and 20 mm in DMSO. 1000× serial dilutions in DMSO were then prepared and diluted to 1× in HBSS containing one or another of 0.5 µm compounds 3–7. 50 µL of each solution was added to OATP1B1, OATP1B3 or Control Cells in 96-well plates that were then placed in a 37 °C CO2 incubator for 30 min. 50 µL of LDR was then added to each well and 20 min later luminescence was recorded. D-luciferin standard curves were included in these plates for converting luminescent values to net transport rates.
RESULTSThe objective of the present study was to develop no-wash add-only assays for detecting inhibitors or substrates acting as competitive inhibitors of OATP1B1 and -1B3 transport activity, and in this way enable a higher throughput approach. The assays would rely on derivatives of the OATP substrate D-luciferin (16, 17). To confirm that human OATP1B1 and -1B3 transport D-luciferin and establish a model system for testing luciferin derivatives as uptake probes, we applied D-luciferin to human embryonal kidney cells (HEK293) with or without ectopic overexpression of recombinant human OATP1B1 or -1B3 (OATP1B1, OATP1B3 or Control cells). The cells were then washed to remove extracellular luciferin and chilled on ice to slow or prevent intracellular luciferin efflux. The sequestered luciferin was then detected by applying Luciferin Detection Reagent (LDR), a luciferin-free lytic reagent containing a stabilized firefly luciferase mutant and ATP (Fig. 2).
Luciferin uptake by cells lacking recombinant OATP expression was negligible in that signals from those wells were similar to cell-free wells. In contrast, significant amounts of luciferin were captured by cells expressing OATP1B1 or -1B3. The different uptake rates between OATP1B1 and -1B3 cells may be due to intrinsically different transport rates, different transporter expression levels, or a combination of these two mechanisms. Nevertheless, the approach confirmed OATP-dependent luciferin uptake in this HEK293 cell model.
To enable a homogeneous assay, we synthesized luminogenic D-luciferin derivatives with various trimethyl lock quinone linkers (TMQ) (Fig. 3). An important object was tuning the TMQ linker to minimize passive permeability and thereby restrict uptake to a transporter-dependent process.

TMQ-luciferin derivatives.
The assay scheme anticipated that (i) TMQ conjugation renders the luciferin moiety inactive for light production by luciferase, (ii) TMQ-luciferins are stable in cell culture medium, and (iii) reduction of TMQ upon entering live cells results in rapid traceless D-luciferin release (14, 15). Compounds 1-7 were applied in HBSS to OATP1B1, -1B3 or Control Cells at a range of concentrations for up to 30 min. Luciferin release was then measured by directly applying LDR (Fig. 4).

Cellular uptake of TMQ-luciferin derivatives. OATP1B1, -1B3 and Control Cells, and empty wells were exposed to compounds 1-7 for 30 min. A lytic luciferase reaction mixture was then added to stop uptake and initiate a luciferin-luciferase reaction that produced light in proportion to the amount of D-luciferin present. The D-luciferin quantities produced by cells after probe uptake were determined by interpolation from a luminescent D-luciferin standard curve produced with the same luciferase reaction mixture.
While some of the compounds were apparently taken up and processed to luciferin by control cells, all compounds were taken up by OATP1B1 and -1B3 cells. Compound 1 uptake was significant but largely OATP1B1 and -1B3 independent because there was little difference between control and OATP cells, suggesting uptake by an endogenous transporter or by a largely passive mechanism. Compound 2 showed both OATP1B1 and -1B3 dependent and independent uptake in that a significant level of control cell uptake was observed but enhanced in OATP cells. Because of their OATP-independent uptake, we did not study compounds 1 and 2 in any more detail. However, uptake of compounds 3-7 was largely OATP1B1 and -1B3 dependent because control cells showed negligible luciferin production in contrast to significant production by the OATP cells, so these compounds were studied in more detail.
Compounds 3-7 showed saturable dose-dependent uptake with characteristic apparent Km and Vmax values (Fig. 5, Figure S1, Table 1). Time-dependent uptake was linear up to 30 min, though significant assay windows were produced with each compound and transporter in as little as 5 min.
 Time and dose-dependent TMQ-luciferin uptake: Exposure of OATP1B1 and -1B3 Cells to compound 3 for varying lengths of time is shown as a representative example (see Figure S1 for compounds 4–7). Uptake was measured as described for Fig. 4. While panels A and B show dose response curves after different lengths of time, the same data was replotted in panels C and D as a function of time at different doses. Michaelis–Menten curve fits (A and B) and linear regressions (C and D) were performed using GraphPad Prism version 8.4.0 (see Figure S2 for compounds 4–7).
Table 1.
Apparent Km (micromolar) and Vmax (picomoles/minute/well) values for compounds 3–7 applied to OATP1B1 and -1B3 TransportoCells™
Compounds
3
4
5
6
7
OATP1B1
Time and dose-dependent TMQ-luciferin uptake: Exposure of OATP1B1 and -1B3 Cells to compound 3 for varying lengths of time is shown as a representative example (see Figure S1 for compounds 4–7). Uptake was measured as described for Fig. 4. While panels A and B show dose response curves after different lengths of time, the same data was replotted in panels C and D as a function of time at different doses. Michaelis–Menten curve fits (A and B) and linear regressions (C and D) were performed using GraphPad Prism version 8.4.0 (see Figure S2 for compounds 4–7).
Table 1.
Apparent Km (micromolar) and Vmax (picomoles/minute/well) values for compounds 3–7 applied to OATP1B1 and -1B3 TransportoCells™
Compounds
3
4
5
6
7
OATP1B1
K m
µm
V max
pmol/min/well
K m
µm
V max
pmol/min/well
K m
µm
V max
pmol/min/well
K m
µm
V max
pmol/min/well
K m
µm
V max
pmol/min/well
5 min 7.8 ± 0.3 9.9 ± 0.1 8.6 ± 0.4 10.7 ± 0.2 4.6 ± 0.3 7.6 ± 0.2 1.2 ± 0.1 8.1 ± 0.2 2.5 ± 0.2 4.9 ± 0.1 10 min 9.6 ± 0.3 8.8 ± 0.1 9.7 ± 0.5 8.7 ± 0.2 4.5 ± 0.3 6.2 ± 0.1 1.6 ± 0.2 7.8 ± 0.2 2.2 ± 0.1 3.3 ± 0.0 20 min 12.3 ± 0.7 8.1 ± 0.2 12.3 ± 0.6 8.2 ± 0.2 6.9 ± 0.4 5.8 ± 0.1 2.6 ± 0.2 7.8 ± 0.2 2.4 ± 0.1 2.8 ± 0.0 30 min 11.8 ± 1.2 7.2 ± 0.3 12.1 ± 0.8 8.0 ± 0.2 7.0 ± 0.6 5.5 ± 0.2 3.3 ± 0.4 9.0 ± 0.3 2.4 ± 0.2 2.7 ± 0.0 Average 10.4 ± 0.6 8.5 ± 0.2 10.7 ± 0.6 8.9 ± 0.2 5.8 ± 0.4 6.3 ± 0.2 2.2 ± 0.2 8.2 ± 0.2 2.4 ± 0.2 3.4 ± 0.1 OATP1B3 5 min 4.5 ± 0.6 5.4 ± 0.2 5.8 ± 1.1 3.9 ± 0.2 3.3 ± 0.6 2.0 ± 0.1 1.2 ± 0.1 7.3 ± 0.2 3.2 ± 0.2 5.3 ± 0.1 10 min 5.3 ± 0.5 4.5 ± 0.1 5.9 ± 0.7 3.3 ± 0.1 2.2 ± 0.2 1.8 ± 0.0 1.5 ± 0.2 7.1 ± 0.3 2.6 ± 0.1 3.5 ± 0.0 20 min 7.4 ± 0.6 4.5 ± 0.1 6.2 ± 0.8 3.0 ± 0.1 3.0 ± 0.2 2.0 ± 0.0 2.0 ± 0.3 7.1 ± 0.3 2.5 ± 0.2 3.0 ± 0.1 30 min 8.8 ± 0.8 4.8 ± 0.2 6.2 ± 1.1 3.1 ± 0.2 2.8 ± 0.3 2.2 ± 0.1 2.7 ± 0.5 8.2 ± 0.4 2.4 ± 0.3 2.8 ± 0.1 Average 6.5 ± 0.6 4.8 ± 0.2 6.0 ± 0.9 3.3 ± 0.2 2.8 ± 0.3 2.0 ± 0.1 1.9 ± 0.3 7.4 ± 0.3 2.7 ± 0.2 3.7 ± 0.1 Values derived from data shown in Fig. 5 and Figure S1. Curves were fit to the Michaelis–Menten equation and values with standard errors were calculated using GraphPad Prism version 8.4.0.To determine whether our luminogenic transporter assays would be useful for detecting transporter inhibition, we applied the OATP1B1 and -1B3 inhibitors cyclosporin A, rifampicin or ritonavir (2) and the probe substrates at 0.5 µm to OATP1B1, -1B3 and Control Cells. Uptake of compounds 3-7 by both transporters was inhibited by each inhibitor as indicated by dose-dependent decreases in D-luciferin production (Fig. 6, Table 2, and Figure S3 provided in the Supporting Information).
 Dose-dependent inhibition of TMQ-luciferin uptake: cyclosporin A, ritonavir or rifampicin were applied to wells containing OATP1B1 or -1B3 cells and 0.5 µm compound 3 as a representative example of using a TMQ-luciferin probe for measuring uptake transport inhibition (see Figure S2 for data from the same inhibitors against compound 4-7 assays). Data was fit to a four-parameter equation with variable slope and IC50 values (micromolar) shown next to the respective curves were calculated using GraphPad Prism version 8.4.0. Probe plus inhibitor exposure time was 30 min, and uptake was measured as described for Fig. 4.
Table 2.
Inhibition of TMQ-luciferin uptake by OATP1B1 and -1B3: IC50 values (micromolar) are shown for cyclosporin A, ritonavir and rifampicin inhibition of compound 3–7 uptake (0.5 mm) by OATP1B1 or -1B3 cells
Compounds
Dose-dependent inhibition of TMQ-luciferin uptake: cyclosporin A, ritonavir or rifampicin were applied to wells containing OATP1B1 or -1B3 cells and 0.5 µm compound 3 as a representative example of using a TMQ-luciferin probe for measuring uptake transport inhibition (see Figure S2 for data from the same inhibitors against compound 4-7 assays). Data was fit to a four-parameter equation with variable slope and IC50 values (micromolar) shown next to the respective curves were calculated using GraphPad Prism version 8.4.0. Probe plus inhibitor exposure time was 30 min, and uptake was measured as described for Fig. 4.
Table 2.
Inhibition of TMQ-luciferin uptake by OATP1B1 and -1B3: IC50 values (micromolar) are shown for cyclosporin A, ritonavir and rifampicin inhibition of compound 3–7 uptake (0.5 mm) by OATP1B1 or -1B3 cells
Compounds
3
IC50s(µm)
4
IC50s(µm)
5
IC50s(µm)
6
IC50s (µm)
7
IC50s(µm)
OATP 1B1 1B3 1B1 1B3 1B1 1B3 1B1 1B3 1B1 1B3 Cyclosporine A 2.0 2.5 1.7 2.4 1.9 2.8 ˜2.5 ˜4.5 5.4 7.6 Ritonavir 5.4 6.9 3.8 6.5 4.3 8.0 13.2 NC ˜9.3 ˜12.9 Rifampicin 5.5 9.5 3.5 8.2 5.4 12.5 ˜9.4 ˜17.0 ˜9.6 ˜18.6 Values were derived from data shown in Fig. 6 and Figure S3. Curves were fit to a four-parameter equation with variable slope and IC50s were calculated using GraphPad Prism version 8.4.0., except where a full range of inhibition was not observed, in which cases estimated values (˜) are given.To further explore substrate transporter selectivity, compound 3 was chosen as a representative probe to screen against a small panel of HEK293-overexpressed anion uptake transporters including OATP2B1, OAT1 and OAT2 in addition to OATP1B1 and -1B3. From that panel only OATP1B1 and -1B3 showed substantial probe uptake (Fig. 7).
 Uptake transporter selectivity for TMQ-luciferin: Compound 3 as a representative probe was applied to OATP1B1, -1B3, and −2B1; OAT1 and −3, and Control TransportoCells™, and wells without cells (no cell control). Exposure time was 30 min. Uptake was measured as described for Fig. 4 and expressed as Relative Light Units
As an alternative to the commercially sourced cryopreserved HEK293 cells with transient transporter overexpression used for the work reported so far (TransportoCells™), we explored using BacMam particles for transient OATP overexpression. This provided for control over transporter expression level and represented a potential cost reduction measure. A day after mixing OATP1B1, OATP1B3 or control (empty vector) BacMam particles with HEK293 cells we observed enhanced OATP-dependent uptake using compound 6 as a representative probe (Fig. 8). Uptake showed saturable kinetics and maximal uptake rates dependent on BacMam MOI (Table 3).
 Viral transduced transporter expression and detection: HEK293 cells were mixed with BacMam particles encoding OATP1B1, -1B3 or empty vector control at the indicated MOI and dispensed at 50 000 cells per well of 96-well plates. 24 h later compound 6 as a representative probe was applied to each well. Probe exposure time was 30 min. Uptake was measured as described for Fig. 4. Means (n = 3) ± SD are shown, though error bars are not always visible due to the closeness of the replicates.
Table 3.
Apparent Km (micromolar) and Vmax (picomoles/minute/well) values for compounds 3-7 applied to HEK293 with BacMam transduced OATP1B1 or -1B3 overexpression: values were derived from data shown in Fig. where data was fit to the Michaelis–Menten equation and values with standard errors were calculated using GraphPad Prism version 8.4.0
MOI
Km (µm)
Vmax (pmol/min/well)
100
1.39 ± 0.08
1.532 ± 0.028
50
0.63 ± 0.07
0.575 ± 0.015
25
0.38 ± 0.05
0.194 ± 0.004
10
0.27 ± 0.05
0.055 ± 0.001
5
0.34 ± 0.08
0.021 ± 0.001
2
0.29 ± 0.15
0.006 ± 0.001
Viral transduced transporter expression and detection: HEK293 cells were mixed with BacMam particles encoding OATP1B1, -1B3 or empty vector control at the indicated MOI and dispensed at 50 000 cells per well of 96-well plates. 24 h later compound 6 as a representative probe was applied to each well. Probe exposure time was 30 min. Uptake was measured as described for Fig. 4. Means (n = 3) ± SD are shown, though error bars are not always visible due to the closeness of the replicates.
Table 3.
Apparent Km (micromolar) and Vmax (picomoles/minute/well) values for compounds 3-7 applied to HEK293 with BacMam transduced OATP1B1 or -1B3 overexpression: values were derived from data shown in Fig. where data was fit to the Michaelis–Menten equation and values with standard errors were calculated using GraphPad Prism version 8.4.0
MOI
Km (µm)
Vmax (pmol/min/well)
100
1.39 ± 0.08
1.532 ± 0.028
50
0.63 ± 0.07
0.575 ± 0.015
25
0.38 ± 0.05
0.194 ± 0.004
10
0.27 ± 0.05
0.055 ± 0.001
5
0.34 ± 0.08
0.021 ± 0.001
2
0.29 ± 0.15
0.006 ± 0.001
Transport rates increased with increasing MOI and apparent Km values at 2, 5, 10 and 25 MOI were about the same as expected if substrate is not limiting to uptake rate. However, at 50 and 100 MOI the apparent Km values increased and values over the full MOI range were substantially lower than those measured with TransportoCells™. Implications of these observations will be discussed.
DISCUSSIONHere we demonstrated the utility of TMQ-luciferin derivatives as probe substrates for a no-wash, add-only assay scheme for screening NDEs against OATP1B1 and -1B3. By eliminating multiple steps required of conventional uptake transporter assays, our approach saves time, enables higher throughput, and would in principle reduce stepwise error accumulation. Our data is consistent with an understanding that D-luciferin is a substrate for OATP1B1 and -1B3 (16, 17), TMQ derivatization blocks its activity with luciferase but does not generally prevent uptake, that free D-luciferin is rapidly released from TMQ in the intracellular compartment of living cells, and it can be detected in a luciferin-luciferase reaction (14). The latter two points made it necessary to design probes with negligible transporter-independent uptake. For example, a sufficiently hydrophobic probe that diffuses passively through the plasma membrane would release free D-luciferin inside the cell and create positive signals without the aid of an uptake transporter. While transporter-independent D-luciferin uptake was negligible (Fig. 2), compounds 1 and 2 did show significant transporter-independent uptake, with compound 1 showing little evidence of significant transporter-mediated uptake. Since SLC transporter protein levels are known to be low or absent in the HEK293 cells used in this study (10) we suspected passive permeability as the main mechanism for compound 1 and 2 uptake in cells without recombinant OATP overexpression. This was likely aided by the hydrophobic character of the methyl or straight chain alkane R group on the TMQ moiety of these molecules. Therefore, more hydrophilic R groups comprised of various combi
留言 (0)