
記住我
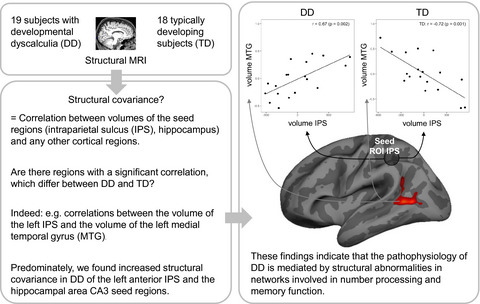


Developmental dyscalculia characterizes a severe deficit in processing numerical and mathematical information. Our study indicates that developmental dyscalculia might be mediated by abnormalities in the communication between specific brain regions. This alteration was seen as group difference (i.e., compared to typically developing children) of inter-regional correlations of gray matter volume.
1 INTRODUCTIONThe term “developmental dyscalculia” (DD) was first introduced in 1968 (Cohn, 1968) to describe a learning disability in basic numerical and mathematical operations, such as addition or subtraction deficits. Similar to dyslexia, DD affects about 3%–6% of the population (Badian, 1999; Gross-Tsur et al., 1996; Kosc, 1974), and recent findings suggest that slightly more females are affected than males (Fischbach et al., 2013; Schulz et al., 2018). Individuals with DD cannot master mathematics despite normal cognitive abilities in other domains. Children with DD also show a persistent inability to commit basic arithmetic information to long-term memory, to understand, or access magnitudes associated with number words and Arabic numerals, as well as a delay in the learning of arithmetical procedures (Butterworth et al., 2011; Geary, 1993; Jordan et al., 2003; Mazzocco et al., 2011; Rousselle & Noel, 2007). Several behavioral and neuroimaging studies examined children with DD relative to typically developing (TD) children to identify the role of confounding behavioral factors and underlying neuronal substrates associated with DD. Behavioral studies predominantly focused on tasks involving arithmetic problems and showed that children with DD rely more on counting strategies relative to TD (Geary, 2004). It is also known that people with dyscalculia often retain some residual numerical abilities. For example, in a study by Cappelletti and Price (2014) it was shown that participants accurately performed semantic and categorical color-decision tasks with numerical and non-numerical stimuli, with adults with dyscalculia performing slower than controls in the number semantic tasks only (Cappelletti & Price, 2014). MRI studies revealed that DD showed reduced gray matter (GM) volume, particularly in the inferior and superior parietal cortex as well as in the fusiform gyrus, parahippocampal gyrus, anterior temporal cortex, and frontal cortex (Cappelletti & Price, 2014; Ranpura et al., 2013; Rotzer et al., 2008; Rykhlevskaia et al., 2009). For example, the study by Ranpura et al. (2013) demonstrated abnormal GM morphometry (cortical surface area, thickness, and volume) between 11 children and adolescents with DD compared to 11 matched controls (Ranpura et al., 2013). In addition, Rotzer and colleagues used optimized (related to spatial segmentation and normalization procedures) voxel-based morphometry (VBM) and reported lower GM volume in DD in the intraparietal sulcus (IPS), anterior cingulate cortex (ACC), inferior- and middle frontal gyri but also a reduction of white matter (WM) in the hippocampus (HC) and frontal lobe (Rotzer et al., 2008). The link between IPS abnormalities and DD was also demonstrated in a single-case study, revealing that a severe head injury, including a right parietal skull fracture and right temporal hemorrhage, can lead to the presence of dyscalculia and dyslexia despite normal intellectual functioning (Levin et al., 1996). In addition, Molko and colleagues (2003) demonstrated an abnormal length, depth, and sulcal geometry of the right IPS, in Turner syndrome, a genetic disorder associated with math learning problems (Molko et al., 2003). Brain regions are linked and communicate by a complicated network formed by short fiber connections among different cortical and subcortical regions. Successful cognitive performance relies on the development and establishment of such well-organized connections in the brain. The evidence to date provides additional support that DD may be also attributable to altered connection between areas important for number processing. Results highlighted a deficit of the superior longitudinal fasciculus, a fiber tract that connects parietal, frontal, and temporal areas. In particular, the superior longitudinal fasciculus seemed to be affected in parts that are adjacent to key areas for number processing, namely the intraparietal sulcus (Kucian et al., 2013). Rykhlevskaia et al. (2009) reported long-range white matter projection fibers linking the right fusiform gyrus with temporo-parietal white matter as a specific source of vulnerability in children with DD (Rykhlevskaia et al., 2009). Functional MRI studies in children demonstrate altered fMRI signal responses in fronto-parietal regions during arithmetic tasks (Ashkenazi et al., 2012; Berteletti et al., 2014; Dinkel et al., 2013; Kaufmann et al., 2009, 2011; Kucian et al., 2006, 2011; Molko et al., 2003; Morocz et al., 2012; Mussolin et al., 2010). Recently, it could be demonstrated that children (Rosenberg-Lee et al., 2015) and adults with DD (Bulthe et al., 2018) show functional hyperconnectivity compared to controls. This neuro-functional impairment could be normalized after behavioral training (Iuculano et al., 2015; Michels et al., 2018). In fact, the IPS was hyperconnected before intervention to parietal, frontal, visual, and temporal brain regions, including the HC. This result indicates that DD is related to alterations in brain regions associated with short-term as well as long-term memory. In addition, amygdala fMRI responses (and math fear) can be normalized through cognitive tutoring (Supekar et al., 2015). In summary, these findings suggest that people with DD demonstrate functional and structural deficits in the core region for number processing in the parietal lobe, which might be seen as a direct neuronal correlate of math difficulties (for review see Kucian, 2016).
Structural covariance network (SCN) analysis allows the examination of brain networks arising from inter-regional correlations of anatomical measurements, for example GM volume. There is evidence that structural covariance (SC) partially reflects structural connectivity (Gong et al., 2012). Yet, also, functional networks are partially indicated by SC (Alexander-Bloch, Giedd, et al., 2013). Thus, information about connectivity patterns gained by SC is distinct from what can be yielded by investigations on structural connectivity or functional connectivity alone (Gong et al., 2012). A crucial advantage of investigations on SCN is the fact that functional networks can be detected even if they are not activated during data acquisition (Fornito et al., 2012), because SC can detect the structural imprint left by the functional networks' repeatedly synchronized activity. Age is a significant moderator of both anatomical (Collin & van den Heuvel, 2013; Hagmann et al., 2010) as well as functional (Chan et al., 2014; Dosenbach et al., 2010) connectivity. Some of the most extensive age effects occur in GM (Giorgio et al., 2010) and it is evident that GM organization undergoes significant structural change with age (DuPre & Spreng, 2017), including synaptic proliferation, pruning, and eventual atrophy (Fjell et al., 2010; Low & Cheng, 2006). Normative GM changes do not occur simultaneously, however, and show variation across cortex (Krongold et al., 2017; Raz et al., 2005), yielding significant differences in age-related trajectories across SCN. There has therefore been substantial interest in the impacts of age on SCN, and how these age-related trajectories may differ across neurocognitive networks. Investigations of SC trajectories have largely focused on specific developmental periods, including childhood and adolescence (Zielinski et al., 2010) or aging (Montembeault et al., 2012). These studies have suggested the occurrence of increasing long-range SC across early development (Zielinski et al., 2010) and amplified local covariance with advancing age (Montembeault et al., 2012). Importantly, examining SCN in isolated developmental periods may limit our understanding of the normative life cycle of each of these networks (DuPre & Spreng, 2017; Zuo et al., 2017). Initial work examining trajectories over multiple developmental periods has found significant internetwork variation (Hafkemeijer et al., 2014). Current findings from neuroscience clearly illustrate that number processing and calculation require the integration of different co-activated brain networks (Arsalidou & Taylor, 2011; Dehaene et al., 2004). Because basic number processing and calculation depend on a large-scale network that includes different and widespread brain areas, deficits in brain function, brain structure, interconnections, or metabolism have been reported across almost the entire network as outlined above. Moreover, SCN analyses offer the unique opportunity to analyze alterations of brain networks arising from inter-regional correlations of anatomical measurements, which are independent of actual brain activation. To date, however, it is unclear whether local covariance differs in children with DD compared to TD. Findings will provide new insights in the neuronal underpinnings of DD and go beyond the mere localization of abnormalities, but will offer information on (structural) correlations between brain regions and how such networks differ between children with and without DD.
Based on previous functional imaging studies (Iuculano et al., 2015; Michels et al., 2018), we hypothesized that DD will show abnormally high SC originating areas involved in number processing and memory, that is, the IPS and HC.
2 METHODS 2.1 ParticipantsParticipants were chosen from a former study including 20 TD and 23 DD children (Kucian et al. 2018). We selected a sub-sample of this original sample to carefully balance both groups for age by narrowing the age range within each group. In detail, we excluded all children above 15 years (one TD, two DD), plus the youngest of the TD group and the two oldest of the DD group. This resulted in a final sample of 18 TD (age range: 8.7–14.5 years, mean 11.1 years) and 19 DD children (age range: 9.4–14.3 years, mean 12 years). Accordingly, groups did not differ in age (p = 0.21, see Table 1). This sample size is similar to previously published studies of children with math learning disability or DD (Iuculano et al., 2015; Kaufmann et al., 2009; Kucian et al., 2011; Price et al., 2007; Rosenberg-Lee et al., 2015) but see below for a power analysis.
TABLE 1. Behavioral data of children with developmental dyscalculia (DD) and typically developing children (TD) Total DD TD Statistics All children Subjects (N) 37 19 18 – Age (years) Range 8.7–14.5 9.4–14.3 8.7–14.5 Mean (SD) 11.5 (2.0) 12.0 (1.7) 11.1 (2.2) 0.207U Gender (male/female) 8/29 4/15 4/14 1.000F Handedness (right/ambidextrous/left) 31/3/3 16/1/2 15/2/1 0.710L Number line performancea (%) mean (SD) 6.1 (2.5) 6.4 (2.9) 5.7 (2.0) 0.390 Additionb (%) median (IQR) 95 (7.5) 90 (15) 95 (15) 0.00009U Subtractionb (%) median (IQR) 85 (23.8) 75 (25) 95 (9.4) 0.00003U Arithmetic summary score (mean % of correctly solved addition and subtraction tasks) 85 (14.8) 77 (15.8) 95 (4.9) 0.00012 Intelligencec (IQ) median (IQR) 105 (16.9) 95.8 (10.8) 110.8 (7.2) 0.0002 U Working memoryd (total score) mean (SD) 5.4 (1.9) 5.2 (1.9) 5.7 (2.0) 0.380 Children < 12 years Subjects (N) 20 8 12 – Mathematical performancee (PR) median (IQR) 40 (51) 6 (6.0) 55 (37.3) 0.001U Arithmetical fluencyf (t) mean (SD) 47.2 (8.2) 41 (6.4) 51.9 (6.4) 0.002 Readingg (t) median (IQR) 48.5 (9.0) 43.0 (4.3) 50.5 (4.5) 0.018U Children > 12 years Subjects (N) 17 11 6 – Mathematical performancee (total score) mean (SD) 58.4 (14.9) 50 (11.2) 73.8 (3.8) 0.000 Magnitude comparisonh (t) median (IQR) 43 (9.0) 41 (8.0) 51 (7.8) 0.001U Reading childrenh (PR) mean (SD) 20.7 (20.0) 24.2 (24.5) 15 (7.6) 0.291 Notes Individual groups were first tested for normal distribution by the Kolmogorov–Smirnov test. For normal distributed data, mean, standard deviation (SD), and p values are indicated based on two-sample t tests. If in one or both groups the assumption of normality was violated, median and interquartile range (IQR) are listed and a Mann–Whitney U test was performed (indicated by U). For nominal data, the Fisher's exact test (indicated by F) was performed for gender and the likelihood ratio (indicated by L) for handedness. p = 0.000154 indicates bold values.All children underwent detailed neuropsychological testing and MRI measurement. Due to the wide age range, different age-appropriate behavioral tests had to be conducted to identify children with DD. Children with DD below the age of 12 years fulfilled all the diagnostic criteria for DD according to the Neuropsychological Test Battery for Number Processing and Calculation in Children for grades 1–4 (ZAREKI-R) (von Aster et al., 2006). Children with DD older than 12 years did all not achieve basic mathematical competencies of the fourth grade according to the standardized test battery Basic Diagnostic in Mathematics for grades 4–8 (BASIS-Math) and fulfil according to this test battery the clinical criteria for dyscalculia in line to the WHO definition (Moser Opitz et al., 2010). None of the participants had neurological or psychiatric disorders, was on medication, or met exclusion criteria for MRI such as braces. Demographic and cognitive measures of all volunteers are provided in Table 1. Ethics approval was obtained from the Cantonal ethics-commission Zurich based on guidelines from the World Medical Association's Declaration of Helsinki (WMA, http://www.wma.net/en/30publications/10policies/b3/). The parents of all participants gave written informed consent prior to the study.
2.2 Power analysisWe performed a power analysis. In particular, we applied a multiple regression power calculation, using an effect size (f2) of 0.4 (corresponding to a large effect size), a power of 80%, and an alpha error of 0.05. This analysis revealed that a sample size of n (total) = 38 is required to “claim” effects statistically robust. In our study, we included an n (total) = 37. Thus, we believe that any reported group differences on structural covariance are not spurious.
2.3 Cognitive assessment 2.3.1 Mathematical performanceTwo different age-appropriate test batteries were used to assess numerical and mathematical performance in children younger or older than 12 years, respectively: Numerical achievement in children younger than 12 years was assessed using the standardized Neuropsychological Test Battery for Number Processing and Calculation in Children (ZAREKI-R) (von Aster et al., 2006). This neuropsychological battery examines basic skills in calculation and arithmetic and aims to identify and characterize the profile of mathematical abilities in children with DD from the first to fourth grade level. It is composed of 11 subtests, such as reverse counting, subtraction, number reading, dictating, visual estimation of quantities, and digit span forward and backward. Criteria for DD were met if a child's performance in the ZAREKI-R was below the 10th percentile on average in three subtests or in the total reached percentile rank. Numerical abilities of children older than 12 years were assessed using the German test battery Basic Diagnosis in Mathematics Education for Grades 4–8 (BASIS-MATH 4–8) (Moser Opitz et al., 2010). The test battery measures different numerical abilities at three difficulty levels such as counting, arithmetic, decimal system, text problems, and part–whole relationships. The BASIS-MATH test battery is a criterion-referenced test conceptualized to identify children with deficits in basic mathematical concepts from grades 4 to 8. In accordance to the WHO definition of developmental dyscalculia, the mathematical performance is measured by the criterion “not reaching mastery of the basic mathematical concepts.” Criteria for DD are met if the performance falls under a total threshold score of 67 points (out of a total of 83 points), which indicates that mastery of basic mathematical concepts has not been reached. The BASIS-MATH is scaled according to the one-dimensional Rasch model (Rasch, 1980). The normative sample consists of 692 Swiss and German children from grades 4 to 8. The test has a high sensitivity (92%) and reliability (internal consistency Cronbach's alpha = 0.92).
2.3.2 Number line performanceThe spatial representation of numbers was measured by a paper-and-pencil number line task in children younger than 12 years a computerized version for children older than 12 years: Children below 12 years had to indicate with a pencil on a left-to-right oriented number line from 0 to 100 the location of 20 Arabic digits, results of 20 additions and 20 subtractions, or the estimated number of 10 different dot arrays. The error rate of the paper-and-pencil number line task was evaluated by measuring the distance in percent (% distance) relative to the position of the correct number for each trial. Mean percentage distance was then calculated over all trials (Arabic digits, additions, subtractions, dots), but only correctly calculated addition and subtraction problems were included. A detailed description of the task is described in a previous publication of our group (Kucian et al., 2011a). Children older than 12 years solved a computerized number line task 0–100 including 20 Arabic digits that had to be located on the number line by mouse click (Käser et al., 2013). Again, the mean distance between the correct and indicated location in percent was calculated.
2.3.3 ArithmeticAddition and Subtraction skills were measured in all children by the percentage of correctly solved addition or subtraction problems that had to be calculated in the number line task described above (Käser et al., 2013; Kucian et al., 2011a). Arithmetic fluency was additionally evaluated in children younger than 12 years using the addition, subtraction, multiplication, and division subtests of the “Heidelberger Rechentest (HRT)” (Haffner et al., 2005). In this test, a list of 40 addition/subtraction/multiplication/division tasks is presented to the child and he/she is asked to solve as many problems as possible within 2 min. Hence, in contrast to the assessment of addition and subtraction skills in the number line task, the present test puts children under time pressure. We also computed a summary score (mean % of correctly solved addition and subtraction tasks) for both groups.
2.3.4 Magnitude comparisonMagnitude comparison skills of children older than 12 years were assessed by the subtest Quantity Comparison of the standardized Cognitive Abilities Test (KFT 4–8+R) (Heller & Perleth, 2000). Adolescents had 10 min time to solve as many magnitude comparison problems as possible of increasing difficulty of totally 25 different trials. Always two magnitudes had to be compared and decided which is the larger or if both are equal. Trials include non-symbolic comparison of number of items (e.g., dots), non-symbolic and symbolic calculation problems, different unities (e.g., time, money, weight, and liters), surface areas, and fractions.
2.3.5 IntelligenceEstimated intelligence was measured by the mean of different subtest of the standardized test battery Wechsler Intelligence Scale for Children (WISC-IV) (Petermann & Petermann, 2007). Mean IQ of children younger than 12 years is based on four verbal (vocabulary, arithmetic, similarities, and digit span) and two performance subtests (picture arrangement and block design) of the WISC-IV. Mean IQ of children older than 12 years was assessed by the mean of the subtests similarities, block design, digit span, and matrix reasoning of the WISC-IV.
2.3.6 Working memorySpatial working memory was assessed by the Block Suppression Test (Beblo et al., 2004). This test is based on the CORSI-Block Tapping test (Schellig, 1997) and requires the subject to reproduce every second block in a given sequence of touched cubes on a wooden board as the examiner demonstrated. While the sequences gradually increase in length, the number of cubes last tapped in two consecutively correct sequences is defined as the maximum spatial working memory span.
2.3.7 Reading skillsReading skills were measured by standardized age-appropriate German reading tests. Reading in children younger than 12 years was assessed by the subtest reading of the test battery “Basisdiagnostik Umschriebener Entwicklungsstörungen im Grundschulalter” (BUEGA) (Esser et al., 2008). The subtest reading consists of two word lists (list 1 = 32 short words; list 2 = 24 longer words) that children had to read aloud while number of errors and time was measured and influenced the reached t-value. Reading performance in children older than 12 years was estimated by the reading task from the standardized Salzburg Reading and Orthography Test (SLRT-II) (Moll & Landerl, 2010), which assesses word and pseudo-word reading fluency of a 1-min-reading task. Because of lacking test norms in grades 7 and 8, values were obtained by interpolating the norms from the test manual (grade 6) and from Kronschnabel et al. (2013) (grade 9).
2.3.8 HandednessHandedness was determined by the Edinburgh Handedness Inventory (Oldfield, 1971).
2.4 Behavioral data analysisBehavioral data were analyzed by IBM SPSS Statistics 22 Version 2. The Kolmogorov–Smirnov test was used to assess normal distribution. For normal distributed data, mean and standard deviations are indicated and group differences were calculated by two-sample t tests. If in one or both groups the assumption of normality was violated, median and interquartile range (IQR) are listed and a Mann–Whitney U test was performed to compare groups. Nominal data input (gender, handedness) was compared between DD and TD by means of Fisher's exact test for gender, and by likelihood ratio for handedness.
2.5 MR data acquisitionMRI data were acquired on a 3T General Electric Discovery 750 Scanner (GE Medical Systems, USA) using an eight-channel head coil. Three-dimensional anatomical images of the entire brain were obtained parallel to the anterior–posterior commissure line with a T1-weighted structural image using a spoiled gradient echo sequence (3D SPGR). Imaging parameters: number of slices = 172, slice thickness = 1 mm, matrix size = 256 × 256, field of view = 256 mm, FA = 8°, TE = 3 ms (n = 20) or 5 ms (n = 17), TR = 10 ms (n = 20) or 11 ms (n = 17), scan duration = 3 min 52 s. Cushions were placed around participants’ heads to minimize head movement. Differences in TE and TR were due to a scanner software release upgrade, but these differences did not affect the image quality (see Results section).
2.6 MR data pre-processingAnatomical images were processed by FreeSurfer (v5.3.0, http://surfer.nmr.mgh.harvard.edu), running on a Linux operating system. Default settings were used to run the standard automated reconstruction pipeline “recon-all” (Dale et al., 1999; Fischl et al., 1999, 2002, 2004). Main steps of the pipeline include skull stripping (Segonne et al., 2004), affine registration with Talairach atlas (Talairach & Tournoux, 1988), signal intensity normalization (Sled et al., 1998), voxel-based GM and WM segmentation, volume calculation, inflation, and registration to a spherical surface atlas, allowing parcellation and labeling of subcortical (Fischl et al., 2002) and cortical regions (Destrieux et al., 2010). The quality of segmentation into GM and WM was visually inspected and corrected where necessary by the recommended instructions on the FreeSurfer Wiki webpage (https://surfer.nmr.mgh.harvard.edu/fswiki) using the integrated tool TKMEDIT. Manual correction was performed in three steps: (a) checking Talairach transformation, (b) GM corrections in the brain mask, and (c) WM corrections in the WM mask. Thus, before starting the “recon-all” pipeline, first Talairach alignment was adjusted. The second step included deletion of obvious non-gray matter classified as GM, for example, from a bad skull stripping, as well as, adding control points in the WM where WM was included into the GM mask. After these corrections, a part of the recon-all pipeline was rerun (autorecon2-cp). Third, obvious non-WM voxels classified as WM were deleted from the WM mask and lateral ventricles were filled where the automatic pipeline did not fill them entirely. Next, part of recon-all workflow was rerun (autorecon2-wm). The generated models of the cortical surfaces enable to calculate the cortical volume, that is, the product of the cortical thickness and the surface area, at each vertex of the whole cortex. “Vertex” denotes a “point” on the surface commonly used in 2D surface-based morphometry representing the smallest entity in this analysis, comparable to a “voxel” when applying a 3D voxel-based morphometric approach. The “volume of a vertex” is referring to the volume of the region around one vertex, specifically the product of the thickness and the surface surrounding this particular vertex (i.e., the area comprising one third of the area of all faces (triangles) meeting at this vertex) (Winkler et al., 2012).
2.7 Region of interest (ROI) analysisCorresponding to our hypothesis, we chose the left and right IPS and hippocampus as seed ROIs. Here we subdivided the IPS into an anterior and posterior ROI, allowing a locally specific analysis of the IPS. We performed this analysis also because it has been shown that the IPS is organizing visual spatial attention (Grefkes & Fink, 2005), which is known to be disturbed in DD (Bugden & Ansari, 2016; Szucs et al., 2013). Furthermore, the IPS consists of different sub-regions (Choi et al., 2006; Scheperjans et al., 2008), and thus, we were interested if SC was different with respect to anterior and posterior sub-regions. Hippocampal subfields were segmented using the FreeSurfer v6.0 automated tool (which is not available in FreeSurfer v5.3), which shows a high test–retest reliability, as recently demonstrated (Brown et al., 2020). Based on this reference, we only focused on volumetric subfields with a high cross-sectional and longitudinal test–retest reliability, that is, subfields with a mean intra-class correlation values > 0.77 (areas CA1 and CA3 as well as the subiculum). We also examined group differences in two cortical “control” ROIs, that is, the left and right primary motor cortex (M1), as no previous study revealed any structural abnormality in this region in DD. The volumes of the motor cortices were extracted from the Destrieux parcellation atlas (Destrieux et al., 2010) implemented in FreeSurfer.
2.8 Statistical analysisAnalyses on the morphometric measures (i.e., cortical volume) were conducted for both hemispheres separately using FreeSurfer software 5.3.0 (http://surfer.nmr.mgh.harvard.edu). We first tested (t test within the framework of a general linear model analysis) for differences in cortical volume between groups controlling for age. These analyses were conducted vertex-wise across the whole cortex and corrected for multiple comparisons using Monte Carlo simulations with 10,000 iterations.
To assess differences in seed-based SC, we adopted a linear model at each vertex of the cortex comparing the slopes between groups, that is, “seed × group interaction.” This interaction is also visualized in subsequent plots to indicate the sign of the group-specific slopes. The model comprised the group, age, IQ, reading ability, and the volume of the seed ROI residuals (corrected for age, IQ, reading ability) as independent variables and the volume of each tested vertex as the dependent variable:
All presented results were thresholded at p < 0.05 (two-tailed), corrected for age, IQ, and reading ability. We corrected for age, despite non-significant between group differences in age, because the age range within each group was relatively large (TD: 8.7–14.5 years; DD 9.4–14.3 years). In addition, we controlled for reading ability and IQ scores in all SC and correlation analyses in order to show the specificity of the results. We did not compare groups by sex, as the number of males and females was too low (<10) and unbalanced (see Table 1) to conduct a meaningful statistical comparison. Monte Carlo simulations with 10,000 iterations and a cluster-wise threshold of p < 0.05 were conducted in order to correct for multiple comparisons. We displayed the results on the average brain of the participants in our study sample.
For ROIs showing significant group differences, we performed a seed × summary score interaction term (the summary score corresponds to the mean percentage of correctly solved addition and subtraction tasks, see Table 1) to examine the interaction between SC and global mathematical skills across both groups. The following model was used to test the seed × summary score interaction:
Values of seed residuals, summary score, and interaction term were mean centered to minimize the multi-collinearity between these variables. In brain regions where the slope significantly differed from zero, the SC between the tested vertex and the interaction term are statistically associated. The presented results were thresholded at p < 0.05 (two-tailed), corrected for age, IQ, reading abil
留言 (0)