
記住我


Synovial sarcoma is a rare tumor arising in adolescents and young adults, usually in the extremities.1 Therapy for patients with localized disease is based on surgery followed by external radiotherapy.2 The 5-year survival rates vary from 40% to 60%.3 Recurrences may be local (30%-50%) or distant (40%), with the lungs being the most common site of distant metastases.3 The standard therapy for advanced disease is systemic chemotherapy with doxorubicin and/or ifosfamide.2 Median overall survival is 12-18 months.4 More effective therapeutic options for advanced synovial sarcoma are therefore highly desired.
Frizzled homolog 10 (FZD10) is a transmembrane protein belonging to the Frizzled family.5 It is overexpressed in most synovial sarcomas and absent or very low in normal adult tissues except for the placenta.6 Therefore, FZD10 is a promising therapeutic target for synovial sarcoma. A preclinical study with an anti-FZD10 antibody radiolabeled with the β-emitter yttrium-90 (90Y) showed strong antitumor effects in a SYO-1 synovial sarcoma mouse model without significant toxicity.7 These findings support the clinical development of an antibody targeting FZD10 as a specific tool for radionuclide delivery to synovial sarcoma cells. A phase 1 trial of the 90Y-labeled anti-FZD10 antibody OTSA101 for synovial sarcoma patients was recently conducted.8 Some of the enrolled patients showed a stable-disease response to the therapy for recurrent sarcomas. The development of new treatments is important to provide additional options to patients with stable disease.
The clinical efficacy of targeted radionuclide therapy with α-particle emitters for solid cancer has been demonstrated.9 α-Particle emitters have a greater linear energy transfer than β-emitters and deposit more energy to tumor cells (Figure S1).10 A previous preclinical study demonstrated that the α-emitting astatine-211 (211At)-labeled antibody OTSA101 had marked antitumor effects in the synovial sarcoma mouse model SYO-1 but did not achieve a complete response.11 Actinium-225 (225Ac) is an α-emitting radionuclide that generates a total of four α-particles in the decay chain.12 The half-life of 225Ac is longer than that of 211At and more appropriate for the pharmacokinetics of antibodies, therefore FZD10-targeted radioimmunotherapy (RIT) with 225Ac is expected to have higher efficacy.
In the present study, we first evaluated the effect of 225Ac labeling on binding of the anti-FZD10 antibody OTSA101 to SYO-1 synovial sarcoma cells. A biodistribution study of 111In-labeled OTSA101 was conducted in SYO-1 tumor-bearing mice. The absorbed doses of 90Y- and 225Ac-labeled OTSA101 were estimated on the basis of the biodistribution data. Finally, the antitumor effects of 90Y- and 225Ac-labeled OTSA101 were assessed in the SYO-1 mouse model and histologic analysis was conducted.
2 MATERIALS AND METHODS 2.1 AntibodyThe humanized chimeric antibody OTSA101, which recognizes human FZD10 but not murine FZD10, was provided by OncoTherapy Science, Inc. As a control, human IgG1 was purchased from Millipore Sigma.
2.2 Cell cultureA human synovial sarcoma cell line, SYO-1, was gifted from Dr A. Kawai (National Cancer Center, Tokyo, Japan). The cells were cultured in DMEM (FUJIFILM Wako Pure Chemical Corporation) containing 10% fetal bovine serum (Thermo Fisher Scientific Inc.) in 5% CO2 at 37°C.
2.3 Antibody radiolabelingAntibodies were conjugated with p-SCN-Bn-DOTA (DOTA, Macrocyclics) as previously described.13 Briefly, antibodies (5 mg/mL) were reacted with four equal molar amounts of DOTA in 50 mmol/L borate buffer (pH 8.5) for 16 hours at 37°C. The DOTA to antibody conjugation ratios were approximately 2.8 each as determined by radio-thin-layer chromatography (TLC) with 80% methanol. The DOTA-conjugated antibody was purified by elution with 0.1 mol/L acetate buffer (pH 6.0) using a Sephadex G-50 (GE Healthcare Bio-Sciences) column. 111InCl3 (Nihon Medi-Physics) or 90YCl3 (Perkin Elmer) was incubated in 0.5 mol/L acetate buffer (pH 6.0) for 5 minutes at room temperature. Each was mixed with the DOTA-antibody conjugate and incubated for 60 minutes at 37°C. Radiolabeling of the antibody with 225Ac was conducted as described previously.14 225AcNO3 (Oak Ridge National Labs) dissolved in 200 mmol/L UltraPur™ HCl (Kanto Chemical Co., Inc.) was added to 2 mol/L tetramethylammonium acetate (Tokyo Chemical Industry) and 150 g/L l-ascorbic acid (Millipore Sigma). DOTA-conjugated antibody was added and the mixture was incubated for 60 minutes at 37°C. The radiolabeled antibody was purified using an Amicon Ultra centrifugal filter (Merck Millipore) and the purified antibody was analyzed by radio-TLC. The specific activities were 7.8 ± 1.6 kBq/μg for 111In-labeled OTSA101, 10.5 ± 5.4 kBq/μg for the 111In-labeled control antibody, 518.4 ± 37.6 kBq/μg for 90Y-labeled OTSA101, 481.1 kBq/μg for the 90Y-labeled control antibody, 0.6 ± 0.4 kBq/μg for 225Ac-labeled OTSA101, and 0.6 ± 0.3 kBq/μg for the 225Ac-labeled control antibody. The radiochemical yields were 80.1 ± 18.3% for 111In-labeled OTSA101, 91.0 ± 5.2% for the 111In-labeled control antibody, 93.4 ± 5.8% for 90Y-labeled OTSA101, 90.2% for the 90Y-labeled control antibody, 31.3 ± 14.4% for 225Ac-labeled OTSA101, and 33.1 ± 10.1% for the 225Ac-labeled control antibody. The radiochemical purities were greater than 96% after purification.
2.4 Cell binding and competitive inhibition assaysFor the competitive inhibition assays, SYO-1 cells (2.0 × 10⁷) in phosphate-buffered saline with 1% BSA (Millipore Sigma) were incubated with 111In-labeled antibodies in the presence of varying concentrations of intact OTSA101, DOTA-conjugated OTSA101, or control antibody (0, 0.02, 0.07, 0.2, 0.7, 2.0, 6.1, 18.2, and 54.5 nmol/L) on ice for 60 minutes. After washing, cell-bound radioactivity was measured with a gamma counter (Wizard2 Automatic Gamma Counter, PerkinElmer). The dissociation constant was estimated by applying data to a one-site competitive binding model using GraphPad Prism 8 software (GraphPad Software).
For the cell binding assays, SYO-1 cells (2.0 × 10⁷) in phosphate-buffered saline with 1% BSA were incubated with 111In and 225Ac-labeled antibodies on ice for 60 minutes. After washing, cell-bound radioactivity was measured using a gamma-counter with an energy window of 150-350 keV for 111In and 200-300 keV for 225Ac (Wizard2 Automatic Gamma Counter).
2.5 Tumor modelThe animal experimental protocol was approved by the Animal Care and Use Committee of the National Institutes for Quantum and Radiological Science and Technology (13-1022, 26 May 2016), and all animal experiments were conducted following the Guidelines regarding Animal Care and Handling. SYO-1 cells (5 × 10⁶) were subcutaneously inoculated into male nude mice (BALB/c-nu/nu, 4 weeks old; CLEA Japan) under isoflurane anesthesia.
2.6 Biodistribution of radiolabeled antibodyWhen tumor volumes reached approximately 100 mm3, mice (n = 5/time-point), were intravenously injected with 111In-labeled antibodies (37 kBq) in a total of 30 μg of antibody adjusted by adding the intact antibody. The mice were killed by isoflurane inhalation on days 1, 2, 4, or 7 after injection of 111In-labeled antibodies. Blood was obtained from the heart, and the tumor, lung, liver, spleen, pancreas, intestine, kidney, muscle, and bone were dissected and weighed. Radioactivity was measured with a gamma counter (PerkinElmer). Uptake is represented as the percentage of injected dose (radioactivity) per gram of tissue (% ID/g).
2.7 DosimetryAs described previously,13, 15 the absorbed doses of 90Y- and 225Ac-labeled antibodies were estimated using the area under the curve based on the biodistribution data of 111In-labeled antibodies and the mean energy emitted per transition of 90Y, 1.495 × 10⁻¹³ Gy kg (Bq s)−1, and 225Ac, and all the daughter nuclei with corrections for branching, 4.6262 × 10⁻¹² Gy kg (Bq s)−1.16 The bone marrow absorbed dose was based on the blood data, considering a red marrow-to-blood activity ratio of 0.4.17 Radiation weighting factors of 1 and 5 were used for 90Y and 225Ac, respectively, as recommended by the Medical Internal Radiation Dose Committee.18 This biologically effective dose (BED) is expressed in barendsen (Bd).19
2.8 Radioimmunotherapy with 90Y- and 225Ac-labeled antibodiesThe mice were intravenously injected with intact OTSA101 (0 MBq, n = 5), 90Y-labeled control antibody (1.85 MBq, n = 5), 225Ac-labeled control antibody (0.01 MBq, n = 5), 90Y-labeled OTSA101 (1.85 MBq, n = 5), or 225Ac-labeled OTSA101 (0.01 MBq, n = 5) in a total of 30 μg of antibody adjusted by adding the corresponding unlabeled antibody. Tumor sizes and body weights were measured at least twice a week for 4 weeks after administration. Tumor size was measured using a digital caliper, and the tumor volume was calculated according to the following formula: tumor volume (mm3) = (length × width2)/2. When the tumor volume reached more than 800 mm3 and body weight loss was more than 20% compared with that at day 0, the mouse was humanely killed by isoflurane inhalation.
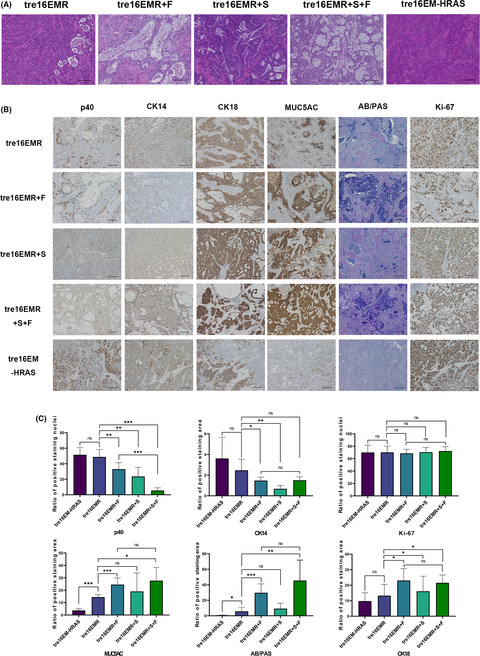
2.9 Histologic analysisSYO-1 tumors were resected from mice on days 1, 3, or 7 after injection with intact OTSA101 (0 MBq, n = 3/time-point), 90Y-labeled OTSA101 (1.85 MBq, n = 3/time-point), or 225Ac-labeled OTSA (0.01 MBq, n = 3/time-point). The tumors were fixed in 10% neutral-buffered formalin, embedded in paraffin, and cut into 1-µm thick sections. The tumor sections were deparaffinized and stained with H&E. CD3 positive lymphocytes were detected by immunohistochemical staining with a rabbit anti-CD3 antibody (SP7; Abcam). Tumor cell proliferation was evaluated by Ki-67 immunohistochemical staining with a rabbit anti-Ki-67 antibody (SP6; Abcam), and an anti-rabbit HRP/DAB Detection kit (Abcam). The Ki-67 index was calculated by counting the percentage of Ki-67–positive tumor cells per >2500 tumor cells in a section with 200× magnification (n = 3). Apoptosis was detected using the DeadEnd Colorimetric TUNEL System (Promega).
2.10 Statistical analysisData are expressed as the means ± standard deviation. Statistical analysis was performed using GraphPad Prism 8 software. Tumor volume data were analyzed by two-way ANOVA. Ki-67 staining data were analyzed by one-way ANOVA with Tukey's multiple comparison test. Uptake data of radiolabeled antibodies were analyzed by unpaired t test. Log-rank tests were used to evaluate Kaplan-Meier survival curves based on the endpoint of tumor volume of 300 mm3. A P value <.05 was considered statistically significant in all experiments.
3 RESULTS 3.1 In vitro antibody characterizationThe competitive inhibition assay provided estimated binding affinities (Kd) of intact OTSA101 and DOTA-conjugated OTSA101 of 1.6 and 1.7 nmol/L, respectively (Figure 1A), suggesting that the chelate conjugation procedure had a limited effect on affinity. The control antibody did not inhibit the binding of 111In-labeled OTSA101 to SYO-1 cells (Figure 1B). Cell binding assays with SYO-1 showed no significant difference between 111In- and 225Ac-labeled OTSA (Figure 1C). No 111In- and 225Ac-labeled control antibodies bound to the SYO-1 cells (Figure 1D).

In vitro characterization of radiolabeled OTSA101. A, Competitive inhibition assay for intact OTSA101 (white circles) and DOTA-conjugated OTSA101 (black circles) with SYO-1 cells. B, Competitive inhibition assay for the control antibody. C, Cell binding assay of 111In- and 225Ac-labeled OTSA101. Data represent the mean + standard deviation. D, Cell binding assay of the 111In- and 225Ac-labeled control antibodies
3.2 Biodistribution of 111In-labeled antibodies in nude mice bearing SYO-1 tumorsTumor uptake of 111In-labeled OTSA101 was significantly higher than that of the 111In-labeled control antibody (P < .01 at days 2 and 4, P < .05 at day 7; Table 1). The maximum tumor uptake of 111In-labeled OTSA101 was 24.8 ± 6.5% ID/g at 4 days after injection. The uptake of 111In-labeled OTSA101 in the blood and lung was significantly higher than the uptake of the 111In-labeled control antibody (P < .01 or P < .05; Table 1), whereas the uptake of 111In-labeled OTSA101 into the liver and spleen was lower than of the 111In-labeled control antibody (P < .01; Table 1). In the other normal organs, there was no significant difference in the uptake of 111In-labeled control antibody and OTSA101 (Table 1).
TABLE 1. Biodistribution of 111In-labeled antibodies in SYO-1 tumor-bearing mice Day 1 Day 2 Day 4 Day 7 Control antibody Blood 12.1 ± 1.2 7.6 ± 1.3 5.3 ± 2.5 3.1 ± 0.7 Lung 5.7 ± 0.7 3.5 ± 0.8 3.6 ± 1.1 2.2 ± 0.5 Liver 12.6 ± 0.7 10.4 ± 1.0 10.0 ± 1.8 7.5 ± 1.0 Spleen 8.1 ± 0.5 7.2 ± 1.1 7.1 ± 1.1 5.9 ± 1.0 Pancreas 5.4 ± 8.0 1.5 ± 0.2 1.5 ± 0.3 1.2 ± 0.1 Intestine 2.2 ± 0.8 1.8 ± 0.3 1.1 ± 0.3 0.6 ± 0.1 Kidney 13.5 ± 0.8 11.2 ± 2.0 8.0 ± 1.7 5.4 ± 0.8 Muscle 1.1 ± 0.9 0.9 ± 0.6 0.7 ± 0.2 0.5 ± 0.1 Tumor 8.3 ± 2.0 8.1 ± 3.7 7.3 ± 3.0 7.6 ± 2.9 OTSA101 Blood 21.6 ± 3.1** 14.9 ± 0.9** 10.1 ± 3.6* 4.3 ± 2.0 Lung 7.8 ± 1.0** 5.6 ± 0.7** 4.1 ± 1.8 2.4 ± 1.1 Liver 7.2 ± 0.6** 5.8 ± 0.7** 5.0 ± 0.7** 3.9 ± 0.5** Spleen 5.6 ± 0.8** 5.5 ± 0.3* 5.2 ± 0.6* 3.6 ± 0.5* Pancreas 2.3 ± 0.2 1.9 ± 0.2 1.2 ± 0.2 0.6 ± 0.2 Intestine 2.1 ± 0.2 1.9 ± 0.3 1.2 ± 0.2 0.6 ± 0.2 Kidney 13.1 ± 1.9 9.4 ± 0.7 5.8 ± 1.4 3.2 ± 0.6** Muscle 1.3 ± 0.2 1.2 ± 0.1 0.8 ± 0.2 0.6 ± 0.2 Tumor 12.1 ± 3.8 21.3 ± 3.1** 24.8 ± 6.5** 17.3 ± 6.1* Note Data indicate as the percentage of injected dose per gram (%ID/g) and as the mean ± standard deviation. 3.3 DosimetryBased on the biodistribution studies, the absorbed doses were estimated when 111In was replaced with 90Y and 225Ac. Table 2 shows estimated absorbed doses when no radiation weighted factor was considered. The absorbed doses of radiolabeled OTSA101 in the lungs, bone marrow, and tumor were higher than that of the radiolabeled control antibody (P < .01; Table 2). The doses of the radiolabeled OTSA101 in the liver and spleen were lower than those of the control antibody (P < .01; Table 2).
TABLE 2. Estimated absorbed dose (Gy/MBq) of 90Y- and 225Ac-labeled antibodies based on the biodistribution data of 111In-labeled antibodies, not considering a radiation weighting factor 90Y 225Ac Control antibody OTSA101 Control antibody OTSA101 Lung 1.5 ± 0.1 2.0 ± 0.1** 74.9 ± 4.7 98.3 ± 6.9** Liver 3.8 ± 0.1 2.1 ± 0.1** 205.0 ± 8.7 108.9 ± 4.1** Spleen 2.6 ± 0.1 1.9 ± 0.1** 143.5 ± 8.7 101.8 ± 7.4** Pancreas 0.9 ± 0.4 0.6 ± 0.0 44.1 ± 13.5 31.9 ± 2.5 Intestine 0.6 ± 0.0 0.7 ± 0.1 28.2 ± 1.7 32.7 ± 3.5** Kidney 3.7 ± 0.3 3.3 ± 0.2* 189.8 ± 12.2 161.6 ± 10.6** Muscle 0.3 ± 0.0 0.4 ± 0.1 16.3 ± 0.9 22.1 ± 3.1** Bone marrowa 1.1 ± 0.1 2.1 ± 0.1** 54.4 ± 3.8 100.3 ± 5.5** Tumor 2.8 ± 0.3 7.0 ± 0.4** 159.0 ± 65.9 408.3 ± 184.7** Note Data indicate the mean ± standard deviation.For calculating a relative biological effect (RBE), the absorbed doses (Gy) from the treatment doses of 90Y- and 225Ac-labeled antibodies were calculated without considering a radiation weighted factor (Table 3). The dose absorbed by tumors treated with 1.85 MBq 90Y-labeled OTSA101 was 3.1-fold higher than that with 0.01 MBq 225Ac-labeled OTSA101 (Table 3).
TABLE 3. Estimated absorbed doses (Gy) from the treatment dose of 90Y- and 225Ac-labeled OTSA101, not considering a radiation weighting factor 1.85 MBq 90Y-control antibody 1.85 MBq 90Y-OTSA101 0.01 MBq 225Ac-control antibody 0.01 MBq 225Ac-OTSA101 Lung 2.7 3.6 0.8 1.0 Liver 7.1 3.8 2.1 1.1 Spleen 4.9 3.5 1.5 1.0 Pancreas 1.7 1.1 0.5 0.3 Intestine 1.1 1.2 0.3 0.3 Kidney 6.9 6.2 1.9 1.6 Muscle 0.6 0.8 0.2 0.2 Bone marrowa 2.1 3.8 0.6 1.0 Tumor 5.2 13.0 1.6 4.2Regarding the efficacy and safety, the BED (Bd) considering radiation weighting factors of 1 for 90Y and 5 for 225Ac are shown in Table 4. The BED to bone marrow from 0.01 MBq 225Ac-labeled OTSA101 was 1.3-fold higher than that from 1.85 MBq 90Y-labeled OTSA101 (Table 4). The doses to organs were higher when injected with 225Ac-labeled OTSA101 than with 90Y-labeled OTSA101 (Table 4). The BED to tumors from 90Y- and 225Ac-labeled control antibodies was lower than that from 90Y-labeled OTSA101 (Table 4). The doses to some organs such as the liver and spleen from radiolabeled control antibodies were higher than that from radiolabeled OTSA101 (Table 4) because the tumor uptake of the control antibodies was lower, leading to higher uptake in normal organs.
TABLE 4. Biologically effective doses (Bd) from the treatment dose of 90Y- and 225Ac-labeled OTSA101 using radiation weighting factors 1.85 MBq 90Y-control antibody 1.85 MBq 90Y-OTSA101 0.01 MBq 225Ac-control antibody 0.01 MBq 225Ac-OTSA101 Lung 2.7 3.6 3.8 5.0 Liver 7.1 3.8 10.5 5.6 Spleen 4.9 3.5 7.3 5.2 Pancreas 1.7 1.1 2.3 1.6 Intestine 1.1 1.2 1.4 1.7 Kidney 6.9 6.2 9.7 8.2 Muscle 0.6 0.8 0.8 1.1 Bone marrowb 2.1 3.8 2.8 5.1 Tumor 5.2 13.0 8.1 20.8 3.4 Treatment effects of radiolabeled antibodies in nude mice bearing SYO-1 tumorsThe tumors in mice injected with intact OTSA101, and 90Y- and 225Ac-labeled control antibodies rapidly increased in size (Figure 2A). In mice treated with 90Y- and 225Ac-labeled OTSA101, marked antitumor effects were observed (P < .01, vs intact OTSA101, and 90Y- and 225Ac-labeled control antibodies; Figure 2A). In the group treated with 90Y-OTSA101, the tumor size decreased in the first 14 days after injection and thereafter gradually increased in all the mice (Figure 2A). Treatment with 225Ac-OTSA101 induced significant tumor reduction. Notably, the tumors disappeared in three of the five mice, and no regrowth was observed until the end of the study period (Figures 2A and S2).

Therapeutic efficacy of 90Y- and 225Ac-labeled antibodies in SYO-1 tumor-bearing mice. A, Tumor growth curves in each mouse after injection with intact OTSA101 and 90Y- and 225Ac-labeled antibodies (thin lines). Bold lines indicate the mean. CR, complete response. B, Kaplan-Meier survival curves based on an endpoint of tumor volume ≥300 mm3. **P < .01
Kaplan-Meier survival curves based on the endpoint of tumor volume of 300 mm3 are shown in Figure 2B. Injection with 90Y- and 225Ac-labeled OTSA101 significantly prolonged survival compared with the intact and radiolabeled control antibody groups (P < .01). No significant difference was detected between the two radiolabeled OTSA101 groups (Figure 2B).
None of the mice showed significant body weight loss (Figure S3A). No obvious damage from radiolabeled treatments was detected in the bone marrow of mice treated with 90Y- or 225Ac-labeled OTSA101 (Figure S3B).
3.5 Histologic analysis of SYO-1 tumors treated with radiolabeled OTSA101Tumors treated with intact OTSA101 showed biphasic features consisting of spindle cells and polygonal epithelial cells, and several mitotic cells (Figure 3A, upper panels). These characteristics are consistent with previous observations.20 In tumors treated with 90Y-labeled OTSA101, necrosis and hemorrhage were observed on day 1, and tumor cellularity was decreased on day 3. On day 7, the tumor cells were further decreased and fibrous tissue was increased (Figure 3A, middle panels). Tumors treated with
留言 (0)