
記住我

Progressive multiple sclerosis (MS), is characterized by accumulation of disability independent of relapses over time (Kappos et al., 2020). In contrast to the significant advances made in treating relapsing–remitting MS, treatment options for the progressive forms are currently still limited. The main culprit in this lack of effective treatment is the neurodegenerative process driven by chronic demyelination and ongoing axonal loss (Ontaneda & Fox, 2015).
Our recent body of work has extensively discussed the global effects of the local lesion damage on neighboring white matter, as well as the brain's ability to compensate for the damage incurred in patients with or without optic neuritis (ON) (Backner & Levin, 2018). To that end, we have studied both anatomical and functional connectivity using DTI and resting state fMRI data, respectively. In brief, we have shown that following acute damage to the optic nerve, functional connectivity changes are present in patients with ON compared with those with other clinically isolated episodes, though no anatomical changes were found beyond the focal damage in the optic nerve and its subsequent Wallerian degeneration (Backner et al., 2018). In a consecutive study, we aimed to differentiate between visual cortical network topology changes following ON associated either with neuromyelitis optica spectrum disorder (NMOSD) or with MS, by using mathematical graph-theory based tools. A higher degree of connections was seen in both ON groups compared with the non-ON group [patients that suffered from clinically isolated syndrome (CIS), elsewhere in the CNS]. However, information transfer efficiency and modularity were reduced in both CIS groups (with and without ON) as compared with the NMOSD group. Therefore, we concluded that the topological cortical changes in the visual system are associated with the type of neurologic deficit within the limits set on them by the underlying pathophysiology (Backner et al., 2020).
Our aim herein, was to examine whether the changes associated with the abovementioned structural and functional network alterations can still be discerned in progressive MS patients, even years after an acute insult to the optic nerve.
Briefly, our current study suggests that in progressive patients, former local damage to the white matter (ON) causes global remote effects as expressed by reduced visual cortical white matter integrity. On the other hand, what we consider as compensatory abilities of the brain (i.e., visual network connectivity strength) does not appear to differ between patients with or without history of ON. We suggest that these two components may also contribute to the long-lasting disability in progressive patients.
2 METHODS 2.1 ParticipantsBetween January 2015 and June 2018, 48 progressive MS patients (MS-ALL) were enrolled in a longitudinal mesenchymal stem cell therapy study (NCT02166021), conducted at the MS Center/Neuroimmunology Unit of Hadassah-Hebrew University Medical Center. This current study covers only the screening assessment, prior to any therapeutic intervention. All patients met the 2010 revised McDonald criteria for MS (Polman et al., 2011), had a disease duration of at least 3 years, and presented with progressive forms of MS and an EDSS score of 3.5–6.5. The MS-ALL group was divided into two subgroups, according to the patients' prior history of ON, designated as MS-ON (those with a history of ON) and as MS-nON (i.e., without a history of ON). Three MS-ON patients had bilateral ON. Data from these cohorts have been previously published (Backner et al., 2019; Berman et al., 2020; Petrou et al., 2020).
The Hadassah-Hebrew University Medical Center Ethics Committee approved this study. All participants signed a written informed consent.
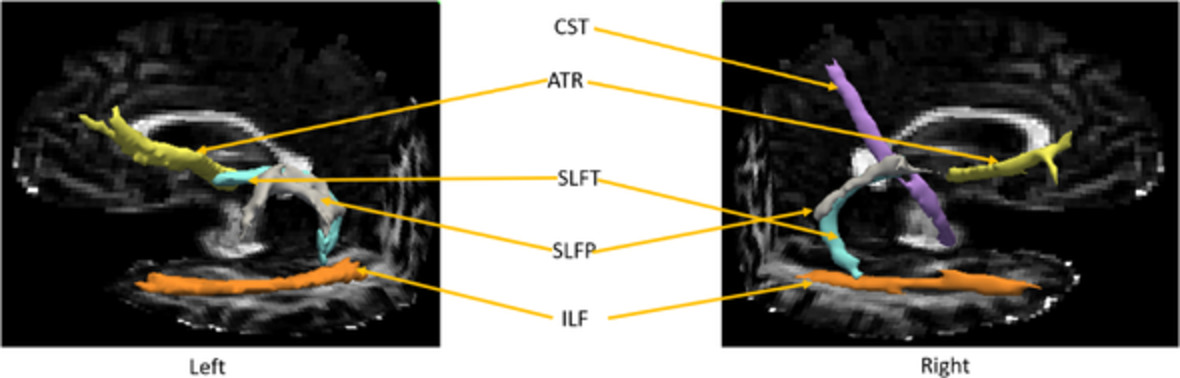
2.2 Data acquisition and analysisMRI data were acquired on a 3-Tesla scanner (16 on Siemens Trio; 32 on Siemens Skyra) using a 32-channel standard head coil. Anatomical MRI sequences included T1-weighted images (MPRAGE; TE_trio/TE_skyra/TR = 2.98/2.26/2,300 ms, flip angle_trio/flip angle_skyra = 9/8, voxel size 1 × 1 × 1 mm), as well as fluid-attenuated inversion recovery-weighted images (FLAIR; TE_trio/TE_skyra/TR = 349/304/4,800 ms, flip angle = 120) and diffusion-weighted imaging [DWI; TE/TR_trio/TR_skyra = 94/8,224/8,400 ms, flip angle = 90, slice thickness 2 mm, high b-value (1,000 s/m2) obtained by applying gradients along 64 different diffusion directions, including one average]. Preprocessing and tractography were performed using the mrVista software package (VISTA Lab, Stanford University). Preprocessing included removing eddy current distortions and motion correction using a rigid body alignment algorithm. This was done through the standard BrainVoyager preprocessing pipeline. Full-brain tractography was performed using the AFQ software (automated fiber quantification; Yeatman, Dougherty, Myall, Wandell, & Feldman, 2012), through a deterministic streamlines tracing technique algorithm.
As previously described in detail (Backner et al., 2019), lesion load was measured on FLAIR scans, using the lesion segmentation toolbox (LST; Schmidt et al., 2012) of the SPM software for automatic lesion detection, and manually corrected as needed.
Resting state blood oxygenation level dependent (BOLD) fMRI measurements were obtained with a gradient-echo echo-planar imaging sequence (TE/TR_trio/TR_skyra = 23/2,000/1,710 ms, flip angle = 90, imaging matrix = 64 × 64, FOV = 192 × 192 mm, 34 slices, 3 mm each with 0.8 mm gap, and 240 repetitions). Patients were instructed to lie with their eyes closed and to remain awake. Standard data preprocessing was performed using the BrainVoyager software package, version 20.6 (Brain Innovation). Data underwent slice scan-time correction, motion correction, and high-pass temporal filtering. Trilinear interpolation was used to co-register functional to anatomical images. Images were transformed into Montreal Neurological Institute (MNI) space.
Visual evoked potentials (VEP; Bravo, Nicolet Biomedical) were recorded by a trained technician using a standard full-field pattern-reversal VEP test. The lateral electrodes were placed at O1 and O2 and the reference electrode was placed at Fz, with the ground electrode placed at the vertex. Two repetitions were recorded for each eye and P100 latencies were extracted and averaged for each eye separately.
Using spectral-domain optical coherence tomography (OCT; Spectralis, Heidelberg Engineering), peripapillary retinal nerve fiber layer (pRNFL) thickness was recorded by a trained technician, with ART function for image averaging. pRNFL values were extracted from standard ring scans around the optic nerve head. Scans underwent quality control (Schippling et al., 2015) and the automatic segmentation results were checked and corrected, if necessary, by an experienced observer.
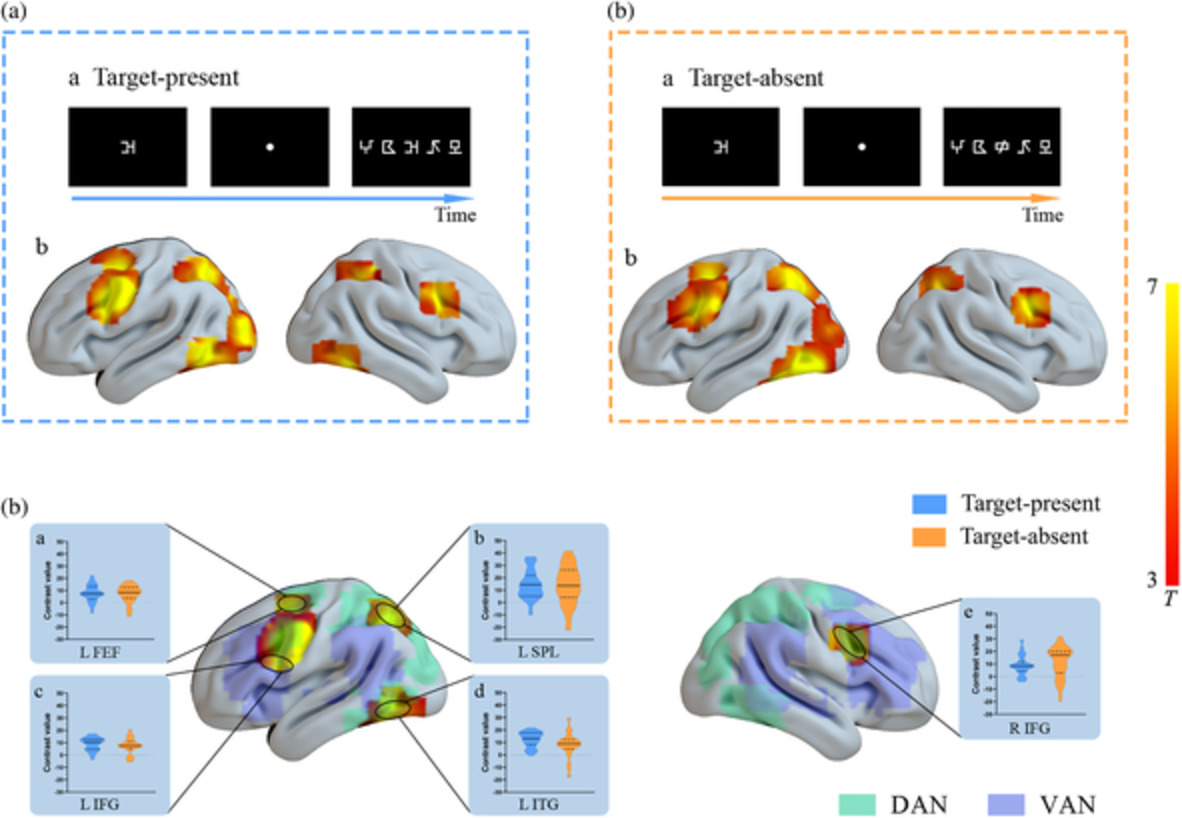
2.3 Network construction and definitionThe resting state network construction and definition presented here were previously described in Backner et al. (2020). Briefly, for both resting state and DTI data, visual network nodes were defined using the probabilistic atlas of Wang, Mruczek, Arcaro, and Kastner (2015). The networks included 50 regions-of-interest (ROIs), covering both hemispheres, each representing a node. The full ROIs defined by Wang et al. were used, without any further resizing (Figure 1).
 Three-dimensional visualization of the visual regions-of-interest used (Wang et al., 2015), shown in (a) lateral; (b) superior; (c) medial; and (d) inferior views. d, dorsal; FEF, frontal eye field; hV4, human visual region 4; IPS0-5, intraparietal sulcus regions 0–5; LO1,2, lateral occipital area1,2; MST, medial superior temporal area; MT, middle temporal area; PHC1,2, parahippocampal area 1,2; SPL1, superior parietal lobule 1; v, ventral; V1-3, visual region 1–3; V3a, visual region 3a; V3b, visual region 3b; VO1,2, ventral occipital region 1,2
For the resting state data, average time courses were extracted for each ROI. Time courses were Pearson-correlated to achieve a representation of connectivity strength between each pair of regions. For DTI data, the full-brain tractography was used to find possible connections between the defined regions, using each pair of regions as end-points for possible fiber groups. Number of streamlines connecting each pair of regions were extracted and used as two alternative modes of network construction. These preparations resulted in two 50 × 50 connectivity matrices per patient (one functional matrix and one anatomical matrix).
2.4 Network analysisWe used weighted networks to examine existence and connection strength (in contrast to our earlier work, in which binarized functional matrices were used; Backner et al., 2020). This method was chosen due to the highly varied number of fiber streamlines achieved in the structural matrix preparation. To extract network metrics, we used the Brain Connectivity Toolbox (Rubinov & Sporns, 2010). As these were previously described in detail (Backner et al., 2020), here we briefly list the metrics used.
The nodal degree of a network is defined as the number of neighbors of each node (region) in the network. Network's density stands for the fraction of present connections to possible connections in the network. The strength of a weighted network is the sum of weights of all the links connected to a specific node. Global efficiency, the inverse of the shortest average path length between any two nodes, gives an estimation of the whole network's efficiency of information transfer. Local efficiency is the global efficiency, calculated at a nodal level (i.e., only for the node's immediate neighbors). Both are measures representing how well integrated the network and specific regions within it are. The clustering coefficient is a representation of the fraction of a node's neighbors that are also neighbors in themselves. Betweenness centrality is the fraction of all shortest paths in the network that pass through a specific node. To examine network segregation, the network's ability to separate into highly interconnected modules, we used the modularity metric, which quantifies the degree to which the network is divisible into nonoverlapping modules.
2.5 Structural–functional couplingStructural–functional connectivity coupling was assessed in the group level. For each participant, nonzero structural matrix links (fiber streamlines) were extracted and compared with their functional counterparts (connection strength), using a mixed-effects model.
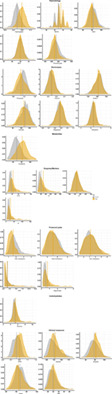
2.6 Statistical analysisAll data for continuous variables is presented as mean ± SD. Normality of data was assessed using Q–Q plots and histograms. The results variables were non-normally distributed, and thus, for univariate comparisons between groups, we used the Kruskal–Wallis test. Multiple comparisons correction was performed using the Holm method.
For the structural–functional coupling, as the dependent variable, functional connectivity, deviated from a normal distribution, the variable was transformed using the Box–Cox method. The gamma parameter for the transformation was calculated using the maximum likelihood-like approach of Box and Cox to select a transformation for the univariate response. Association between functional connectivity, structural connectivity, and ON status was performed using a linear mixed-effects model with participant identifier as the random variable. An interaction term of structural connectivity with ON status was added. As the interaction term was significant, subanalyses of the functional–structural relationship by ON status were performed. Since the residuals of the mixed-effects models were not normally distributed for both the transformed and untransformed variables, a robust mixed-effects regression was used instead of a regular mixed-effects regression. Scanner type and time from ON episode (for the relevant analyses) were included as random variables. Scanner type had no effect on the results. Disease type (PwR/SPMS/PPMS), EDSS, age, and sex also had no effect on any of the results. A two-tailed p-value of less than .05 was considered statistically significant. All statistical analyses were performed using R version 3.5.0 (R Foundation for Statistical Computing, Vienna, Austria).
3 RESULTS 3.1 Research cohort characteristicsForty-eight patients with progressive forms of MS were included in the MS-ALL group. Twenty-one MS patients had prior optic neuritis along their disease course (MS-ON) while the other 27 did not (MS-nON). In the MS-ALL group, 18 had a progressive form of MS with relapses, 21 had a secondary progressive course, and nine suffered from primary progressive disease. All primary progressive patients were included in the MS-nON group (as such patients rarely present with ON). Participants (20 females; 28 males) were at an average age of 47.5 ± 9.5 years at recruitment. This cohort has been previously described in detail in Backner et al. (2019). The two groups did not differ statistically in brain volume and lesion load, or in age or EDSS. Estimations of regional vision-related tissue volumes were also compared between subgroups. No significant differences were found. No significant differences were found between scanners in any of the imaging scans. See Table 1 for cohort characteristics.
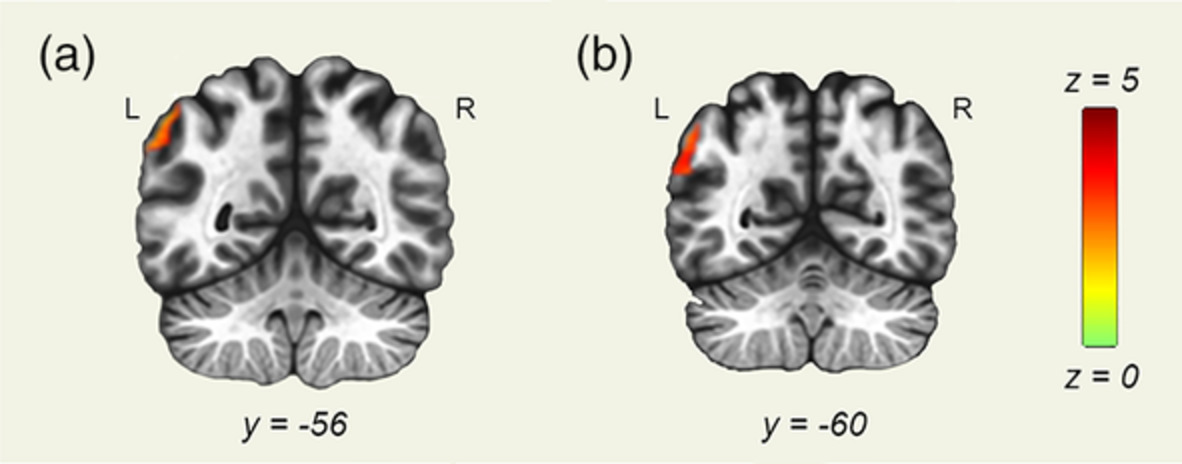
TABLE 1. Study cohort characteristics Characteristics MS-ALL MS-ON MS-nON Participants (n) 48 21 27 Sex (F/M) 20/28 8/13 12/15 Age (years ± SD; range) 47.5 ± 9.5 (26–67) 46.14 ± 8.53 (26–63) 48.56 ± 10.18 (30–67) MS form (PwR/SPMS/PPMS) 18/21/9 8/13/0 10/8/9 EDSS (median; range) 5.75 (3.5–6.5) 5.5 (4–6.5) 6 (3.5–6.5) Normalized brain volumea (mean ± SD) 1,107.23 ± 124.26 1,108.46 ± 137.21 1,106.24 ± 115.77 Lesion volumeb (cm3 ± SD; range) 13.55 ± 11.23 (0–46.79) 14.74 ± 12.03 (0–41.62) 12.58 ± 10.67 (1.06–46.79) VEP (P100 ± SD; range)c 141.19 ± 16.99 (109–176) 147.90 ± 15.31 (120.5–174.5) 135.96 ± 16.65 (109–176) VEP average (both eyes) 136.19 ± 15.54 (106.25–174.5) 140.37 ± 13.65 (115.25–162.5) 132.93 ± 16.38 (106.25–174.5) OCT (RNFL thickness ± SD; range)c 78.74 ± 14.84 (46–113) 73.15 ± 15.93 (46–107) 83.03 ± 12.62 (57–113) OCT average (both eyes) 83.35 ± 14.04 (53–113.5) 79.14 ± 15.15 (53–105.5) 86.88 ± 12.25 (63–113.5) Abbreviations: EDSS, expanded disability status scale; MS-ALL, full cohort; MS-nON, patients without prior optic neuritis; MS-ON, patients with prior optic neuritis; OCT, optical coherence tomography; PPMS, primary-progressive multiple sclerosis; PwR, Progressive multiple sclerosis with relapses; RNFL, retinal nerve fiber layer; SPMS, secondary-progressive multiple sclerosis; VEP, visual evoked potential. 3.2 Structural DTI changesSignificant differences were found in the network density and global efficiency metrics (p = .039 and p = .032, respectively). Structural network density was lower in the MS-ON group than in the MS-nON group (0.155 ± 0.053 and 0.183 ± 0.034, respectively, p = .039). Structural global efficiency also showed a similar pattern, with MS-ON showing a lower efficiency than the MS-nON group (0.031 ± 0.013 and 0.038 ± 0.011, respectively, p = .032). Figure 2 shows these results for the two groups. No significant differences were found between the two groups in any of the tested individual regions in the nodal metrics, or in any segregation and integration metrics.

(a) Anatomical global efficiency; (b) Anatomical network density. Red—MS-ON subgroup, green—MS-nON group
3.3 Functional fMRI changesNo significant differences were found between the MS-ON and MS-nON groups in any basic network topology or segregation and integration network metrics. No significant differences were found for individual regions.
3.4 Structural–functional couplingBoth groups showed significant associations between structural (fiber streamlines number) and functional (connection strength) network data (p < 10−67 and p < 10−77 for untransformed and transformed data, respectively). However, as a significant interaction was found between ON status and the structural-functional coupling (−2.659E-05, p = 2.75E-05), the data was subanalyzed by ON status, revealing a higher regression coefficient for the MS-nON group compared with the MS-ON group (1.05E-04, p = 1.33E-121 and 7.68E-05, p = 7.71E-67, respectively). This shows a stronger structural–functional coupling in the MS-nON compared with the MS-ON group (Figure 3).

Structural–functional coupling
3.5 VEP, OCT, and EDSSNo associations were found with any of the VEP latencies' measures, nor with the RNFL thickness and the visual cortex anatomical and functional connectivity measures (or with worst eye data neither with the average parameters). Correlations performed between these clinical variables and the functional and structural network measures did not produce any significant results.
4 DISCUSSIONIn this study, we examined whether changes associated with ON in the structural and functional visual networks can still be discerned in progressive MS patients, even years after the acute ON-insult. To that end, we included 48 progressive MS patients, 21 of whom had an ON episode in their disease history. Following our previously published results that made use of connectivity methods in early-MS/clinically isolated syndrome ON patients (Backner et al., 2018; Backner et al., 2020) and the behavioral findings of this particular cohort (Backner et al., 2019), we hypothesized that signs of functional connectivity changes would still be apparent in patients with prior ON. This, possibly, as a remnant of functional reorganization respond to the acute damage.
Our main findings, however, appear to negate that hypothesis. No functional differences were discerned between the functional visual networks of patients with prior ON compared with those without. On the other hand, the structural visual network appeared to be more damaged in patients with prior ON, suggesting trans-synaptic degeneration, a possibility supported by an extensive body of data in the literature (Gabilondo et al., 2014; Pfueller et al., 2011) but not seen in our early-stage MS/clinically isolated syndrome studies (Backner et al., 2018; Raz, Bick, Ben-Hur, & Levin, 2015). Furthermore, while a structural–functional coupling was found in both groups, the coupling was significantly lower in the MS-ON group, suggesting two possible explanations: either trans-synaptic degeneration, or that remnants of the functional reorganization that we have observed in previous studies disturb the coupling between the networks.
Over the last decade there has been growing interest in the use of visual measures as useful tools for MS prognosis and tracking (Balcer, Miller, Reingold, & Cohen, 2015; Galetta et al., 2015; Zimmermann et al., 2018). At the basis of this trend stands the fact that ON is a prevalent symptom, affecting roughly 50% of the patients along the course of their disease (Toosy, Mason, & Miller, 2014). Furthermore, the visual system, which is unique in both its clear definition and the straightforward relationship between its structure and function, enables clear tracking of the consequence of a demyelinating attack. Most previous studies dealing with visual tools and visual-related measures in MS focused on the disease's early stages, making assumptions on ON sequel as predictive value for disease prognosis. Yet, the advantages of the well-defined visual system, as a fine model at the early stages of MS, may drastically change as the disease progresses, due to accrual of disability.
Recently, studying the same cohort of progressive patients as in the current study, we found that despite the passage of time, previous ON episodes still left their mark in the patient's visual system. This was characterized by persistently prolonged VEP latencies in the affected eyes of ON patients in comparison to both their fellow eyes and the eyes of patients who have not had ON. Additionally, even years after the acute episode, visual measures of the affected eyes including visual acuity, low contrast letter acuity, motion and color perception, as well as macular volume and pRNFL thickness measured by OCT, were notably reduced as compared with unaffected eyes (Backner et al., 2019). Thus, when speaking about reorganization as a possible mechanism for compensating for the visual disability, it is clear that the need still exists even years after the acute event. However, and in contrast to what we noticed close to the acute event, no cortical connectivity alteration was found in this progressive cohort.
This finding, though previously not shown in context of the visual system, is not surprising as it was already reported, almost a decade ago, that brain remodeling decreases with MS disease progression (Roosendaal et al., 2010). As summarized nicely in (Bassi et al., 2017), increased and decreased resting state fMRI-based functional connectivity alterations involving different networks were reported in MS patients. These contrasting differences were suggested to be driven by different disease phenotypes, clinical characteristics and neuroradiological findings, as well as different methodological approaches. A recent study that investigated the sensorimotor network efficiency in MS patients reported correlation to their disability score as measured by the EDSS: more synchronization was found in the more disabled group, even after correcting for structural damage. Though more patients in the more disabled group suffered from a progressive form of the disease, no clear reference to time from the motor episode was mentioned (Strik et al., 2020). Dissimilar to disease course that is associated with motor dysfunction, the visual system is usually an early manifestation of the disease. Thus, we had the opportunity to test connectivity in progressive patients who suffered from localized damage within the same network years ago, contrasting their results to patients at the same disease stage who had not suffered a similar injury. It is important to note that another kind of reorganization that we previously suggested, binocular compensation to synchronize input arriving at the primary visual cortex from both eyes (Raz, Chokron, Ben-Hur, & Levin, 2013), was also not evident in the progressive cohort (Backner et al., 2019). Therefore, we believe that early synchronization changes may be lost in patients with increasing brain damage, suggesting that cortical reorganization is possibly an early and finite phenomenon in MS.
Another aspect of the current work relates to secondary degeneration following a demyelinating attack. Degeneration from a focal lesion may progress to anterograde or retrograde directions. Anterogradely, it can manifest as Wallerian degeneration, where the axons distal to the lesion degenerate, as we reported in regard to optic tract diffusivity measurements following an ON event (Backner et al., 2018; Kuchling et al., 2018; Raz et al., 2015). Additionally, the damage can spread beyond the injured neuron, past its synapse and into neighboring neurons, as in trans-synaptic degeneration. Contradicting data exist in regard to that issue (Dasenbrock et al., 2011; Gabilondo et al., 2014; Kolbe et al., 2012; Pfueller et al., 2011; Reich et al., 2009). Herein, and in light of our previous reports (Backner et al., 2018), we suggest that the differences between studies supporting and opposing trans-synaptic degeneration could be explained by differences in time from the acute episode. It seems that the longer the disease progresses, MS patients develop increasing anterograde trans-synaptic damage to the afferent visual pathway.
The relationship between the structure of the visual pathways and conduction velocity as measured by VEP has been investigated before. In the current progressive cohort, we previously reported that in the non-ON subgroup there is a relationship between the VEP latency and both retinal damage and optic radiations' lesion load. In addition, we reported that quantitative MRI values, sampled along the optic radiations, were correlated with VEP latencies and that combining these parameters explained more than 40% of the intersubject variance in conductions velocities (Berman et al., 2020). Other groups, as well, reported VEP latencies to be correlated with lesion load and diffusion parameters along the optic radiations (Alshowaeir et al., 2014; Alshowaeir, Yiannikas, Fraser, & Klistorner, 2018; Sinnecker et al., 2015). However, herein, we could not detect any correlations between the anatomical network composition and the latencies, neither in the ON group nor in the non-ON group. We suggest that this variability lies in the differences between the methods. The current method estimates the integrity of the cortical visual system, taking into consideration regions of interest in low and high visual areas. VEP latencies theoretically reflect retinal, thalamic, and early cortical processing times, as well as conduction time along the visual white matter pathway and therefore, not surprisingly, do not correlate with cortical network efficacy as was measured here.
Finally, the finding of reduced structural-functional coupling in the ON subgroup can be interpreted in light of the other results as an integrative viewpoint. A recent study that evaluated the longitudinal evolution of structural-functional coupling, in the first year following clinically isolated syndrome, found decoupling in the salience, visual, and somato-motor networks, suggesting functional reorganization to occur at early stages (Koubiyr et al., 2019). Following this report and our previous studies that included patients early in their disease course, we suggest that the reduced coupling in the ON group is a remnant of the functional reorganization we have observed previously.
It should be noted that beyond the basic preprocessing and removal of low-frequency drifts, no specific removal of physiological noise, such as white matter/CSF regression, was performed on the data, which may affect the results presented. A main limiting factor of this study is its cross-sectional design, particularly regarding our attempt to draw conclusions about dynamic changes in the structure and function of the visual system following ON. To that end, it is important to emphasize that while our conclusions relate to the progressive state on its own, they are described in light of accumulative data about this topic in earlier phases of the disease. The lack of group of healthy controls, unavailable to us at this time, could also have shed further light on the purported lack of functional compensation observed in our study, possibly showing that both patient groups are altered to the same extent compared with healthy controls. Another issue that should be addressed is the lack of primary-progressive patients in the MS-ON group. Whereas ON is a common symptom in relapsing–remitting and secondary-progressive MS patients, it is very rare in primary-progressive patients and thus it is not surprising that no such patients were included in this cohort with its limited size. However, disease type did not affect any of the analyses performed. And finally, it is important to note the ON diagnosis was made on basis of documentation of hospitalization and past treatment for the disease. Since this is a cross-sectional study that was conducted many years following the acute event, and in the light of reports that indicate over/misdiagnoses in 60% of optic neuritis cases (Stunkel, Kung, Wilson, McClelland, & Van Stavern, 2018), there is a possibility that a diagnostic error had occurred.
5 CONCLUSIONSTo conclude, the continued disability accumulation that is observed in progressive MS patients and the limited response to current treatment options, could be explained by widespread degeneration, driven by chronic demyelination and axonal loss. Another facet of the problem may reside in the brain's ability to adapt itself to the damage incurred and the loss of that ability as the disease progresses. To that end, we suggest that the limited ability of the brain to compensate should be integrated into the equation, when attempting to explain disability progression in MS. Future prospective of this unique dataset should investigate other compensatory mechanisms that may appear in progressive stages of the disease such as connectivity alterations within and between functional brain networks at whole-brain level, and not only within the visual network.
CONFLICT OF INTERESTThe authors declare no conflict of interest. The funders had no role in the design of the study; in the collection, analyses, or interpretation of data; in the writing of the manuscript, or in the decision to publish the results.
ETHICS STATEMENTParticipants gave written consent before taking part in the study. Study was approved by the Hadassah Hebrew University Medical Center.
留言 (0)